Pines at Columbia
Nursing Home · South Carolina, SC
CMS overall rating Info The Overall CMS Rating is scored from 1 to 5 stars and combines results from health inspections, staffing levels, and quality measures. Health inspections carry the most weight. Staffing and quality scores can increase or decrease the final rating based on performance compared to state and national standards.

Pines at Columbia

Nursing Home · South Carolina, SC
CMS overall rating Info The Overall CMS Rating is scored from 1 to 5 stars and combines results from health inspections, staffing levels, and quality measures. Health inspections carry the most weight. Staffing and quality scores can increase or decrease the final rating based on performance compared to state and national standards.
Calculator: See prices in your area
Pines at Columbia accepts Medicare, Medicaid, and private pay.

Overview of Pines at Columbia

The Pines at Columbia is an assisted living community located in West Columbia, South Carolina. It offers a comfortable and engaging environment for residents, providing both independence and assistance. The community focuses on individual needs and promotes a healthy lifestyle through compassionate support and wellness programs.
(803) 936-0062

Quality ratings

Measured by Centers for Medicare & Medicaid Services (CMS)

Overall rating Info The Overall CMS Rating combines results from health inspections, staffing levels and quality measures. Health inspections carry the most weight. Staffing and quality scores can increase or decrease the final rating based on performance compared to state and national standards.
▲ 36.5% Above SC avg. ▲ 36.5% Above SC avg.Click the badge to see the full State ranking.Click here to see the full State ranking.
Health Inspection Info Based on the results of the facility's three most recent standard inspections and any complaint investigations. CMS reviews the number, scope, and severity of deficiencies, with more recent findings weighted more heavily.
▲ 45.5% Above SC avg. ▲ 45.5% Above SC avg.Click the badge to see the full State ranking.Click here to see the full State ranking.
Staffing Info Measures average nursing staff hours per resident per day, including Registered Nurses (RNs) and total nursing staff. Ratings are adjusted based on the level of care residents require and are compared to state and national benchmarks.
▲ 35.6% Above SC avg. ▲ 35.6% Above SC avg.Click the badge to see the full State ranking.Click here to see the full State ranking.
Quality Measures Info Based on clinical and physical health indicators reported to CMS, such as hospital readmissions, falls, pressure ulcers, and improvements in mobility. These measures reflect how well residents' health needs are being managed.
▲ 14.6% Above SC avg. ▲ 14.6% Above SC avg.Click the badge to see the full State ranking.Click here to see the full State ranking.

Staffing hours breakdown

Info Daily nursing hours per resident by staff type, reported to CMS. Higher is generally better — compare this facility to state and national averages to see where staffing stands.

Hours per resident per day — compared to South Carolina state averages

Total nursing care / resident Info This home is ranked 6th out of 112 homes in South Carolina. Total adjusted nursing hours per resident per day, combining RN, LPN, and aide time. CMS adjusts this for case-mix so facilities can be fairly compared.
5h 48m per day
Rank #6 / 112Nurse hours — State benchmarkedThis home is ranked 6th out of 112 homes in South Carolina. Shows adjusted nurse hours per resident per day benchmarked to the South Carolina average, with a ranking across 112 South Carolina SNFs. More hours mean more direct care. The national average is about 3.5 hrs; below 3.0 is a red flag.Click the rank badge to see the full State ranking.Click here to see the full State ranking.
This facility South Carolina avg (4h 5m per day)
vs South Carolina avg
+42%
Staff typeHours / Day / Residentvs state avg
Weekend Total Nursing Info Combined nursing hours (RN + LPN + Nurse Aide) per resident per day on weekends. Staffing often drops on weekends — this figure reveals whether the facility maintains adequate coverage outside of weekday hours. 5h 11m per day

Capacity and availability

This home usually has availability

Occupancy lower than 85% suggests more openings may be available.

Lower occupancy than the South Carolina average: 82.1%
Occupancy rate 72.7% Rank #93 / 121Occupancy rate — State benchmarkedThis home is ranked 93rd out of 121 homes in South Carolina. Shows this facility's occupancy rate versus the South Carolina average, with its Statewide rank out of 121. Higher occupancy signals strong local demand and financial stability.Click the rank badge to see the full State ranking.Click here to see the full State ranking.
Avg. Length of Stay 123 days
Occupancy rate
72.7% Rank #93 / 121Occupancy rate — State benchmarkedThis home is ranked 93rd out of 121 homes in South Carolina. Shows this facility's occupancy rate versus the South Carolina average, with its Statewide rank out of 121. Higher occupancy signals strong local demand and financial stability.Click the rank badge to see the full State ranking.Click here to see the full State ranking.
Avg. Length of Stay
123 days
Bed community size
90-bed community Rank #132 / 312Bed count — State benchmarkedThis home is ranked 132nd out of 312 homes in South Carolina. Shows this facility's certified or reported bed count compared to other South Carolina SNFs. Larger communities may offer more amenities, programs, and on-site services for residents and families.Click the rank badge to see the full State ranking.Click here to see the full State ranking.
A larger shared setting that may offer more common spaces and organized community services.

About this community

License Details

Facility TypeCommunity Residential Care Facilities
StatusActive
ExpirationJune 30, 2026
License NumberCRC-2213

Ownership & Operating Entity

Pines at Columbia is administrated by Brian D Shull.

Owner NamePines-Columbia LLC

Therapy & Rehabilitation

1 service
Respite Care

Contact Information

Amenities & Lifestyle

Specific ProgramsServices & Amenities, Clinical Services, Financial Options for Senior Living
Operating HoursMonday - Sunday: 8:00am - 6:00pm

Contact Pines at Columbia

Health Inspection History

Inspections since 2022
Total health inspections 5

South Carolina average 3.9


Last Health inspection on Jun 2025

Total health citations
10 Rank #43 / 113Health citations — State benchmarkedThis home is ranked 43rd out of 113 homes in South Carolina. Shows this facility's total health deficiency citations benchmarked to the South Carolina State average, with a ranking across all 113 SC SNFs. Lower citation counts earn a better rank.Click the rank badge to see the full State ranking.Click here to see the full State ranking.

South Carolina average 13.7

Citations per inspection
2 Rank #13 / 113Citations per inspection — State benchmarkedThis home is ranked 13th out of 113 homes in South Carolina. Shows average deficiency citations per CMS inspection for this facility versus the South Carolina mean across 113 SNFs with citation data. Lower is better.Click the rank badge to see the full State ranking.Click here to see the full State ranking.

South Carolina average 3.44


Health citations are formal notices following inspections when they fail to comply with safety and care standards.

7 of 10 citations resulted from standard inspections; and 3 of 10 resulted from complaint investigations.

Breakdown of citation severity (last 4 years)
Critical Health citations
0
100% better than South Carolina average

South Carolina average: 1


Serious Health citations
0
100% better than South Carolina average

South Carolina average: 0.3

0 critical citations South Carolina average: 1

0 serious citations South Carolina average: 0.3

10 moderate citations South Carolina average: 12.3

0 minor citations South Carolina average: 0.1
Citations history (last 4 years)
Nutrition moderate citation Jun 05, 2025
Corrected

Pharmacy moderate citation Jun 05, 2025
Corrected

Pharmacy moderate citation Jun 05, 2025
Corrected

Pharmacy moderate citation May 09, 2024
Corrected

Staffing Data

Reporting period: October 1 – December 31, 2025 (Q4 2025). Source: CMS Payroll-Based Journal report.

Total staff 93
Employees 62
Contractors 31
Staff to resident ratio 5.81:1
216% better than South Carolina average
South Carolina average ratio: 1.84:1 South Carolina average ratio: 1.84:1See full South Carolina ranking
Avg staff/day 22
Average shift 7 hours
11% worse than South Carolina average
South Carolina average: 7.9 hours South Carolina average shift: 7.9 hoursSee full South Carolina ranking
Total staff hours (quarter) 14,202

Nursing staff breakdown

Q4 2025 · Oct 1 – Dec 31 More info This data comes from the CMS Payroll-Based Journal report covering October 1 – December 31, 2025.
Registered Nurse

Manages medical care and health needs.

RN Staff 14
Average shift length Info Average shift length. Calculated as total hours divided by days worked and average staff per day. 10.7 hours

This role is partially covered by contractors.

Licensed Practical Nurse

Assists with medical care and medications.

LPN Staff 18
Average shift length Info Average shift length. Calculated as total hours divided by days worked and average staff per day. 9.2 hours

This role is partially covered by contractors.

Certified Nursing Assistant

Helps with daily care and mobility.

CNA Staff 27
Average shift length Info Average shift length. Calculated as total hours divided by days worked and average staff per day. 7.3 hours

No contractors work on this role.

Contractor staffing

Q4 2025 · Oct 1 – Dec 31 More info This data comes from the CMS Payroll-Based Journal report covering October 1 – December 31, 2025.

Total hours from contractors

21.9%

3,107 contractor hours this quarter

Licensed Practical Nurse: 6 Speech Language Pathologist: 6 Respiratory Therapy Technician: 5 Registered Nurse: 5 Physical Therapy Assistant: 5 Qualified Social Worker: 2 Physical Therapy Aide: 2

Staff by category

Q4 2025 · Oct 1 – Dec 31 More info This data comes from the CMS Payroll-Based Journal report covering October 1 – December 31, 2025.
Certified Nursing Assistant270275,16492100%7.3
Licensed Practical Nurse126181,6599098%9.2
Registered Nurse95141,1127885%10.7
Respiratory Therapy Technician0559086672%6.4
Speech Language Pathologist0667836773%4.8
Clinical Nurse Specialist7076897278%7.6
Physical Therapy Aide0226626672%5.5
RN Director of Nursing1014965964%8.4
Administrator1014966267%8
Other Dietary Services Staff1014656571%7.2
Physical Therapy Assistant0554627076%4.1
Nurse Practitioner1014485661%8
Occupational Therapy Aide1014016368%6.4
Mental Health Service Worker2023334246%7.9
Qualified Social Worker0221253437%3.7
27 Certified Nursing Assistant
% of Days 100%
18 Licensed Practical Nurse
% of Days 98%
14 Registered Nurse
% of Days 85%
5 Respiratory Therapy Technician
% of Days 72%
6 Speech Language Pathologist
% of Days 73%
7 Clinical Nurse Specialist
% of Days 78%
2 Physical Therapy Aide
% of Days 72%
1 RN Director of Nursing
% of Days 64%
1 Administrator
% of Days 67%
1 Other Dietary Services Staff
% of Days 71%
5 Physical Therapy Assistant
% of Days 76%
1 Nurse Practitioner
% of Days 61%
1 Occupational Therapy Aide
% of Days 68%
2 Mental Health Service Worker
% of Days 46%
2 Qualified Social Worker
% of Days 37%

Penalties and fines

Federal penalties imposed by CMS for regulatory violations, including civil money penalties (fines) and denials of payment for new Medicare/Medicaid admissions.

Source: CMS Penalties Database

No penalties in the past 3 years

No civil money penalties or payment denials were reported in the last 3 years.

Quality of care over time

These measures show how residents usually do over time at this home, based on health outcomes and preventive care.

High-risk clinical events score Info A composite score based on pressure ulcers, falls with injury, weight loss, walking ability decline, and activities of daily living decline. 1.2
86% better than South Carolina average

South Carolina average: 8.7

Long-stay resident measures
Falls with Major Injury Info Percent of long-stay residents experiencing one or more falls with major injury 0.0%
100% better than South Carolina average

South Carolina average: 3.0%

High Risk Residents with Pressure Ulcers Info Percent of long-stay high risk residents with pressure ulcers 2.4%
60% better than South Carolina average

South Carolina average: 6.1%

Urinary Tract Infection Info Percent of long-stay residents with a urinary tract infection 4.8%
189% worse than South Carolina average

South Carolina average: 1.6%

Depressive Symptoms Info Percent of long-stay residents who have depressive symptoms 0.0%
100% better than South Carolina average

South Carolina average: 2.8%

Antipsychotic Use Info Percent of long-stay residents who received an antipsychotic medication 19.1%
31% worse than South Carolina average

South Carolina average: 14.5%

Pneumococcal Vaccine Info Percent of long-stay residents assessed and appropriately given the pneumococcal vaccine 100.0%
11% better than South Carolina average

South Carolina average: 90.5%

Short-stay resident measures
Pneumococcal Vaccine Info Percent of short-stay residents assessed and appropriately given the pneumococcal vaccine 100.0%
26% better than South Carolina average

South Carolina average: 79.5%

Antipsychotic medication increase Info Percent of short-stay residents who newly received an antipsychotic medication 0.5%
72% better than South Carolina average

South Carolina average: 1.7%

Influenza Vaccine Info Percent of short-stay residents assessed and appropriately given the seasonal influenza vaccine 97.5%
25% better than South Carolina average

South Carolina average: 78.0%

Breakdown by payment type

Medicare

86% of new residents, usually for short-term rehab.

Typical stay 25 days

Private pay

10% of new residents, often for short stays.

Typical stay 2 - 3 years

Medicaid

4% of new residents, often for long-term daily care.

Typical stay 7 - 8 months

Facility Characteristics

Source: CMS Long-Term Care Facility Characteristics (Data as of Jan 2026)

Total residents 16
Medicare
10
62.5% of residents
Medicaid
2
12.5% of residents
Private pay or other
4
25% of residents
Programs & Services
Residents Group

Residents meet regularly to discuss policies, care quality, and activities

CCRC

Part of a Continuing Care Retirement Community offering multiple care levels

Active Resident Council

Organized group of residents that meets regularly to discuss facility policies, quality of life, and activities.

Finances and operations

Voluntary non-profit community
Operated by a church.
Home revenue
$12.8M
Surplus of revenue
$33.5K
Voluntary non-profit community Operated by a church.
Home revenue
$12.8M Rank #63 / 116Revenue — State benchmarkedThis home is ranked 63rd out of 116 homes in South Carolina. Shows this facility's annual revenue compared to the South Carolina SNF average. Higher revenue generally means more resources for staffing and capital — read alongside Payroll %.Click the rank badge to see the full State ranking.Click here to see the full State ranking.
Surplus of revenue
$33.5K
Payroll costs Info The portion of the home's budget spent on staff, including nurses, caregivers, and other employees who support care and operations. Rank #57 / 116Payroll — State benchmarkedThis home is ranked 57th out of 116 homes in South Carolina. Shows total annual staff payroll benchmarked to the South Carolina average. Higher payroll investment relative to peers often signals better staffing and less reliance on cheaper contract labor.Click the rank badge to see the full State ranking.Click here to see the full State ranking.
$6.5M
50.7% of revenue Rank #47 / 116Payroll % — State benchmarkedThis home is ranked 47th out of 116 homes in South Carolina. Shows payroll as a percentage of revenue versus the South Carolina average. Well-run South Carolina SNFs typically land around 53–64% — the top third Statewide. Below 25% may signal understaffing or heavy agency use — read with Staffing ratings.Click the rank badge to see the full State ranking.Click here to see the full State ranking.
Other operating costs Info All remaining costs needed to run the home, such as food, utilities, building maintenance, supplies and administrative expenses.
$6.3M
Total costs $12.8M

Who this home usually serves

TYPE OF STAY

Mostly short-term rehab stays

Most residents typically stay for a few weeks or months before returning home or moving on.

Places of interest near Pines at Columbia

Address 10805.9 miles from city center Info Estimated distance in miles from West Columbia's city center to Pines at Columbia's address, calculated via Google Maps.

Calculate Travel Distance to Pines at Columbia

Add your location

Address

Financial Assistance for
Nursing Home in South Carolina

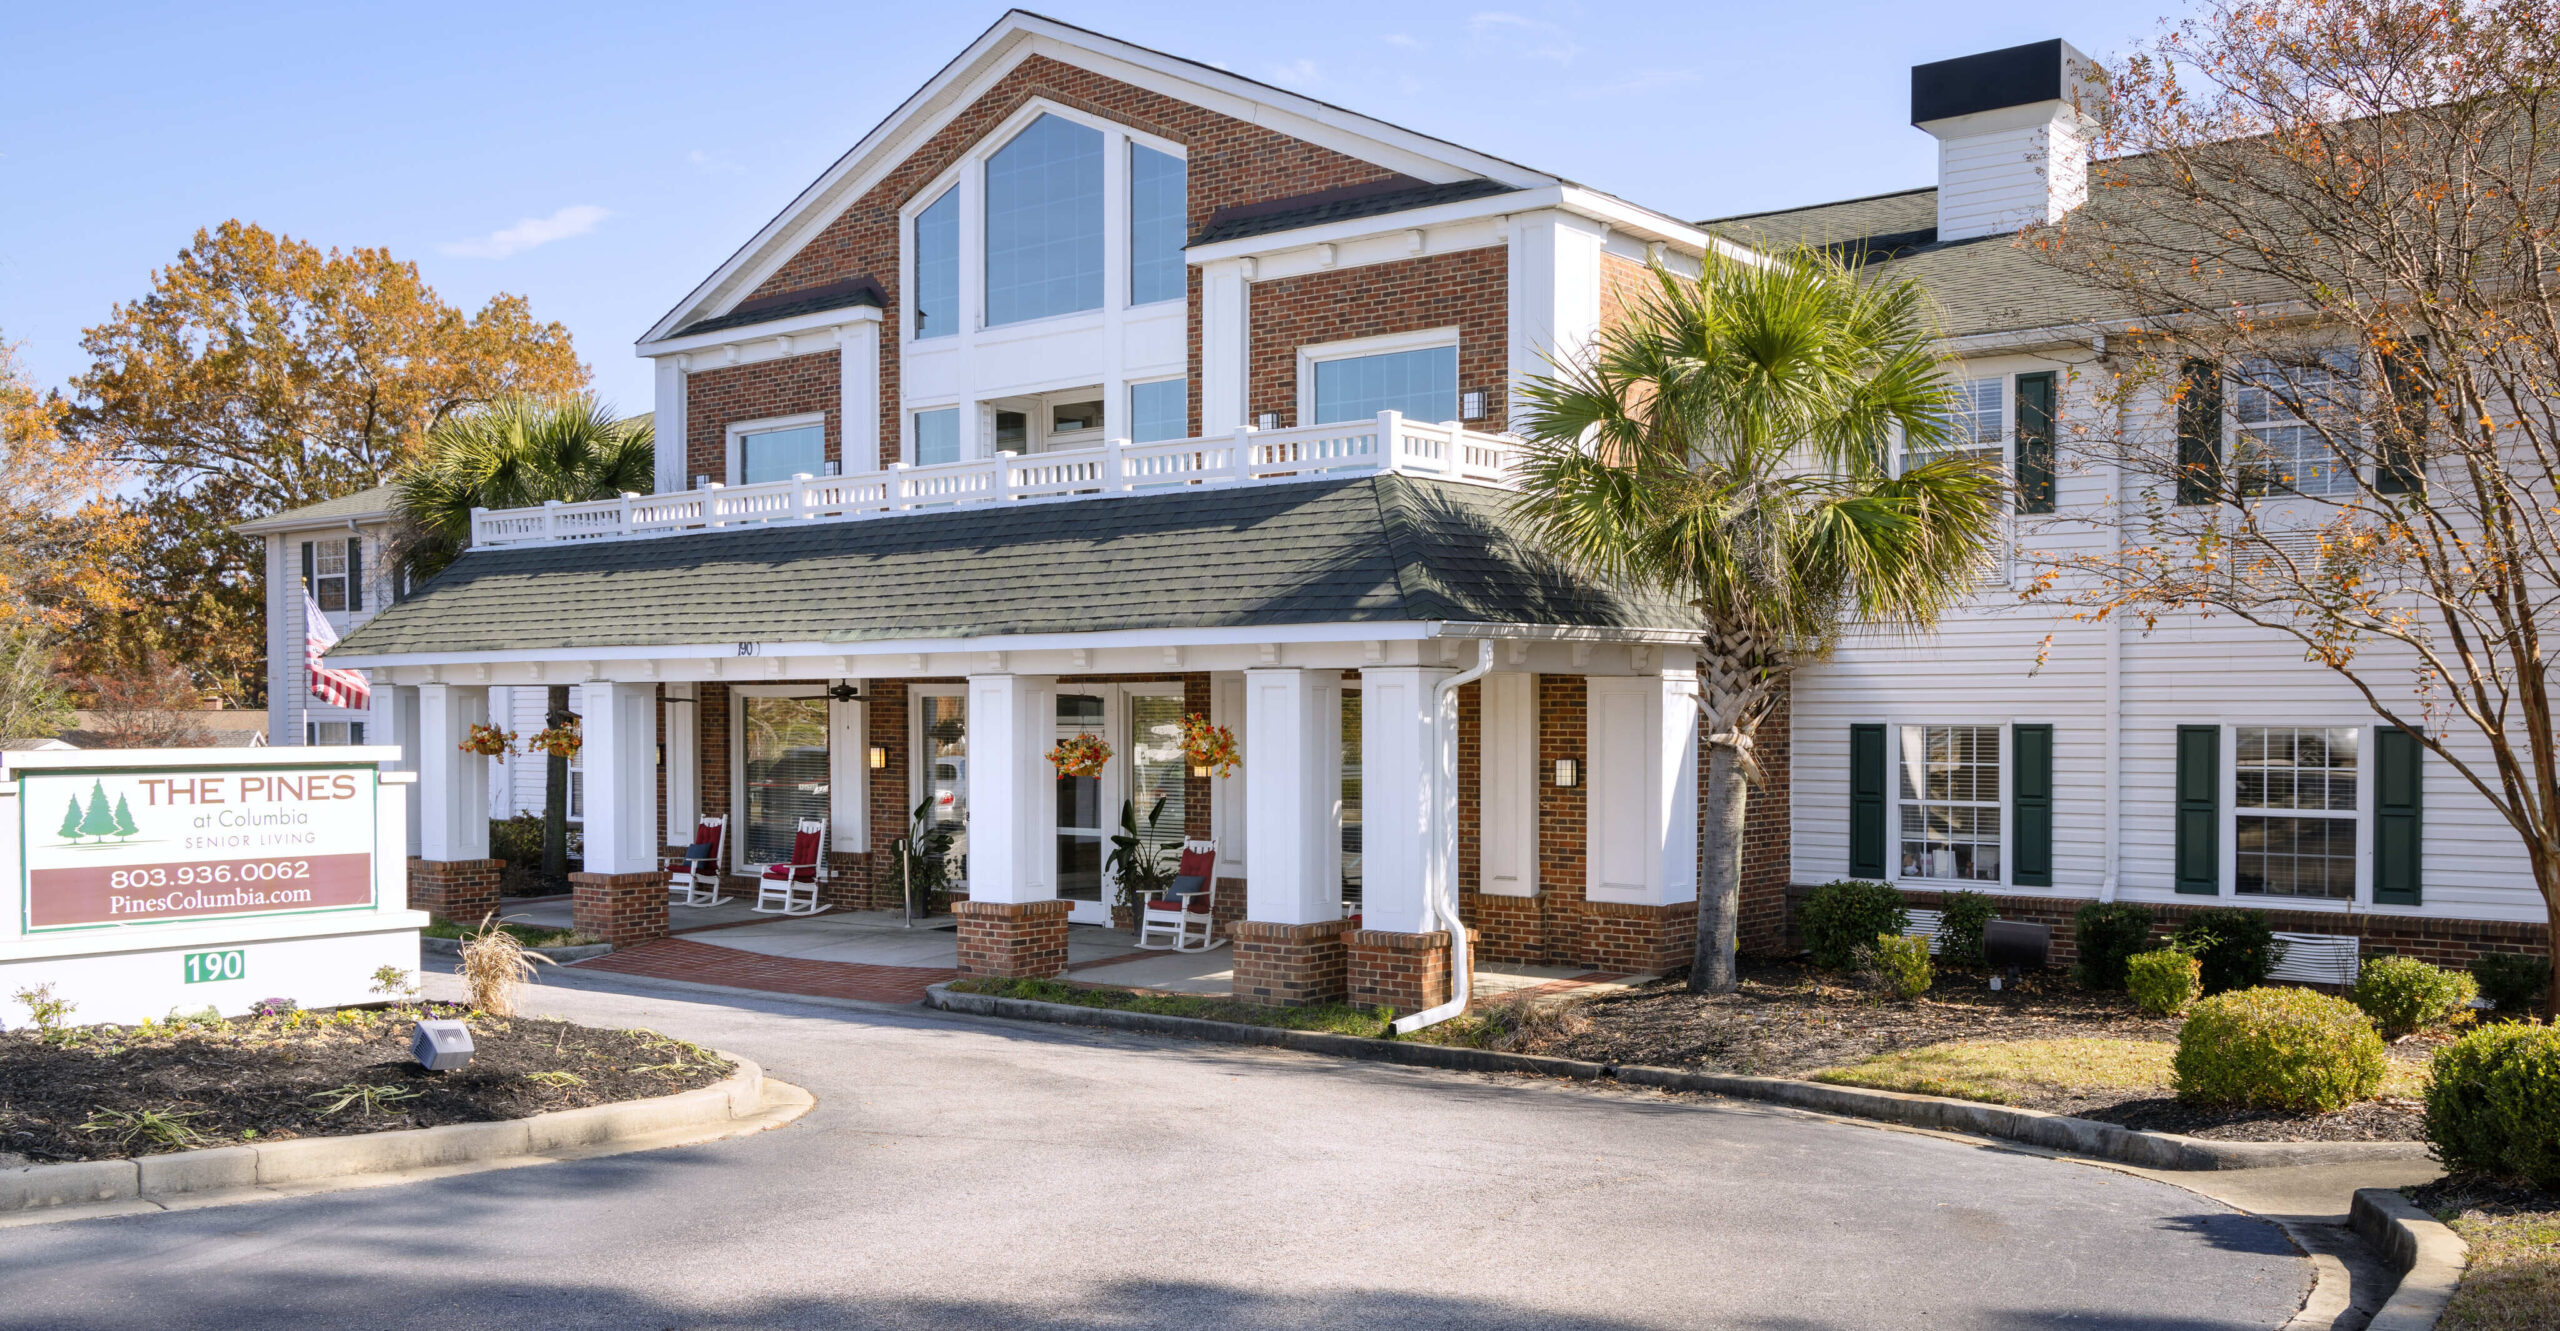
Pines at Columbia is located in WEST COLUMBIA, South Carolina.
Here are the financial assistance programs available to residents in South Carolina.

Get Financial aid guidance

Community Long Term Care (CLTC)

SC Medicaid CLTC

Age 65+ or disabled
General South Carolina resident, Medicaid-eligible, nursing home-level care need.
Income Limits (2025) ~$2,829/month 300% FBR, individual
Asset Limits $2,000 (individual), $3,000 (couple).
SC

High rural demand; waitlists possible.

Benefits
Personal care (5-7 hours/day) Respite (240 hours/year) Adult day care ($60/day) Home modifications ($1,500 avg.)

South Carolina Respite Care Program

SC NFCSP Respite

Age Caregiver of someone 60+ (or with dementia)
General South Carolina resident.
Income Limits No strict limit; prioritizes low-income.
Asset Limits Not applicable.
SC

Limited slots; rural/urban balance.

Benefits
In-home respite (4-6 hours/day) Adult day care (~$60/day) Short-term facility care (up to 5 days)

Medicare Savings Program (MSP)

South Carolina Medicare Savings Program

Age 65+ or disabled
General SC resident, Medicare Part A/B.
Income Limits (2025) ~$2,510/month (QMB), ~$3,380/month (SLMB), ~$3,598/month (QI)—individual.
Asset Limits $9,430 (individual), $14,130 (couple).
SC

Three tiers; includes Extra Help for Part D; no waitlist.

Benefits
Covers Part B premiums ($174.70/month) Deductibles ($240/year) Copays (~20%)

VA Aid and Attendance (A&A) and Housebound Benefits

South Carolina VA Aid and Attendance/Housebound

Age 65+ or disabled veteran/spouse
General SC resident, wartime service, need for ADL help (A&A) or homebound.
Income Limits (2025) Net income < ~$1,984/month (veteran with dependent, A&A); pension offsets income.
Asset Limits ~$155,356 net worth limit
SC

High veteran population; supports rural/urban care needs.

Benefits
Cash (~$1,433-$2,642/month veteran, ~$951-$1,318 spouse) for care costs (e.g., in-home, assisted living)

Senior Farmers’ Market Nutrition Program (SFMNP)

South Carolina SFMNP

Age 60+
General SC resident, low-income.
Income Limits (2025) ~$2,322/month individual, 185% FPL
Asset Limits Not assessed.
SC

Vouchers (~$50/season); serves ~20,000 annually via 10 AAAs.

Benefits
Vouchers (~$50/season) for fresh produce at approved markets

Homestead Exemption Program

South Carolina Homestead Exemption

Age 65+ (or disabled/blind)
General SC resident 1+ year, homeowner.
Income Limits (2025) None; tax-based eligibility.
Asset Limits Not assessed; home-focused.
SC

Saves ~$500-$1,000/year avg.; applies to primary residence.

Benefits
Property tax exemption (~$50,000 value, ~$500-$1,000/year savings)

Elderly Simplified Application Project (ESAP)

South Carolina ESAP (SNAP for Seniors)

Age 60+
General SC resident, no earned income, not on SCCAP.
Income Limits (2025) ~$1,732/month 133% FPL, individual
Asset Limits $4,250 individual, higher than standard SNAP
SC

Simplified process; serves ~50,000 seniors annually.

Benefits
EBT card for food (~$100-$300/month based on income)

Frequently Asked Questions about Pines at Columbia

Who is the owner of Pines at Columbia?

The legal owner and operator of Pines at Columbia is Pines-Columbia Llc.

What is the license number of Pines at Columbia?

According to SC state health department records, Pines at Columbia's license number is CRC-2213.

When does Pines at Columbia's license expire?

According to SC state health department records, Pines at Columbia's license expires on June 30, 2026.

What is the best email address for Pines at Columbia?

The team at Pines at Columbia can be reached at [email protected].

Who is the administrator of Pines at Columbia?

Brian D. Shull is the administrator of Pines at Columbia.

How many beds does Pines at Columbia have?

Pines at Columbia has 90 beds.

Are there photos of Pines at Columbia?

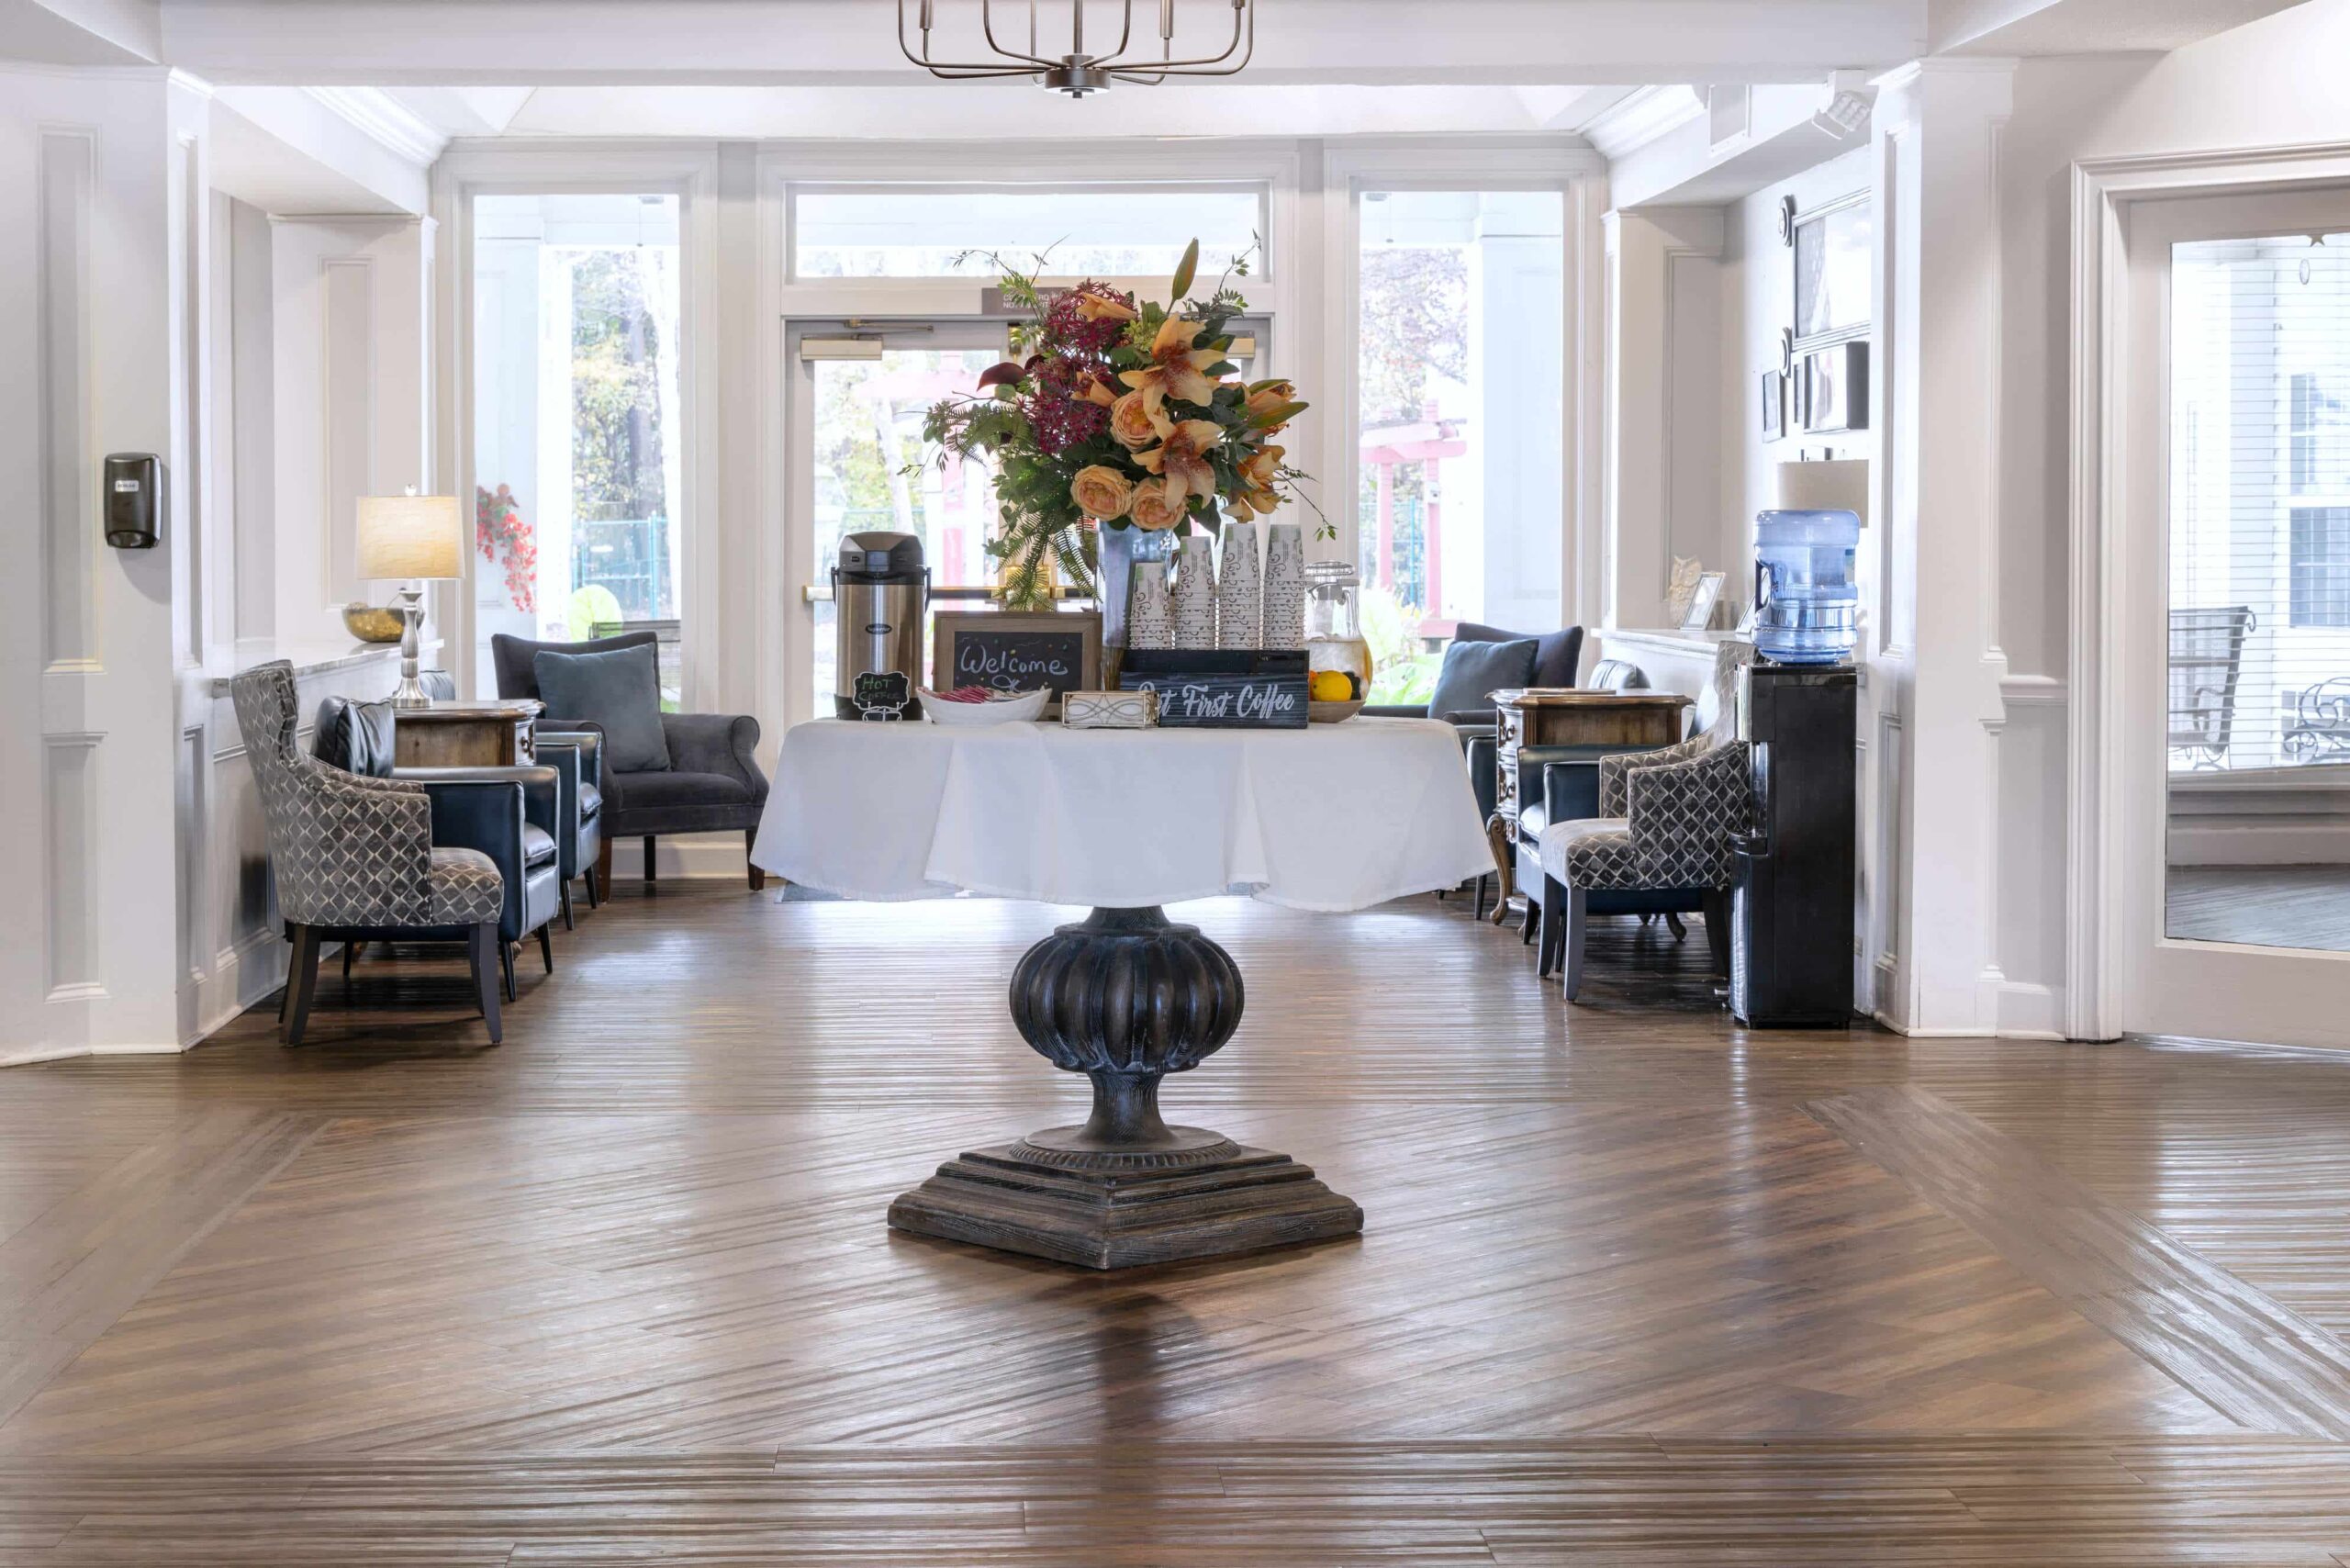
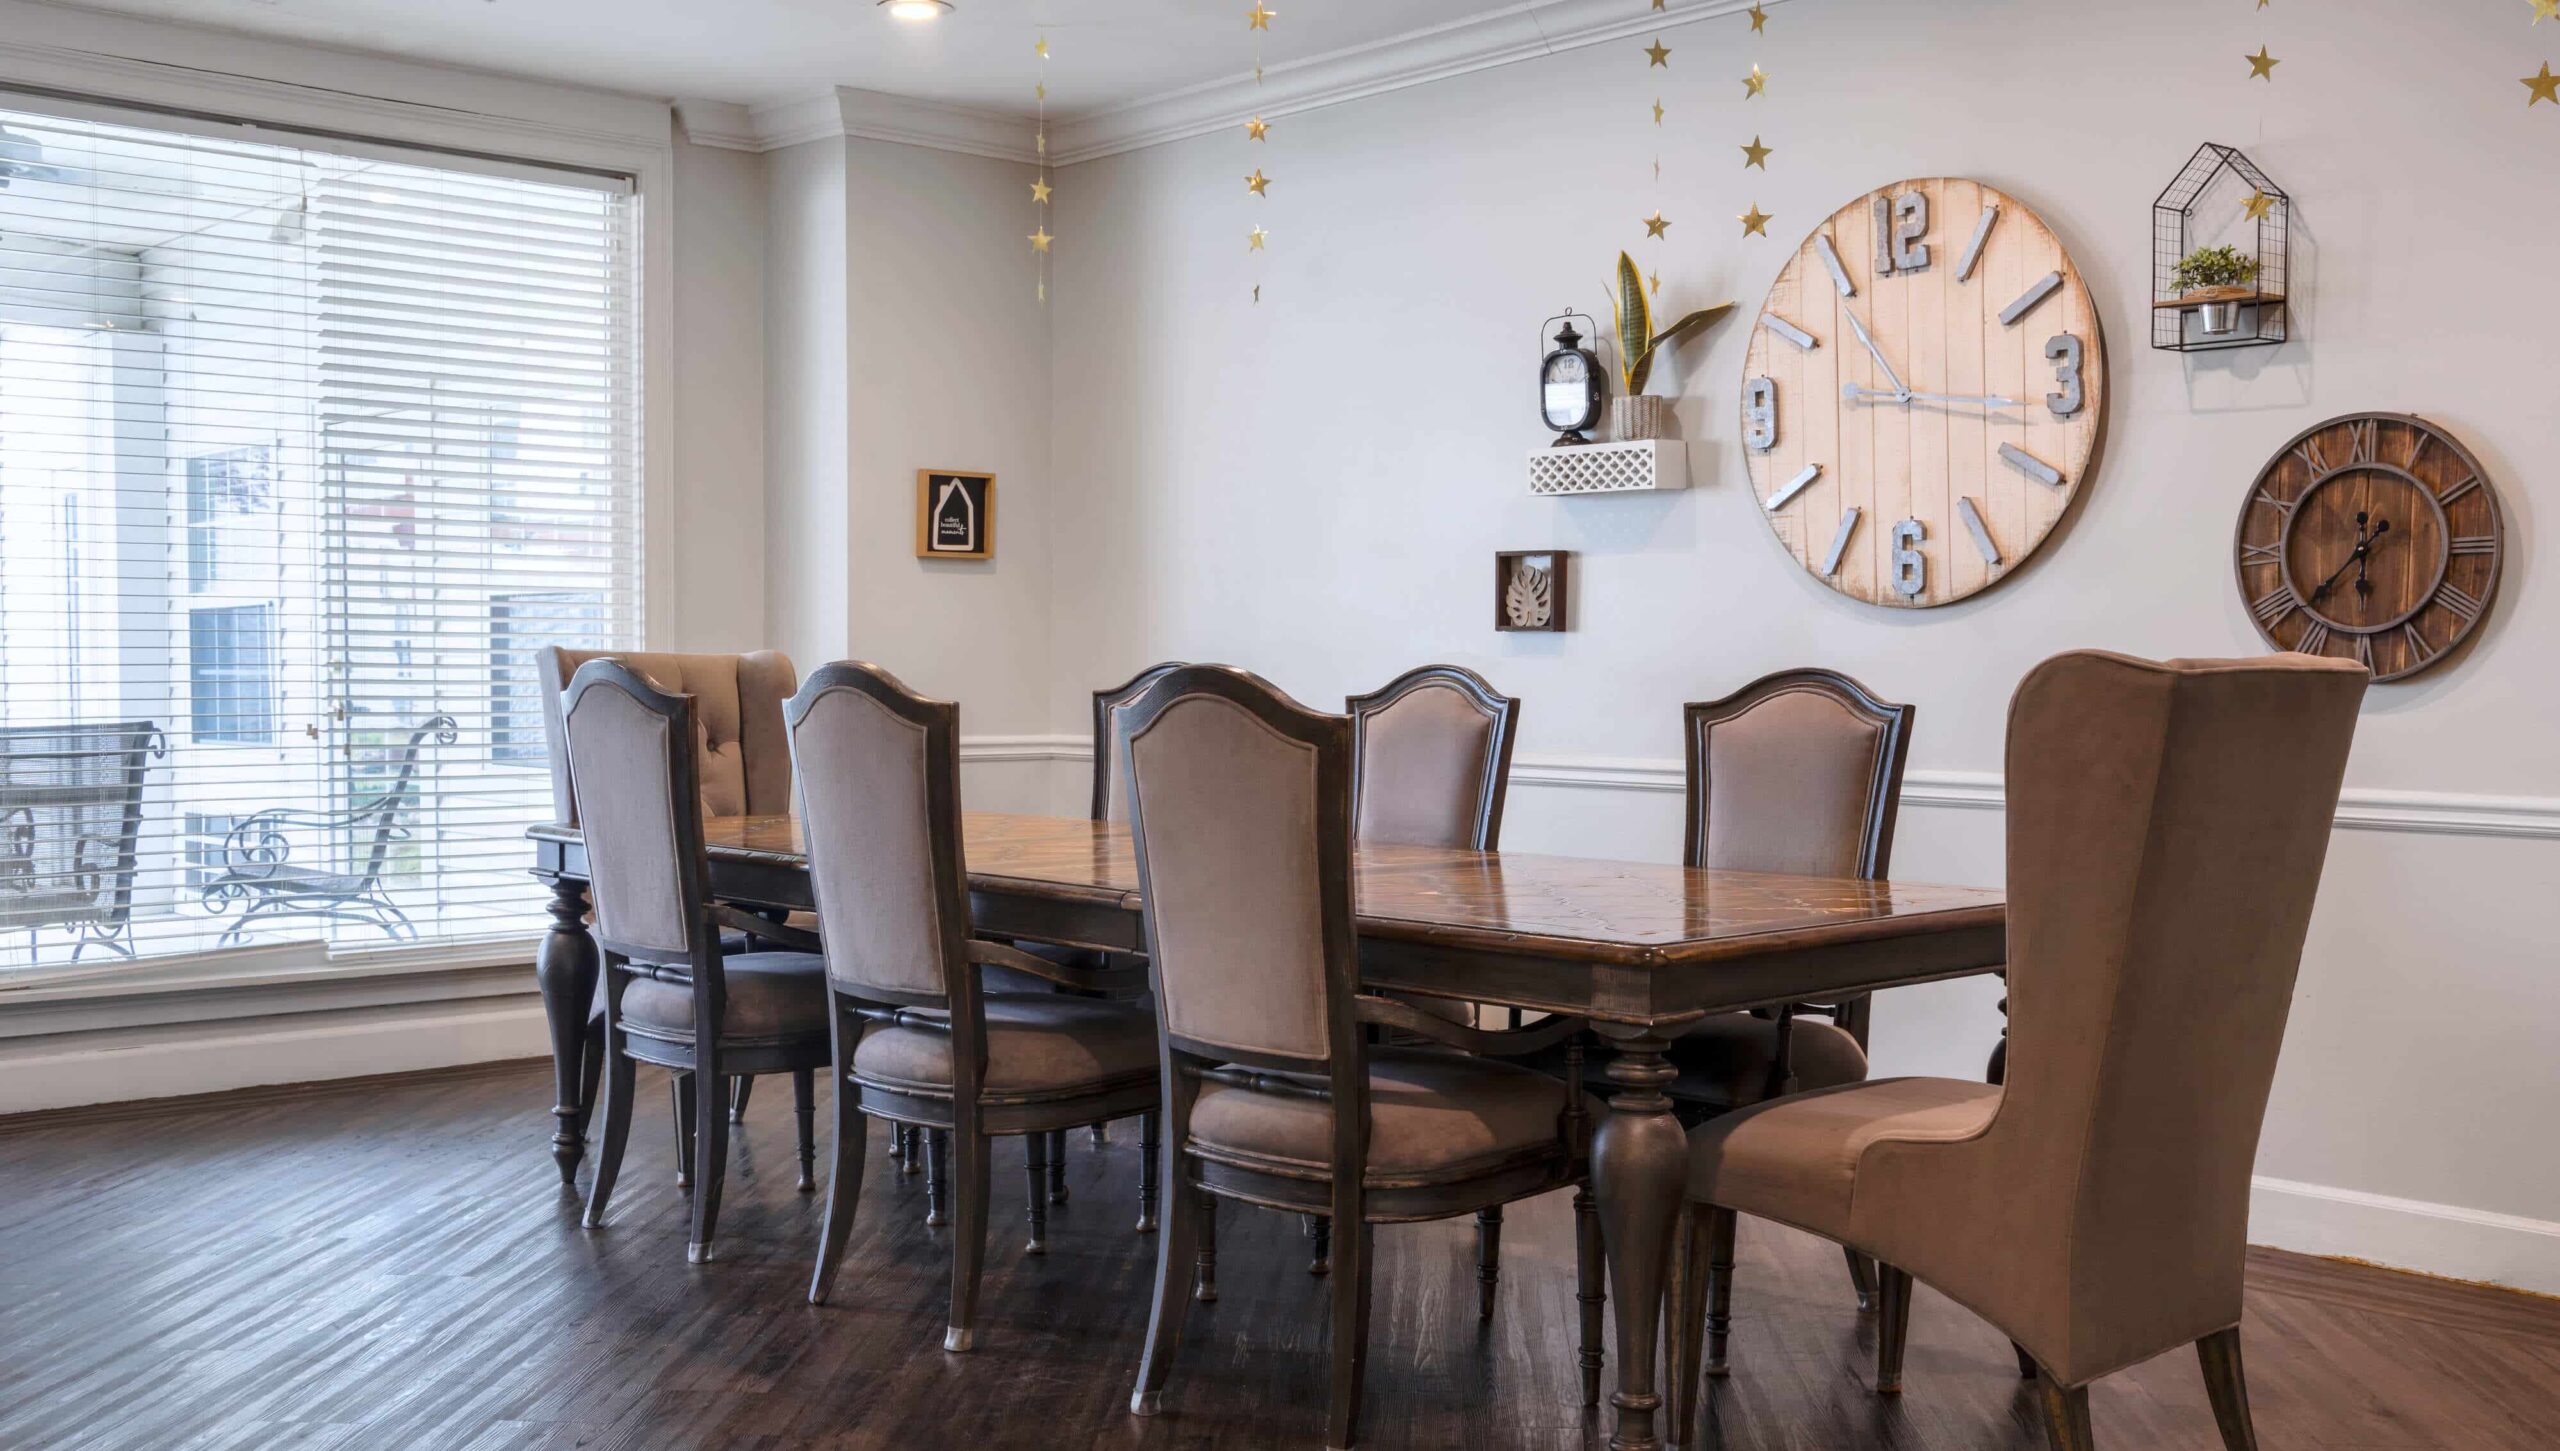
Yes — there are 7 photos of Pines at Columbia in the photo gallery on this page.

Guides for Better Senior Living

Care Cost Calculator: See Prices in Your Area

Nursing Home Data Explorer

Don’t Wait Too Long: 7 Red Flag Signs Your Parent Needs Assisted Living Now

The True Cost of Assisted Living in 2025 – And How Families Are Paying For It

Understanding Senior Living Costs: Pricing Models, Discounts & Financial Assistance

Explore Open Rooms
1 Contact details
2 What type of senior care service are you looking for?
3 What budget do you have in mind for senior care?
4 How soon do you need to find care?
5 Additional details

Thank you for your interest!

Our team will be in touch shortly to help with next steps.