Pleasant Acres Nursing & Rehabilitation Center
Nursing Home · Pennsylvania, PA
CMS overall rating Info The Overall CMS Rating is scored from 1 to 5 stars and combines results from health inspections, staffing levels, and quality measures. Health inspections carry the most weight. Staffing and quality scores can increase or decrease the final rating based on performance compared to state and national standards.

Pleasant Acres Nursing & Rehabilitation Center

Nursing Home · Pennsylvania, PA
CMS overall rating Info The Overall CMS Rating is scored from 1 to 5 stars and combines results from health inspections, staffing levels, and quality measures. Health inspections carry the most weight. Staffing and quality scores can increase or decrease the final rating based on performance compared to state and national standards.
Calculator: See prices in your area
Pleasant Acres Nursing & Rehabilitation Center accepts Medicare, Medicaid, and private pay.

Overview of Pleasant Acres Nursing & Rehabilitation Center

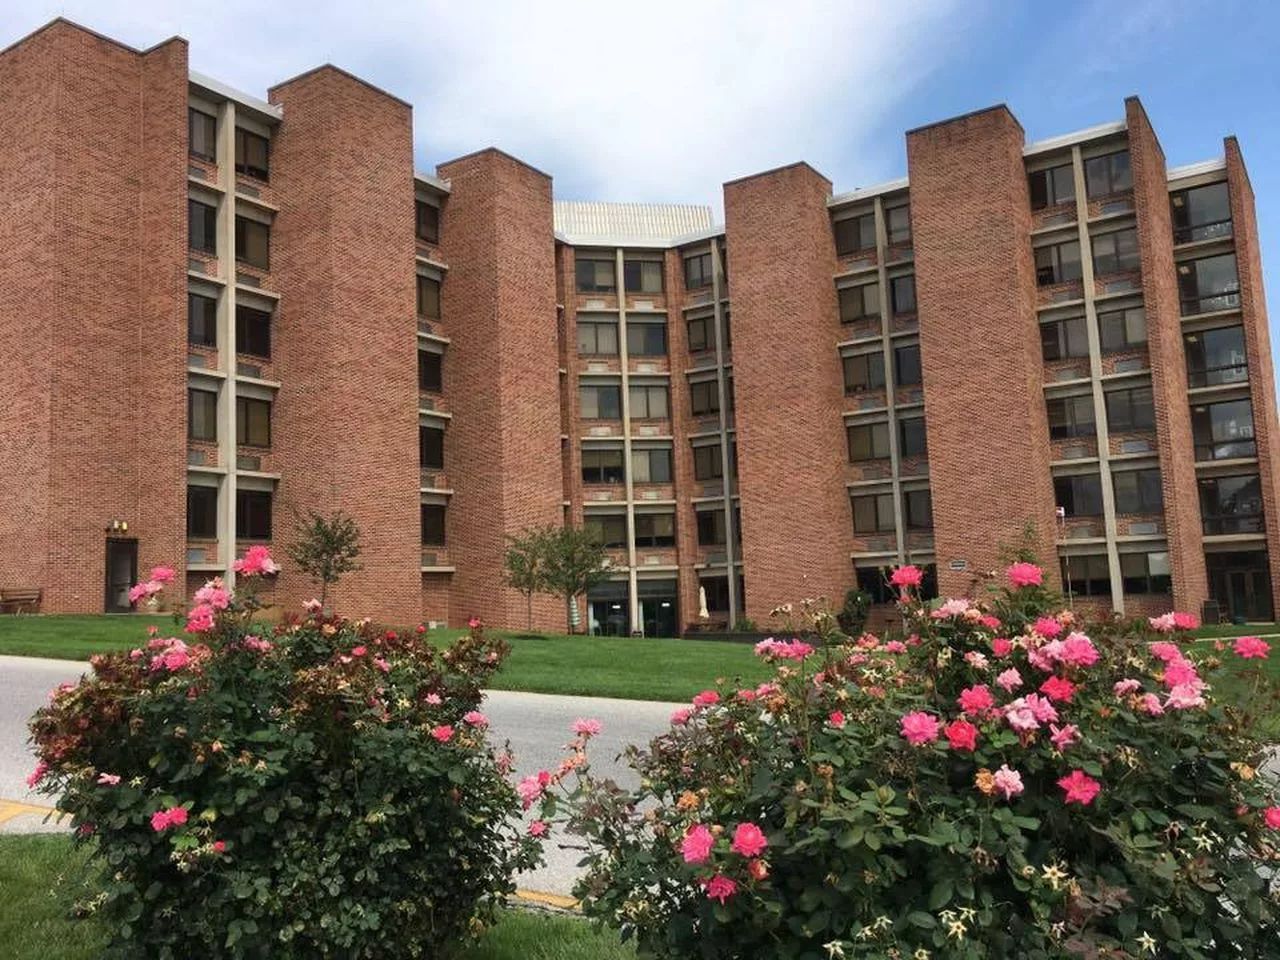
Pleasant Acres Rehabilitation and Nursing Center sets itself apart for its exceptional standard of care, setting it apart from other communities. Renowned for its cleanliness and attractive facilities, the center offers a high-caliber environment. What distinguishes Pleasant Acres is its friendly and experienced staff, contributing significantly to the overall positive atmosphere of the facility.
This community in York, Pennsylvania, offers a wide range of on-site care services, including specialized support in cardiac care, dementia and Alzheimer’s care, diabetes management, hospice care, counseling, and much more. With its reliable and comprehensive approach to healthcare, Pleasant Acres provides a trusted haven for residents, ensuring their well-being and comfort at every step of their journey.

Quality ratings

Measured by Centers for Medicare & Medicaid Services (CMS)

Overall rating Info The Overall CMS Rating combines results from health inspections, staffing levels and quality measures. Health inspections carry the most weight. Staffing and quality scores can increase or decrease the final rating based on performance compared to state and national standards.
▼ 66.6% Below PA avg. ▼ 66.6% Below PA avg.Click the badge to see the full State ranking.Click here to see the full State ranking.
Health Inspection Info Based on the results of the facility's three most recent standard inspections and any complaint investigations. CMS reviews the number, scope, and severity of deficiencies, with more recent findings weighted more heavily.
▼ 64.3% Below PA avg. ▼ 64.3% Below PA avg.Click the badge to see the full State ranking.Click here to see the full State ranking.
Staffing Info Measures average nursing staff hours per resident per day, including Registered Nurses (RNs) and total nursing staff. Ratings are adjusted based on the level of care residents require and are compared to state and national benchmarks.
▲ 17.9% Above PA avg. ▲ 17.9% Above PA avg.Click the badge to see the full State ranking.Click here to see the full State ranking.
Quality Measures Info Based on clinical and physical health indicators reported to CMS, such as hospital readmissions, falls, pressure ulcers, and improvements in mobility. These measures reflect how well residents' health needs are being managed.
▼ 41.1% Below PA avg. ▼ 41.1% Below PA avg.Click the badge to see the full State ranking.Click here to see the full State ranking.

Staffing hours breakdown

Info Daily nursing hours per resident by staff type, reported to CMS. Higher is generally better — compare this facility to state and national averages to see where staffing stands.

Hours per resident per day — compared to Pennsylvania state averages

Total nursing care / resident Info This home is ranked 70th out of 171 homes in Pennsylvania.

Total adjusted nursing hours per resident per day, combining RN, LPN, and aide time. CMS adjusts this for case-mix so facilities can be fairly compared.
4h 22m per day
Rank #70 / 171Nurse hours — State benchmarkedThis home is ranked 70th out of 171 homes in Pennsylvania.Shows adjusted nurse hours per resident per day benchmarked to the Pennsylvania average, with a ranking across 171 Pennsylvania SNFs. More hours mean more direct care. The national average is about 3.5 hrs; below 3.0 is a red flag.Click the rank badge to see the full State ranking.Click here to see the full State ranking.
This facility Pennsylvania avg (4h 9m per day)
vs Pennsylvania avg
+5%

5 of 6 metrics below state avg

Staff type Hours / Day / Resident vs state avg
Registered Nurse (RN) Info RNs hold the highest nursing license and can assess residents, interpret test results, and direct care plans. More RN hours per day often signals stronger clinical oversight and faster response to health changes. 24m per day ▼ 49% State avg: 47m per day · National avg: 41m per day
LPN / LVN Info Licensed Practical Nurses (LPNs) or Licensed Vocational Nurses (LVNs) deliver routine hands-on care — medication administration, wound dressing, and monitoring vital signs. They work under RN supervision and make up a large share of daily bedside care. 56m per day ■ Avg State avg: 55m per day · National avg: 52m per day
Nurse Aide Info Certified Nurse Aides (CNAs) provide the most direct day-to-day assistance: bathing, dressing, feeding, and mobility. Nurse aide hours are typically the largest staffing category and directly affect residents' quality of life. 2h 2m per day ▼ 8% State avg: 2h 12m per day · National avg: 2h 21m per day
Total Nursing (Weekend) Info Combined nursing hours (RN + LPN + Nurse Aide) per resident per day on weekends. Staffing often drops on weekends — this figure reveals whether the facility maintains adequate coverage outside of weekday hours. 3h 7m per day ▼ 12% State avg: 3h 31m per day · National avg: 3h 26m per day
Physical Therapist Info Hours per resident per day provided by licensed Physical Therapists (PTs) or PT Assistants. PT services help residents recover mobility after injury or illness and are especially important for post-acute (short-stay) rehabilitation. 3m per day ▼ 50% State avg: 6m per day · National avg: 4m per day
RN (Weekend) Info Registered nurse hours specifically on weekends. Facilities sometimes reduce RN presence on Saturdays and Sundays — a low weekend RN figure compared to weekday hours can indicate reduced clinical oversight when most administrative staff are absent. 14m per day ▼ 58% State avg: 33m per day · National avg: 29m per day

Capacity and availability

This home usually has limited availability

Occupancy between 85% and 95% suggests balanced demand.

Higher occupancy than the Pennsylvania average: 78.7%
Occupancy rate 92.4% Rank #21 / 174Occupancy rate — State benchmarkedThis home is ranked 21st out of 174 homes in Pennsylvania.Shows this facility's occupancy rate versus the Pennsylvania average, with its Statewide rank out of 174. Higher occupancy signals strong local demand and financial stability.Click the rank badge to see the full State ranking.Click here to see the full State ranking.
Avg. Length of Stay 222 days
Occupancy rate
92.4% Rank #21 / 174Occupancy rate — State benchmarkedThis home is ranked 21st out of 174 homes in Pennsylvania.Shows this facility's occupancy rate versus the Pennsylvania average, with its Statewide rank out of 174. Higher occupancy signals strong local demand and financial stability.Click the rank badge to see the full State ranking.Click here to see the full State ranking.
Avg. Length of Stay
222 days

Who this home usually serves

TYPE OF STAY

Mostly long-term care residents

Most residents stay for extended periods and receive ongoing daily care.

Breakdown by payment type

Medicare

13% of new residents, usually for short-term rehab.

Typical stay 1 - 2 months

Private pay

8% of new residents, often for short stays.

Typical stay 1 - 2 years

Medicaid

79% of new residents, often for long-term daily care.

Typical stay 8 - 9 months

Finances and operations

Privately-owned community
Operated by a business corporation.
Home revenue
$40.0M
Profit
$1.3M
Privately-owned community Operated by a business corporation.
Home revenue
$40.0M Rank #30 / 174Revenue — State benchmarkedThis home is ranked 30th out of 174 homes in Pennsylvania.Shows this facility's annual revenue compared to the Pennsylvania SNF average. Higher revenue generally means more resources for staffing and capital — read alongside Payroll %.Click the rank badge to see the full State ranking.Click here to see the full State ranking.
Profit
$1.3M
Payroll costs Info The portion of the home's budget spent on staff, including nurses, caregivers, and other employees who support care and operations. Rank #16 / 174Payroll — State benchmarkedThis home is ranked 16th out of 174 homes in Pennsylvania.Shows total annual staff payroll benchmarked to the Pennsylvania average. Higher payroll investment relative to peers often signals better staffing and less reliance on cheaper contract labor.Click the rank badge to see the full State ranking.Click here to see the full State ranking.
$20.7M
51.8% of revenue Rank #70 / 174Payroll % — State benchmarkedThis home is ranked 70th out of 174 homes in Pennsylvania.Shows payroll as a percentage of revenue versus the Pennsylvania average. Well-run Pennsylvania SNFs typically land around 53–61% — the top third Statewide. Below 25% may signal understaffing or heavy agency use — read with Staffing ratings.Click the rank badge to see the full State ranking.Click here to see the full State ranking.
Other operating costs Info All remaining costs needed to run the home, such as food, utilities, building maintenance, supplies and administrative expenses.
$18.0M
Total costs $38.7M
Walk Score
Walk Score: 46 / 100 Rank #101 / 175Walk Score — State benchmarkedThis home is ranked 101st out of 175 homes in Pennsylvania.Shows how walkable this facility's neighborhood is compared to the average Walk Score across Pennsylvania SNFs. Higher scores benefit residents, families, and staff.Click the rank badge to see the full State ranking.Click here to see the full State ranking.
Somewhat walkable. A few nearby services may be reachable on foot, but most trips require transportation.

About this community

Awards

AwardsFeatured as a top Skilled Nursing Facility in Pennsylvania by Assisted Living Magazine

License Details

Therapy & Rehabilitation

2 services
Rehabilitation Services
Respite Care

Staffing & Medical

1 service
24-Hour Staffing

Amenities & Lifestyle

Specific ProgramsShort-Term Rehabilitation

Contact Pleasant Acres Nursing & Rehabilitation Center

Health Inspection History

Inspections Since 2023
Total health inspections 8

Pennsylvania average 6.7


Last Health inspection on Mar 2025

Total health citations
48 Rank #147 / 171Health citations — State benchmarkedThis home is ranked 147th out of 171 homes in Pennsylvania.Shows this facility's total health deficiency citations benchmarked to the Pennsylvania State average, with a ranking across all 171 PA SNFs. Lower citation counts earn a better rank.Click the rank badge to see the full State ranking.Click here to see the full State ranking.

Pennsylvania average 31.3

Citations per inspection
6 Rank #142 / 171Citations per inspection — State benchmarkedThis home is ranked 142nd out of 171 homes in Pennsylvania.Shows average deficiency citations per CMS inspection for this facility versus the Pennsylvania mean across 171 SNFs with citation data. Lower is better.Click the rank badge to see the full State ranking.Click here to see the full State ranking.

Pennsylvania average 4.4


Health citations are formal notices following inspections when they fail to comply with safety and care standards.

38 of 48 citations resulted from standard inspections; and 10 of 48 resulted from complaint investigations.

Breakdown of citation severity (last 3 years)
Critical Health citations
2
567% worse than Pennsylvania average

Pennsylvania average: 0.3


Serious Health citations
0
100% better than Pennsylvania average

Pennsylvania average: 0.6

2 critical citations Pennsylvania average: 0.3

0 serious citations Pennsylvania average: 0.6

46 moderate citations Pennsylvania average: 29.5

0 minor citations Pennsylvania average: 0.8
Citations history (last 3 years)
Nutrition moderate citation Mar 20, 2025
Corrected

Pharmacy moderate citation Mar 20, 2025
Corrected

Pharmacy moderate citation Mar 20, 2025
Corrected

Quality of Care moderate citation Mar 20, 2025
Corrected

Financial Assistance for
Nursing Home in Pennsylvania

Pleasant Acres Nursing & Rehabilitation Center is located in York, Pennsylvania.
Here are the financial assistance programs available to residents in Pennsylvania.

Get Financial aid guidance

Community HealthChoices (CHC)

PA Medicaid CHC

Age 65+ or disabled
General Pennsylvania resident, Medicaid-eligible, nursing home-level care need.
Income Limits (2025) ~$2,829/month 300% FBR, individual
Asset Limits $2,000 (individual), $3,000 (couple) (excludes home, car).
PA

Managed care model; high urban demand (e.g., Philadelphia, Pittsburgh).

Benefits
Personal care (5-7 hours/day, e.g., bathing, dressing) Respite care (up to 240 hours/year) Adult day care ($70/day) Home modifications ($1,500 avg.)

Pennsylvania OPTIONS Program

PA OPTIONS

Age 60+
General Pennsylvania resident, at risk of nursing home placement.
Income Limits ~$2,000/month individual, varies by region
Asset Limits $8,000 individual
PA

Cost-sharing required above certain income; rural/urban balance.

Benefits
In-home care (3-5 hours/week) Respite (up to 10 days/year) Adult day care (~$70/day) Transportation (~5 trips/month)

Living Independence for the Elderly (LIFE)

Pennsylvania LIFE (PACE)

Age 55+
General PA resident (specific counties), NFLOC, safe with LIFE support.
Income Limits (2025) ~$2,829/month (Medicaid-eligible); private pay option available.
Asset Limits $2,000 (individual), $3,000 (couple) for Medicaid enrollees.
PA

16 providers in 25 counties (e.g., Allegheny, Luzerne); LIFE branding unique to PA.

Benefits
Personal care (5-7 hours/day) Medical care Meals Transportation Respite Therapies

Medicare Savings Program (MSP)

Pennsylvania Medicare Savings Program

Age 65+ or disabled
General PA resident, Medicare Part A/B.
Income Limits (2025) ~$2,510/month (QMB), ~$3,380/month (SLMB), ~$3,598/month (QI)—individual.
Asset Limits $9,430 (individual), $14,130 (couple).
PA

Three tiers; includes Extra Help for Part D; no waitlist.

Benefits
Covers Part B premiums ($174.70/month) Deductibles ($240/year) Copays (~20%)

Family Caregiver Support Program (FCSP)

Pennsylvania Family Caregiver Support Program

Age
General Caregivers of 60+ needing care or 55+ caregivers of others; PA resident; functional needs (2+ ADLs).
Income Limits (2025) No strict cap; reimbursements up to $600/month if care recipient income < ~$2,322/month 185% FPL
Asset Limits Not assessed; need-based.
PA

High demand; includes grandparent caregivers.

Benefits
Respite (4-6 hours/week or 5 days/year) Adult day care ($60/day) Supplies (~$2,000/year) Caregiver training

VA Aid and Attendance (A&A) and Housebound Benefits

Pennsylvania VA Aid and Attendance/Housebound

Age 65+ or disabled veteran/spouse
General PA resident, wartime service, need for ADL help (A&A) or homebound.
Income Limits (2025) Net income < ~$1,984/month (veteran with dependent, A&A); pension offsets income.
Asset Limits ~$155,356 net worth limit
PA

High veteran population; supports rural/urban care needs.

Benefits
Cash (~$1,433-$2,642/month veteran, ~$951-$1,318 spouse) for care costs (e.g., in-home, assisted living)

Property Tax/Rent Rebate Program (PTRR)

Pennsylvania Property Tax/Rent Rebate Program

Age 65+
General PA resident, homeowner/renter (or widow/er 50+, disabled 18+).
Income Limits (2025) ~$45,000/year individual or couple, excludes half of Social Security
Asset Limits Not assessed; income-focused.
PA

Rebates up to $1,000; ~600,000 eligible annually.

Benefits
Rebates ($250-$1,000 based on income; e.g., $1,000 if income < $8,000)

Senior Farmers’ Market Nutrition Program (SFMNP)

Pennsylvania SFMNP

Age 60+
General PA resident, low-income.
Income Limits (2025) ~$2,322/month individual, 185% FPL
Asset Limits Not assessed.
PA

Vouchers (~$50/season) via 52 AAAs; serves ~200,000 annually.

Benefits
Vouchers (~$50/season) for fresh produce at approved markets

Places of interest near Pleasant Acres Nursing & Rehabilitation Center

Address 4.5 miles from city center Info Estimated distance in miles from York's city center to Pleasant Acres Nursing & Rehabilitation Center's address, calculated via Google Maps. — 4.03 miles to nearest hospital (WellSpan York Hospital Childbirth & Family Education)

Calculate Travel Distance to Pleasant Acres Nursing & Rehabilitation Center

Add your location

Address

Staffing Data

Reporting period: April 1 – June 30, 2025 (Q2 2025). Source: CMS Payroll-Based Journal report.

Total staff 492
Employees 159
Contractors 333
Staff to resident ratio 1.37:1
29% worse than Pennsylvania average
Pennsylvania average ratio: 1.94:1 Pennsylvania average ratio: 1.94:1See full Pennsylvania ranking
Avg staff/day 155
Average shift 9.1 hours
17% better than Pennsylvania average
Pennsylvania average: 7.8 hours Pennsylvania average shift: 7.8 hoursSee full Pennsylvania ranking
Total staff hours (quarter) 128,412

Nursing staff breakdown

Q2 2025 · Apr 1 – Jun 30 More info This data comes from the CMS Payroll-Based Journal report covering April 1 – June 30, 2025.
Registered Nurse

Manages medical care and health needs.

Total count 31
Average shift length Info Average shift length. Calculated as total hours divided by days worked and average staff per day. 9.3 hours

This role is partially covered by contractors.

Licensed Practical Nurse

Assists with medical care and medications.

Total count 106
Average shift length Info Average shift length. Calculated as total hours divided by days worked and average staff per day. 9.6 hours

This role is partially covered by contractors.

Certified Nursing Assistant

Helps with daily care and mobility.

Total count 279
Average shift length Info Average shift length. Calculated as total hours divided by days worked and average staff per day. 9.5 hours

This role is partially covered by contractors.

Contractor staffing

Q2 2025 · Apr 1 – Jun 30 More info This data comes from the CMS Payroll-Based Journal report covering April 1 – June 30, 2025.

Total hours from contractors

51.5%

66,096 contractor hours this quarter

Certified Nursing Assistant: 196 Licensed Practical Nurse: 89 Registered Nurse: 28 Occupational Therapy Aide: 7 Feeding Assistant: 6 Diagnostic X-ray Services Staff: 4 Dental Services Staff: 1 Medical Director: 1 Occupational Therapy Assistant: 1

Staff by category

Q2 2025 · Apr 1 – Jun 30 More info This data comes from the CMS Payroll-Based Journal report covering April 1 – June 30, 2025.
Certified Nursing Assistant 83 196 279 67,869 91 100% 9.5
Licensed Practical Nurse 17 89 106 28,439 91 100% 9.6
Registered Nurse 3 28 31 7,457 91 100% 9.3
Clinical Nurse Specialist 11 0 11 5,001 73 80% 8
Other Dietary Services Staff 11 0 11 4,190 91 100% 7.2
Physical Therapy Assistant 7 0 7 2,453 76 84% 8.1
Therapeutic Recreation Specialist 6 0 6 2,314 73 80% 8
Mental Health Service Worker 5 0 5 1,963 79 87% 7.1
RN Director of Nursing 4 0 4 1,895 64 70% 8
Respiratory Therapy Technician 4 0 4 1,694 71 78% 8
Occupational Therapy Aide 0 7 7 1,269 66 73% 7.3
Feeding Assistant 0 6 6 927 64 70% 8.5
Qualified Social Worker 2 0 2 764 69 76% 6.8
Administrator 2 0 2 488 59 65% 7.5
Physical Therapy Aide 1 0 1 482 62 68% 7.8
Nurse Practitioner 1 0 1 472 59 65% 8
Dental Services Staff 1 1 2 454 54 59% 8.2
Occupational Therapy Assistant 0 1 1 172 29 32% 5.9
Diagnostic X-ray Services Staff 0 4 4 51 17 19% 2.8
Medical Director 0 1 1 45 16 18% 2.8
Qualified Activities Professional 1 0 1 15 8 9% 1.9
279 Certified Nursing Assistant
% of Days 100%
106 Licensed Practical Nurse
% of Days 100%
31 Registered Nurse
% of Days 100%
11 Clinical Nurse Specialist
% of Days 80%
11 Other Dietary Services Staff
% of Days 100%
7 Physical Therapy Assistant
% of Days 84%
6 Therapeutic Recreation Specialist
% of Days 80%
5 Mental Health Service Worker
% of Days 87%
4 RN Director of Nursing
% of Days 70%
4 Respiratory Therapy Technician
% of Days 78%
7 Occupational Therapy Aide
% of Days 73%
6 Feeding Assistant
% of Days 70%
2 Qualified Social Worker
% of Days 76%
2 Administrator
% of Days 65%
1 Physical Therapy Aide
% of Days 68%
1 Nurse Practitioner
% of Days 65%
2 Dental Services Staff
% of Days 59%
1 Occupational Therapy Assistant
% of Days 32%
4 Diagnostic X-ray Services Staff
% of Days 19%
1 Medical Director
% of Days 18%
1 Qualified Activities Professional
% of Days 9%

Facility Characteristics

Source: CMS Long-Term Care Facility Characteristics (Data as of Jan 2026)

Total residents 358
Medicare
8
2.2% of residents
Medicaid
291
81.3% of residents
Private pay or other
59
16.5% of residents
Programs & Services
Residents Group

Residents meet regularly to discuss policies, care quality, and activities

Active Resident Council

Organized group of residents that meets regularly to discuss facility policies, quality of life, and activities.

Quality of care over time

These measures show how residents usually do over time at this home, based on health outcomes and preventive care.

High-risk clinical events score Info A composite score based on pressure ulcers, falls with injury, weight loss, walking ability decline, and activities of daily living decline. 12.1
10% worse than Pennsylvania average

Pennsylvania average: 11.0

Functional decline score Info A composite score based on activities of daily living decline, walking ability decline, and incontinence. 24.3
9% worse than Pennsylvania average

Pennsylvania average: 22.2

Long-stay resident measures
Above average Pennsylvania avg: 3.7 Info CMS star rating based on long-stay quality measure performance. 5 stars = significantly above average, 1 star = significantly below average.
Need for Help with Daily Activities Increased Info Percent of long-stay residents whose need for help with daily activities has increased 25.1%
32% worse than Pennsylvania average

Pennsylvania average: 19.0%

Walking Ability Worsened Info Percent of long-stay residents whose ability to move independently worsened 21.5%
In line with Pennsylvania average

Pennsylvania average: 21.1%

Low Risk Residents with Bowel/Bladder Incontinence Info Percent of low risk long-stay residents who lose control of their bowels or bladder 26.4%
In line with Pennsylvania average

Pennsylvania average: 26.7%

Falls with Major Injury Info Percent of long-stay residents experiencing one or more falls with major injury 2.7%
17% better than Pennsylvania average

Pennsylvania average: 3.2%

High Risk Residents with Pressure Ulcers Info Percent of long-stay high risk residents with pressure ulcers 3.5%
37% better than Pennsylvania average

Pennsylvania average: 5.5%

Urinary Tract Infection Info Percent of long-stay residents with a urinary tract infection 1.0%
46% better than Pennsylvania average

Pennsylvania average: 1.8%

Lost Too Much Weight Info Percent of long-stay residents who lose too much weight 7.6%
15% worse than Pennsylvania average

Pennsylvania average: 6.6%

Depressive Symptoms Info Percent of long-stay residents who have depressive symptoms 2.3%
59% better than Pennsylvania average

Pennsylvania average: 5.5%

Antipsychotic Use Info Percent of long-stay residents who received an antipsychotic medication 28.1%
64% worse than Pennsylvania average

Pennsylvania average: 17.1%

Pneumococcal Vaccine Info Percent of long-stay residents assessed and appropriately given the pneumococcal vaccine 95.9%
10% better than Pennsylvania average

Pennsylvania average: 86.9%

Influenza Vaccine Info Percent of long-stay residents assessed and appropriately given the seasonal influenza vaccine 100.0%
7% better than Pennsylvania average

Pennsylvania average: 93.5%

Hospitalizations per 1,000 days Info Number of hospitalizations per 1,000 long-stay resident days. 1.42
15% better than Pennsylvania average

Pennsylvania average: 1.68

ED visits per 1,000 days Info Number of outpatient emergency department visits per 1,000 long-stay resident days. 0.69
43% better than Pennsylvania average

Pennsylvania average: 1.20

Short-stay resident measures
Significantly below average Pennsylvania avg: 3.2 Info CMS star rating based on short-stay quality measure performance. 5 stars = much above average, 1 star = much below average.
Pneumococcal Vaccine Info Percent of short-stay residents assessed and appropriately given the pneumococcal vaccine 76.0%
10% better than Pennsylvania average

Pennsylvania average: 68.8%

Antipsychotic medication increase Info Percent of short-stay residents who newly received an antipsychotic medication 1.1%
29% better than Pennsylvania average

Pennsylvania average: 1.5%

Influenza Vaccine Info Percent of short-stay residents assessed and appropriately given the seasonal influenza vaccine 77.5%
13% better than Pennsylvania average

Pennsylvania average: 68.7%

Re-hospitalized after SNF stay Info Percentage of short-stay residents who were re-hospitalized after their nursing home admission. 25.3%
10% worse than Pennsylvania average

Pennsylvania average: 23.1%

Emergency department visits Info Percentage of short-stay residents who had an outpatient emergency department visit. 10.7%
9% worse than Pennsylvania average

Pennsylvania average: 9.8%

Falls with major injury Info Percentage of SNF residents who experience falls with major injury during their stay. 0.0%
100% better than Pennsylvania average

Pennsylvania average: 0.8%

Ability to care for self at discharge Info Percentage of residents at or above expected ability to care for themselves at discharge. 35.9%
33% worse than Pennsylvania average

Pennsylvania average: 53.7%

Successful return to home or community Info Rate of successful return to home or community from a skilled nursing facility. 26.0%
49% worse than Pennsylvania average

Pennsylvania average: 50.6%

Penalties and fines

Federal penalties imposed by CMS for regulatory violations, including civil money penalties (fines) and denials of payment for new Medicare/Medicaid admissions.

Source: CMS Penalties Database (Data as of Jan 2026)

Total fines amount $199K Rank #172 / 174Federal fines — State benchmarkedThis home is ranked 172nd out of 174 homes in Pennsylvania.Shows this facility's cumulative CMS federal fine dollars versus the Pennsylvania average among facilities with fines, and where it ranks among 174 skilled nursing facilities in the pool. Lower total dollars mean a better rank.Click the rank badge to see the full State ranking.Click here to see the full State ranking.
235% higher than Pennsylvania average

Pennsylvania average: $59K

Number of fines 2
In line with Pennsylvania average

Pennsylvania average: 2.1

Payment Denials Info Serious action where Medicare and/or Medicaid temporarily stops payments for new residents until issues are fixed. 0
100% fewer payment denials than Pennsylvania average

Pennsylvania average: 0.2

Fines amount comparison
This facility $199K
Pennsylvania average $59K
Penalty History

Penalties are imposed by CMS for violations of federal nursing home regulations.

2 penalties in the past 3 years

Multiple penalties were reported in the last 3 years.

Civil Money Penalty Info Fines imposed for noncompliance, which can be assessed per day or per instance of violation. Oct 3, 2023
$11K
Civil Money Penalty Info Fines imposed for noncompliance, which can be assessed per day or per instance of violation. Jul 25, 2023
$187K

Last updated: Jan 2026

Guides for Better Senior Living

Care Cost Calculator: See Prices in Your Area

Nursing Home Data Explorer

Don’t Wait Too Long: 7 Red Flag Signs Your Parent Needs Assisted Living Now

The True Cost of Assisted Living in 2025 – And How Families Are Paying For It

Understanding Senior Living Costs: Pricing Models, Discounts & Financial Assistance

Frequently Asked Questions about Pleasant Acres Nursing & Rehabilitation Center

What neighborhood is Pleasant Acres Nursing & Rehabilitation Center in?

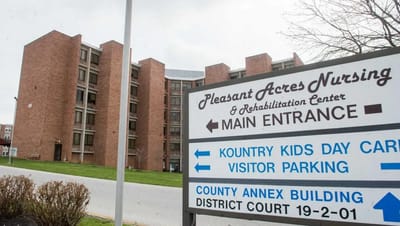
Pleasant Acres Nursing & Rehabilitation Center is in the Pleasant Acres Road neighborhood.

Is Pleasant Acres Nursing & Rehabilitation Center in a walkable area?

Pleasant Acres Nursing & Rehabilitation Center has a walk score of 46. Somewhat walkable. A few nearby services may be reachable on foot, but most trips require transportation.

Are there photos of Pleasant Acres Nursing & Rehabilitation Center?

Yes — there is 1 photo of Pleasant Acres Nursing & Rehabilitation Center in the photo gallery on this page.

What is the phone number of Pleasant Acres Nursing & Rehabilitation Center?

(717) 840-7100 will put you in contact with the team at Pleasant Acres Nursing & Rehabilitation Center.

Is Pleasant Acres Nursing & Rehabilitation Center Medicare or Medicaid certified?

Yes — Pleasant Acres Nursing & Rehabilitation Center is a CMS-certified provider of Medicare and Medicaid.

Explore Open Rooms
1 Contact details
2 What type of senior care service are you looking for?
3 What budget do you have in mind for senior care?
4 How soon do you need to find care?
5 Additional details

Thank you for your interest!

Our team will be in touch shortly to help with next steps.