Pleasant View
Nursing Home & Memory Care · Owosso, MI
CMS overall rating Info CMS (the Centers for Medicare & Medicaid Services) is the federal agency that rates nursing home quality. Its Overall Rating runs from 1 to 5 stars, combining health inspections, staffing, and quality measures, with inspections weighted most heavily.

Pleasant View

Nursing Home & Memory Care · Owosso, MI
CMS overall rating Info CMS (the Centers for Medicare & Medicaid Services) is the federal agency that rates nursing home quality. Its Overall Rating runs from 1 to 5 stars, combining health inspections, staffing, and quality measures, with inspections weighted most heavily.
Calculator: See prices in your area
Pleasant View accepts Medicare, Medicaid, and private pay.

Overview of Pleasant View

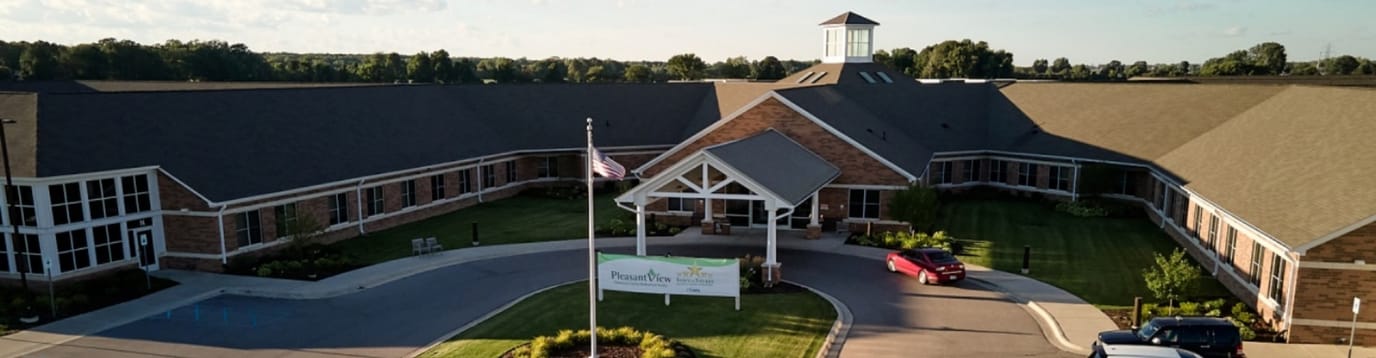
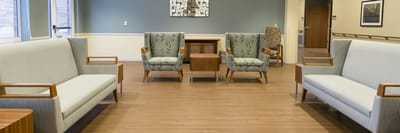
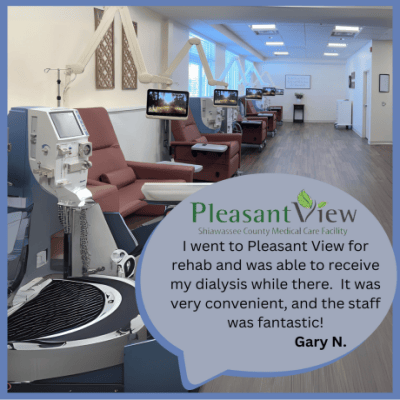
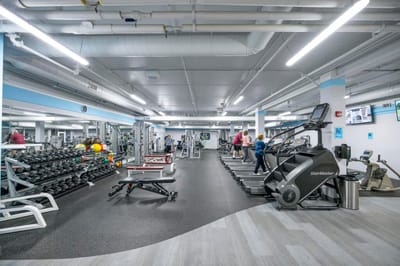
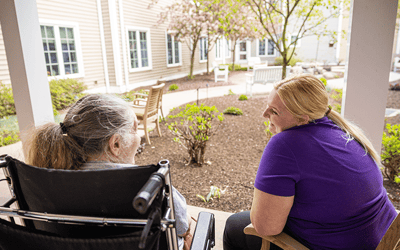
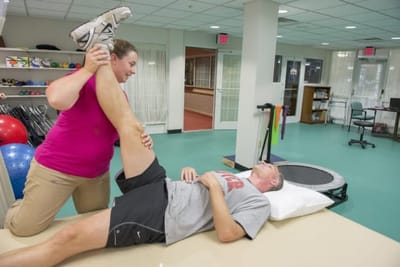
Pleasant View is a nursing home in Owosso, MI, offering long-term care, memory care, and rehabilitation. The community also ensures older adults are treated well in a compassioante, home-like environment. Residents also receive the utmost attention and care with 24/7 care, nutritious meals in Lola’s Diner, and social services. Prioritizing residents’ holistic wellness, personalized care plans tailored to their unique needs and habits are also provided.

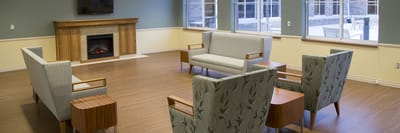
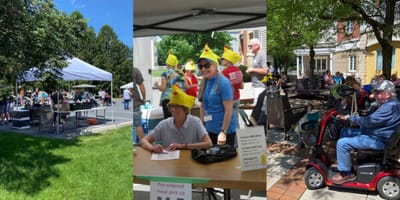
Weekly craft projects, cooking clubs, and exercise programs encourage residents to explore new hobbies and gain meaningful experiences. A library, spacious outdoors, and cozy gathering areas also ensure residents’ relaxation and safety. Residents also experience a convenient and laid-back lifestyle with the Great Lakes Bay Health Centers Shiawassee and shops nearby. This nursing home is committed to improving older adults’ welfare, making it a great choice for senior living in Michigan.

Quality ratings

Measured by Centers for Medicare & Medicaid Services (CMS)

Overall rating Info The Overall CMS Rating combines results from health inspections, staffing levels and quality measures. Health inspections carry the most weight. Staffing and quality scores can increase or decrease the final rating based on performance compared to state and national standards.
▲ 59.4% Above MI avg. ▲ 59.4% Above MI avg.MI average: 3.1Click the badge to see the full State ranking.Click here to see the full State ranking.
Health Inspection Info Based on the results of the facility's three most recent standard inspections and any complaint investigations. CMS reviews the number, scope, and severity of deficiencies, with more recent findings weighted more heavily.
▲ 76.9% Above MI avg. ▲ 76.9% Above MI avg.MI average: 2.8Click the badge to see the full State ranking.Click here to see the full State ranking.
Staffing Info Measures average nursing staff hours per resident per day, including Registered Nurses (RNs) and total nursing staff. Ratings are adjusted based on the level of care residents require and are compared to state and national benchmarks.
▲ 14.4% Above MI avg. ▲ 14.4% Above MI avg.MI average: 3.5Click the badge to see the full State ranking.Click here to see the full State ranking.
Quality Measures Info Based on clinical and physical health indicators reported to CMS, such as hospital readmissions, falls, pressure ulcers, and improvements in mobility. These measures reflect how well residents' health needs are being managed.
▲ 33.0% Above MI avg. ▲ 33.0% Above MI avg.MI average: 3.8Click the badge to see the full State ranking.Click here to see the full State ranking.

Staffing hours breakdown

Info Daily nursing hours per resident by staff type, reported to CMS. Higher is generally better — compare this facility to state and national averages to see where staffing stands.

Hours per resident per day — compared to Michigan state averages

Total nursing care / resident Info This home is ranked 54th out of 142 homes in Michigan for nurse hours. Total adjusted nursing hours per resident per day, combining RN, LPN, and aide time. CMS adjusts this for case-mix so facilities can be fairly compared.
4h 12m per day
Rank #54 / 142Nurse hours — State benchmarkedThis home is ranked 54th out of 142 homes in Michigan. Shows adjusted nurse hours per resident per day benchmarked to the Michigan average, with a ranking across 142 Michigan facilities. More hours mean more direct care. The national average is about 3.5 hrs; below 3.0 is a red flag.Rankings are based only on facilities in Michigan that report data for that category. Facilities without available data are excluded from the ranking.Click the rank badge to see the full State ranking.Click here to see the full State ranking.
This facility Michigan avg (4h 18m per day)
vs Michigan avg
-2%

2 of 6 metrics below state avg

Standout metric Weekend RN is +75% above state avg
Staff typeHours / Day / Residentvs state avg
Registered Nurse (RN) Info RNs hold the highest nursing license and can assess residents, interpret test results, and direct care plans. More RN hours per day often signals stronger clinical oversight and faster response to health changes. 1h 8m per day ▲ 48% State avg: 46m per day · National avg: 41m per day
LPN / LVN Info Licensed Practical Nurses (LPNs) or Licensed Vocational Nurses (LVNs) deliver routine hands-on care — medication administration, wound dressing, and monitoring vital signs. They work under RN supervision and make up a large share of daily bedside care. 24m per day ▼ 56% State avg: 53m per day · National avg: 52m per day
Nurse Aide Info Certified Nurse Aides (CNAs) provide the most direct day-to-day assistance: bathing, dressing, feeding, and mobility. Nurse aide hours are typically the largest staffing category and directly affect residents' quality of life. 2h 24m per day ▲ 3% State avg: 2h 20m per day · National avg: 2h 20m per day
Weekend Total Nursing Info Combined nursing hours (RN + LPN + Nurse Aide) per resident per day on weekends. Staffing often drops on weekends — this figure reveals whether the facility maintains adequate coverage outside of weekday hours. 3h 26m per day ■ Avg State avg: 3h 31m per day · National avg: 3h 27m per day
Physical Therapist Info Hours per resident per day provided by licensed Physical Therapists (PTs) or PT Assistants. PT services help residents recover mobility after injury or illness and are especially important for post-acute (short-stay) rehabilitation. 2m per day ▼ 57% State avg: 4m per day · National avg: 4m per day
Weekend RN Info Registered nurse hours specifically on weekends. Facilities sometimes reduce RN presence on Saturdays and Sundays — a low weekend RN figure compared to weekday hours can indicate reduced clinical oversight when most administrative staff are absent. 51m per day ▲ 75% State avg: 29m per day · National avg: 29m per day

Capacity and availability

This home usually has limited availability

Higher occupancy than the Michigan average: 75.8%
Occupancy rate
94% Rank #17 / 395Occupancy rate — State benchmarkedThis home is ranked 17th out of 395 homes in Michigan. Shows this facility's occupancy rate versus the Michigan average, with its Statewide rank out of 395. Higher occupancy signals strong local demand and financial stability.Rankings are based only on facilities in Michigan that report data for that category. Facilities without available data are excluded from the ranking.Click the rank badge to see the full State ranking.Click here to see the full State ranking.
Avg. Length of Stay
134 days
Bed community size
136-bed community Rank #49 / 435Bed count — State benchmarkedThis home is ranked 49th out of 435 homes in Michigan. Shows this facility's certified or reported bed count compared to other Michigan facilities. Larger communities may offer more amenities, programs, and on-site services for residents and families.Rankings are based only on facilities in Michigan that report data for that category. Facilities without available data are excluded from the ranking.Click the rank badge to see the full State ranking.Click here to see the full State ranking.
A larger shared setting that may offer more common spaces and organized community services.
Walk Score
Walk Score: 34 / 100 Rank #379 / 703Walk Score — State benchmarkedThis home is ranked 379th out of 703 homes in Michigan. Shows how walkable this facility's neighborhood is compared to the average Walk Score across Michigan facilities. Higher scores benefit residents, families, and staff.Rankings are based only on facilities in Michigan that report data for that category. Facilities without available data are excluded from the ranking.Click the rank badge to see the full State ranking.Click here to see the full State ranking.
Somewhat walkable. A few nearby services may be reachable on foot, but most trips require transportation.

About this community

License Details

Certifications5 stars for overall quality

Therapy & Rehabilitation

2 services
Rehabilitation Services
Short-Term Rehab

Staffing & Medical

2 services
Doctor on Staff
24-Hour Staffing

Amenities & Lifestyle

Barber
Beauty Shop
Housekeeping
Laundry
Activity Calendar
24-Hour Care
Activitiesbaking cookies, attending local events
Wellness Programfitness center, heated pool, group classes
Specific ProgramsShort-Term Rehabilitation, Physician Services
Volunteer Program

Contact Pleasant View

Staffing Data

Reporting period: October 1 – December 31, 2025 (Q4 2025). Source: CMS Payroll-Based Journal report.

Total staff 201
Employees 172
Contractors 29
Staff to resident ratio 1.51 : 1
11% fewer staff per resident than Michigan average
Michigan average ratio: 1.70 : 1 Michigan average ratio: 1.70 : 1See full Michigan ranking
Avg staff/day 70
Average shift 9 hours
14% better than Michigan average
Michigan average: 7.9 hours Michigan average shift: 7.9 hoursSee full Michigan ranking
Total staff hours (quarter) 57,986

Nursing staff breakdown

Q4 2025 · Oct 1 – Dec 31 More info This data comes from the CMS Payroll-Based Journal report covering October 1 – December 31, 2025.
Registered Nurse

Manages medical care and health needs.

RN Staff Info 25 total: 16 full-time employees and 9 contractors. 25
Average shift length Info Average shift length. Calculated as total hours divided by days worked and average staff per day. 9.8 hours
Licensed Practical Nurse

Assists with medical care and medications.

LPN Staff Info All 10 LPN Staff are full-time employees. No contractors work on this role. 10
Average shift length Info Average shift length. Calculated as total hours divided by days worked and average staff per day. 10.5 hours
Certified Nursing Assistant

Helps with daily care and mobility.

CNA Staff Info All 90 CNA Staff are full-time employees. No contractors work on this role. 90
Average shift length Info Average shift length. Calculated as total hours divided by days worked and average staff per day. 9.4 hours

Contractor staffing

Q4 2025 · Oct 1 – Dec 31 More info This data comes from the CMS Payroll-Based Journal report covering October 1 – December 31, 2025.

Total hours from contractors

9.4%

5,468 contractor hours this quarter

Registered Nurse: 9 Respiratory Therapy Technician: 6 Physical Therapy Aide: 3 Speech Language Pathologist: 3 Physical Therapy Assistant: 3 Qualified Social Worker: 2 Medical Director: 1 Occupational Therapy Aide: 1 Occupational Therapy Assistant: 1

Staff by category

Q4 2025 · Oct 1 – Dec 31 More info This data comes from the CMS Payroll-Based Journal report covering October 1 – December 31, 2025.
Certified Nursing Assistant9009027,85292100%9.4
Registered Nurse169259,35392100%9.8
Other Dietary Services Staff180184,39192100%7.6
Clinical Nurse Specialist9094,1388997%8.6
Licensed Practical Nurse100103,95992100%10.5
Nurse Aide in Training210211,5897076%8.5
Dental Services Staff3031,2646470%8.2
Physical Therapy Aide0338936874%6.9
RN Director of Nursing2028826571%8.6
Speech Language Pathologist0338167379%7.6
Physical Therapy Assistant0336897683%7.3
Dietitian1014806065%8
Qualified Social Worker0224656166%7.6
Nurse Practitioner1014165257%8
Respiratory Therapy Technician0663615257%6.5
Administrator1013524448%8
Occupational Therapy Assistant0114189%5.1
Medical Director011351112%3.2
Occupational Therapy Aide0111222%6
90 Certified Nursing Assistant
% of Days 100%
25 Registered Nurse
% of Days 100%
18 Other Dietary Services Staff
% of Days 100%
9 Clinical Nurse Specialist
% of Days 97%
10 Licensed Practical Nurse
% of Days 100%
21 Nurse Aide in Training
% of Days 76%
3 Dental Services Staff
% of Days 70%
3 Physical Therapy Aide
% of Days 74%
2 RN Director of Nursing
% of Days 71%
3 Speech Language Pathologist
% of Days 79%
3 Physical Therapy Assistant
% of Days 83%
1 Dietitian
% of Days 65%
2 Qualified Social Worker
% of Days 66%
1 Nurse Practitioner
% of Days 57%
6 Respiratory Therapy Technician
% of Days 57%
1 Administrator
% of Days 48%
1 Occupational Therapy Assistant
% of Days 9%
1 Medical Director
% of Days 12%
1 Occupational Therapy Aide
% of Days 2%

Penalties and fines

Federal penalties imposed by CMS for regulatory violations, including civil money penalties (fines) and denials of payment for new Medicare/Medicaid admissions.

Source: CMS Penalties Database

No penalties in the past 3 years

No civil money penalties or payment denials were reported in the last 3 years.

Quality of care over time

These measures show how residents usually do over time at this home, based on health outcomes and preventive care.

High-risk clinical events score Info A composite score based on pressure ulcers, falls with injury, weight loss, walking ability decline, and activities of daily living decline. 7.5
11% better than Michigan average

Michigan average: 8.4

Functional decline score Info A composite score based on activities of daily living decline, walking ability decline, and incontinence. 17.8
9% worse than Michigan average

Michigan average: 16.3

Long-stay resident measures
Need for Help with Daily Activities Increased Info Percent of long-stay residents whose need for help with daily activities has increased 11.3%
10% better than Michigan average

Michigan average: 12.5%

Walking Ability Worsened Info Percent of long-stay residents whose ability to move independently worsened 17.0%
11% worse than Michigan average

Michigan average: 15.3%

Low Risk Residents with Bowel/Bladder Incontinence Info Percent of low risk long-stay residents who lose control of their bowels or bladder 25.1%
19% worse than Michigan average

Michigan average: 21.0%

Falls with Major Injury Info Percent of long-stay residents experiencing one or more falls with major injury 3.5%
11% worse than Michigan average

Michigan average: 3.2%

High Risk Residents with Pressure Ulcers Info Percent of long-stay high risk residents with pressure ulcers 2.2%
62% better than Michigan average

Michigan average: 5.7%

Urinary Tract Infection Info Percent of long-stay residents with a urinary tract infection 2.3%
35% worse than Michigan average

Michigan average: 1.7%

Lost Too Much Weight Info Percent of long-stay residents who lose too much weight 3.6%
37% better than Michigan average

Michigan average: 5.7%

Depressive Symptoms Info Percent of long-stay residents who have depressive symptoms 3.4%
13% better than Michigan average

Michigan average: 3.9%

Antipsychotic Use Info Percent of long-stay residents who received an antipsychotic medication 13.3%
12% better than Michigan average

Michigan average: 15.0%

Pneumococcal Vaccine Info Percent of long-stay residents assessed and appropriately given the pneumococcal vaccine 99.8%
5% better than Michigan average

Michigan average: 94.9%

Influenza Vaccine Info Percent of long-stay residents assessed and appropriately given the seasonal influenza vaccine 100.0%
5% better than Michigan average

Michigan average: 95.0%

Short-stay resident measures
Pneumococcal Vaccine Info Percent of short-stay residents assessed and appropriately given the pneumococcal vaccine 96.8%
17% better than Michigan average

Michigan average: 82.5%

Antipsychotic medication increase Info Percent of short-stay residents who newly received an antipsychotic medication 0.4%
73% better than Michigan average

Michigan average: 1.4%

Influenza Vaccine Info Percent of short-stay residents assessed and appropriately given the seasonal influenza vaccine 91.7%
15% better than Michigan average

Michigan average: 79.5%

Breakdown by payment type

Medicare

34% of new residents, usually for short-term rehab.

Typical stay 27 days

Private pay

55% of new residents, often for short stays.

Typical stay 1 - 2 months

Medicaid

11% of new residents, often for long-term daily care.

Typical stay 2 - 3 years

Facility Characteristics

Source: CMS Long-Term Care Facility Characteristics (Data as of Jan 2026)

Total residents 133
Medicare
4
3% of residents
Medicaid
97
72.9% of residents
Private pay or other
32
24.1% of residents
Programs & Services
Residents Group

Residents meet regularly to discuss policies, care quality, and activities

Active Resident Council

Organized group of residents that meets regularly to discuss facility policies, quality of life, and activities.

Finances and operations

Based on CMS SNF Cost Report for fiscal year ending in 12/2023.

Government
Operated by federal authorities.
Net patient revenue Info Net patient revenue — what the home actually collects for resident care, after contractual allowances, bad debt and discounts are subtracted from its gross charges (CMS cost report, Worksheet G-3). It covers resident care only; money the home earns from other sources is shown separately as "Other income."
$21.9M
Net patient income Info Net patient income: net patient revenue minus the home's total operating expenses. A positive figure means it earns more from resident care than it spends to deliver it; a negative figure means the opposite. It excludes non-operating "other income."
-$3.2M
Government Operated by federal authorities.
Net patient revenue Info Net patient revenue — what the home actually collects for resident care, after contractual allowances, bad debt and discounts are subtracted from its gross charges (CMS cost report, Worksheet G-3). It covers resident care only; money the home earns from other sources is shown separately as "Other income."
$21.9M Rank #15 / 143Revenue — State benchmarkedThis home is ranked 15th out of 143 homes in Michigan. Shows this facility's annual revenue compared to the Michigan average. Higher revenue generally means more resources for staffing and capital — read alongside Payroll %.Rankings are based only on facilities in Michigan that report data for that category. Facilities without available data are excluded from the ranking.Click the rank badge to see the full State ranking.Click here to see the full State ranking.
Net patient income Info Net patient income: net patient revenue minus the home's total operating expenses. A positive figure means it earns more from resident care than it spends to deliver it; a negative figure means the opposite. It excludes non-operating "other income."
-$3.2M
Other income Info Money the home earns outside of resident care — such as investments, grants, rentals and other non-operating sources (CMS cost report, Worksheet G-3). It is tracked separately from net patient revenue: it is not part of that figure, and it is not included in net patient income.
$9.1M
Payroll costs Info Staff salaries plus wage-related costs — benefits such as payroll taxes, health insurance and retirement — from the home's own accounting records (CMS cost report, Worksheet A). Contract or agency labor is counted separately, under other operating costs. Rank #5 / 143Payroll — State benchmarkedThis home is ranked 5th out of 143 homes in Michigan. Shows total annual staff payroll benchmarked to the Michigan average. Higher payroll investment relative to peers often signals better staffing and less reliance on cheaper contract labor.Rankings are based only on facilities in Michigan that report data for that category. Facilities without available data are excluded from the ranking.Click the rank badge to see the full State ranking.Click here to see the full State ranking.
$18.4M 83.8% of net patient revenue Info Payroll as a share of revenue: staff salaries and wage-related benefits divided by net patient revenue. A higher figure means more of each revenue dollar goes to staff pay. Rank #19 / 143Payroll % — State benchmarkedThis home is ranked 19th out of 143 homes in Michigan. Shows payroll as a percentage of revenue versus the Michigan average. Well-run Michigan facilities typically land around 49–59% — the top third Statewide. Below 25% may signal understaffing or heavy agency use — read with Staffing ratings.Rankings are based only on facilities in Michigan that report data for that category. Facilities without available data are excluded from the ranking.Click the rank badge to see the full State ranking.Click here to see the full State ranking.
Other operating costs Info Everything it costs to run the home apart from payroll — food, utilities, supplies, maintenance, contract labor and administration. Calculated as total operating expense minus payroll (staff salaries and wage-related benefits).
$6.8M
Total costs Info The home's total operating expense for the year — all the costs of running it, salaries included (CMS cost report, Worksheet G-3).
$25.1M

What does this home offer?

Housing options icon

Housing Options: Private / Semi-Private Rooms

Building type icon
Building type icon

Building Type: Single-story

Beauty services icon

Beauty Services

Social and recreational activities icon

Social and Recreational Activities

On-site medical care and health services icon

On-site Medical Care and Health Services

Who this home usually serves

TYPE OF STAY

Mix of rehab and long-term care

This home supports both short-term rehab and long-term care, with residents staying for a wide range of durations.

Most new residents arrive under private pay (55% of admissions), and a typical private pay stay runs around 1 - 2 months.

Admissions
352 total

Coverage residents most often arrive under.

Medicare 34%
Private pay 55%
Medicaid 11%
Discharges
348 total

Coverage residents most often leave under.

Medicare 24%
Private pay 57%
Medicaid 19%

Places of interest near Pleasant View

Address 2.9 miles from city center Info Estimated distance in miles from Owosso's city center to Pleasant View's address, calculated via Google Maps.

Calculate Travel Distance to Pleasant View

Add your location

Address

Compare Nursing Homes around Owosso

The information below is reported by the Michigan Department of Licensing and Regulatory Affairs (LARA).

2 facilities compared · CMS & MI Dept. of Health data

Pleasant View
NH
MC
Owosso
136
Facility 136
MI AVG 75
Rank #49 / 435
94.0%
Facility 94.0%
MI AVG 75.8%
Rank #17 / 395
+24%
4.20
Facility 4.20
MI AVG 4.30
Rank #54 / 142
+22%-2%
$0
Facility $0
MI AVG $87.6k
Rank #1 / 145
8
Facility 8
MI AVG 33.5
Rank #8 / 144
1.6
Facility 1.6
MI AVG 5.2
Rank #2 / 144
2134-
34
Facility 34
MI AVG 39
Rank #379 / 703
County Of Shiawassee
$21.9M
Facility $21.9M
MI AVG $15.8M
Rank #15 / 143
$18.4M
Facility $18.4M
MI AVG $5.6M
Rank #5 / 143
83.8%
Facility 83.8%
MI AVG 39%
Rank #19 / 143
235067
Ovid Healthcare Center
NH
HC
PC
RC
Ovid
94
Facility 94
MI AVG 75
Rank #151 / 435
66.2%
Facility 66.2%
MI AVG 75.8%
Rank #144 / 395
-13%
3.98
Facility 3.98
MI AVG 4.30
Rank #69 / 142
+48%-7%
$80.0k
Facility $80.0k
MI AVG $87.6k
Rank #128 / 145
45
Facility 45
MI AVG 33.5
Rank #102 / 144
9.0
Facility 9.0
MI AVG 5.2
Rank #134 / 144
359-
40
Facility 40
MI AVG 39
Rank #320 / 703
Kelly Martin
$7.4M
Facility $7.4M
MI AVG $15.8M
Rank #84 / 143
$3.9M
Facility $3.9M
MI AVG $5.6M
Rank #122 / 143
52.5%
Facility 52.5%
MI AVG 39%
Rank #133 / 143
235569

Financial Assistance for
Nursing Home in Michigan

Pleasant View is located in Owosso, Michigan.
Here are the financial assistance programs available to residents in Michigan.

Get Financial aid guidance

MI Choice Waiver

Michigan Medicaid MI Choice Waiver

Age 65+ or disabled
General Michigan resident, Medicaid- eligible, nursing home-level care need.
Income Limits (2025) ~$2,829/month 300% FBR, individual
Asset Limits $2,000 (individual), $3,000 (couple).
MI

Delivered through regional waiver agents; waitlists possible.

Benefits
Personal care (5-7 hours/day) Respite care (240 hours/year) Home modifications ($1,500 avg.) Adult day care ($65/day)

Home Help Program

Michigan Home Help

Age 65+ or disabled
General Michigan resident, Medicaid- eligible or low-income.
Income Limits ~$1,732/month individual, Medicaid threshold
Asset Limits $2,000 individual
MI

Can hire family caregivers; less intensive than waiver.

Benefits
Personal care (up to 60 hours/month) Homemaker services Respite (varies)

Program of All-Inclusive Care for the Elderly (PACE)

Michigan PACE

Age 55+
General Michigan resident, nursing home-level care need, safe with PACE support.
Income Limits (2025) ~$2,829/month (Medicaid-eligible); private pay option available.
Asset Limits $2,000 (individual), $3,000 (couple).
MI

16 PACE centers (e.g., Ingham, Wayne counties); expanding slowly.

Benefits
Personal care (5-7 hours/day) Medical care Meals Transportation Therapy Respite

Medicare Savings Program (MSP)

Michigan Medicare Savings Program

Age 65+ or disabled
General Michigan resident, Medicare Part A/B.
Income Limits (2025) ~$2,510/month (QMB), ~$3,380/month (SLMB), ~$3,598/month (QI)—individual.
Asset Limits $9,430 (individual), $14,130 (couple).
MI

Three tiers; no waitlist; includes Extra Help for Part D.

Benefits
Covers Part B premiums ($174.70/month) Deductibles ($240/year) Copays (~20%)

National Family Caregiver Support Program (NFCSP) Respite

Michigan NFCSP Respite Care

Age
General Caregivers of 60+ needing care or 55+ caregivers of others; Michigan resident; functional needs (2+ ADLs).
Income Limits (2025) Prioritizes ~$24,980/year (individual); no strict cap.
Asset Limits Not assessed; need-based.
MI

16 AAAs; prioritizes low-income, rural caregivers.

Benefits
Respite (4-6 hours/week or 5 days/year) Adult day care ($60/day) Caregiver training

VA Aid and Attendance (A&A) and Housebound Benefits

Michigan VA Aid and Attendance/Housebound

Age 65+ or disabled veteran/spouse
General Michigan resident, wartime service, need for ADL help (A&A) or homebound.
Income Limits (2025) Net income < ~$1,984/month (veteran with dependent, A&A); pension offsets income.
Asset Limits ~$155,356 net worth limit
MI

High veteran demand in urban/rural areas.

Benefits
Cash (~$1,433-$2,642/month veteran, ~$951-$1,318 spouse) for care costs

Frequently Asked Questions about Pleasant View

Is Pleasant View in a walkable area?

Pleasant View has a walk score of 34. Somewhat walkable. A few nearby services may be reachable on foot, but most trips require transportation.

What is the occupancy rate at Pleasant View?

Pleasant View's occupancy is 94.0%.

Is Pleasant View a government-operated facility?

Pleasant View is a government-operated nursing facility.

Are there photos of Pleasant View?

Yes — there are 26 photos of Pleasant View in the photo gallery on this page.

What is the address of Pleasant View?

Pleasant View is located at 275 Caledonia Dr, Owosso, MI 48867.

What is the phone number of Pleasant View?

(989) 743-3491 will put you in contact with the team at Pleasant View.

Is Pleasant View Medicare or Medicaid certified?

Yes — Pleasant View is a CMS-certified provider of Medicare and Medicaid.

Guides for Better Senior Living

Care Cost Calculator: See Prices in Your Area

Nursing Home Data Explorer

Don’t Wait Too Long: 7 Red Flag Signs Your Parent Needs Assisted Living Now

The True Cost of Assisted Living in 2025 – And How Families Are Paying For It

Understanding Senior Living Costs: Pricing Models, Discounts & Financial Assistance