Nursing Home

Quince Nursing and Rehabilitation Center

Nursing Home

Quince Nursing and Rehabilitation Center

6733 Quince Rd, Memphis, TN 38119 View map
Overview of Quince Nursing and Rehabilitation Center

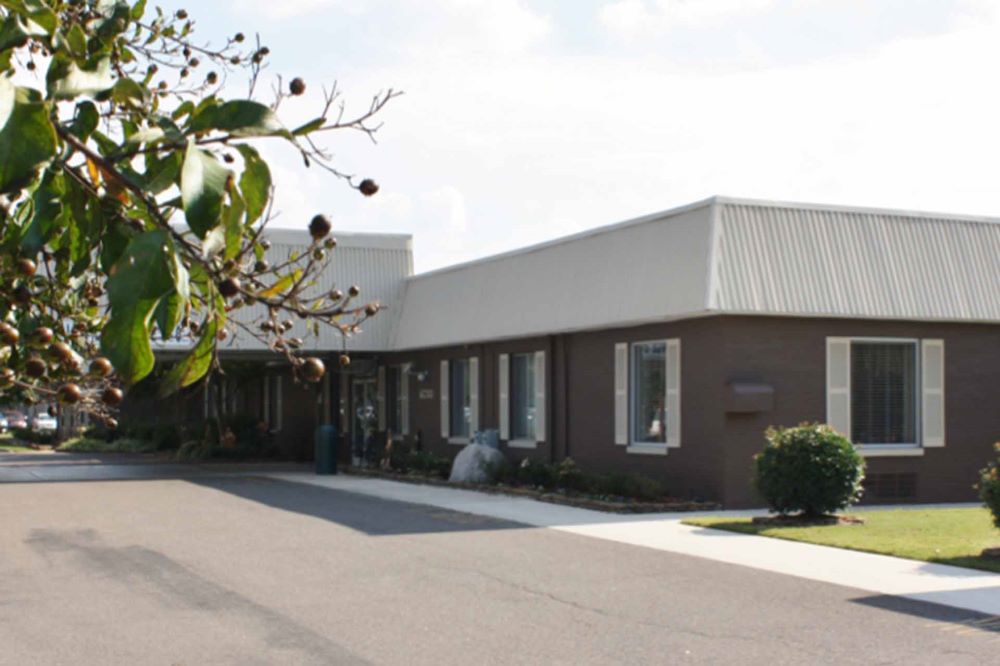
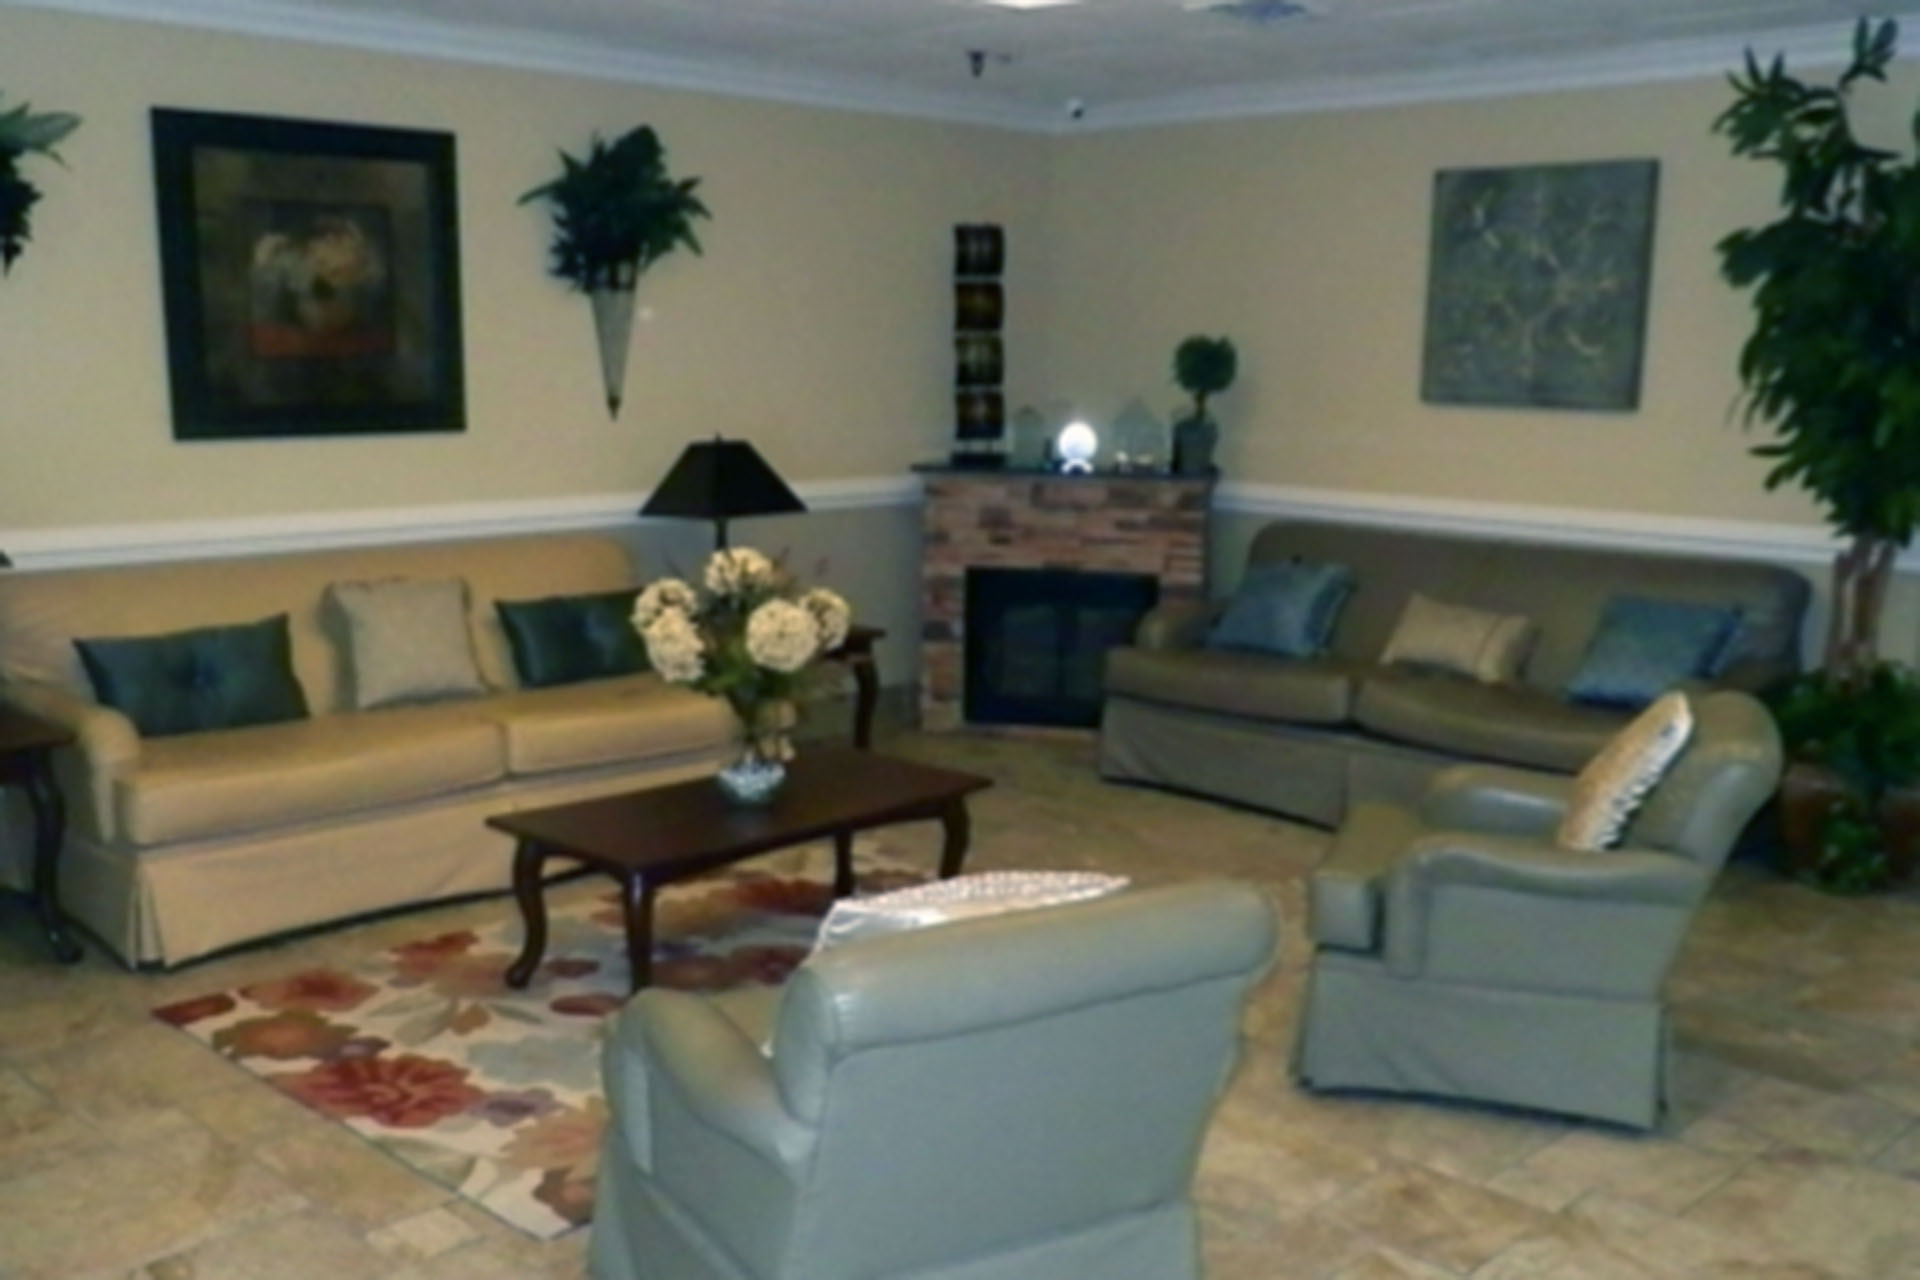
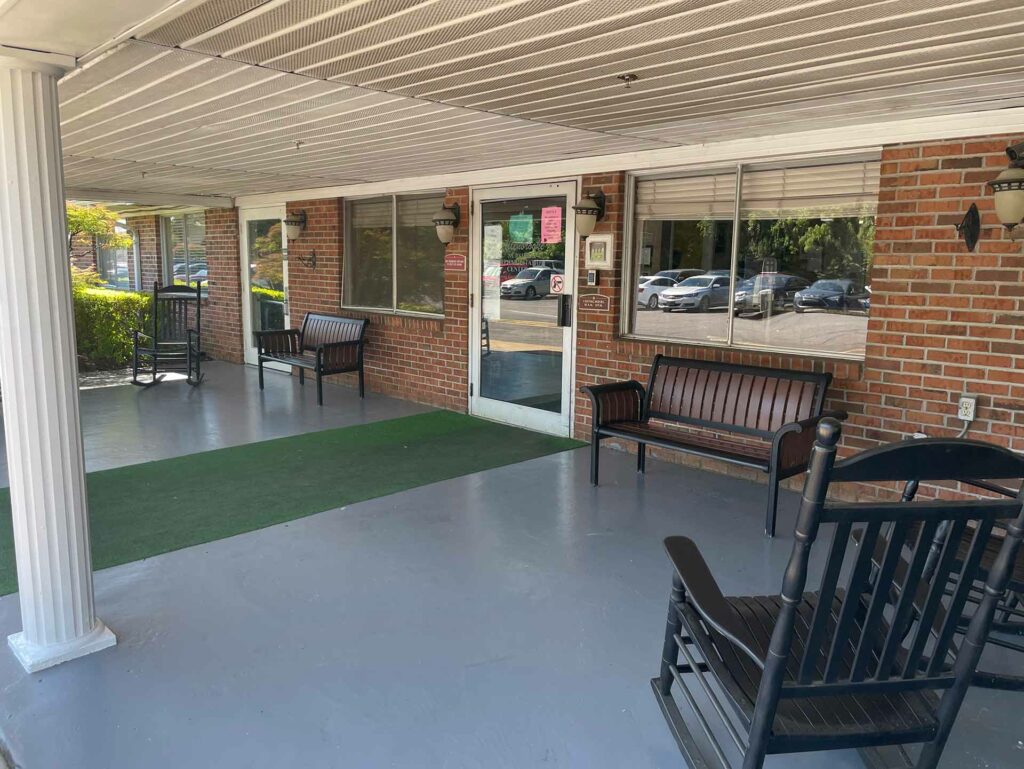
At the Quince Nursing and Rehabilitation Center, a commitment to excellence is not just a motto – it’s a way of life. With a steadfast dedication to upholding the highest standards of care, they go above and beyond to tailor their services to each individual, ensuring specialized and personalized support that enriches the lives of their senior residents. This home, proudly certified by both Medicare and Medicaid, boasts an array of modern amenities and a team of skilled professionals who are devoted to enhancing the senior living experience.
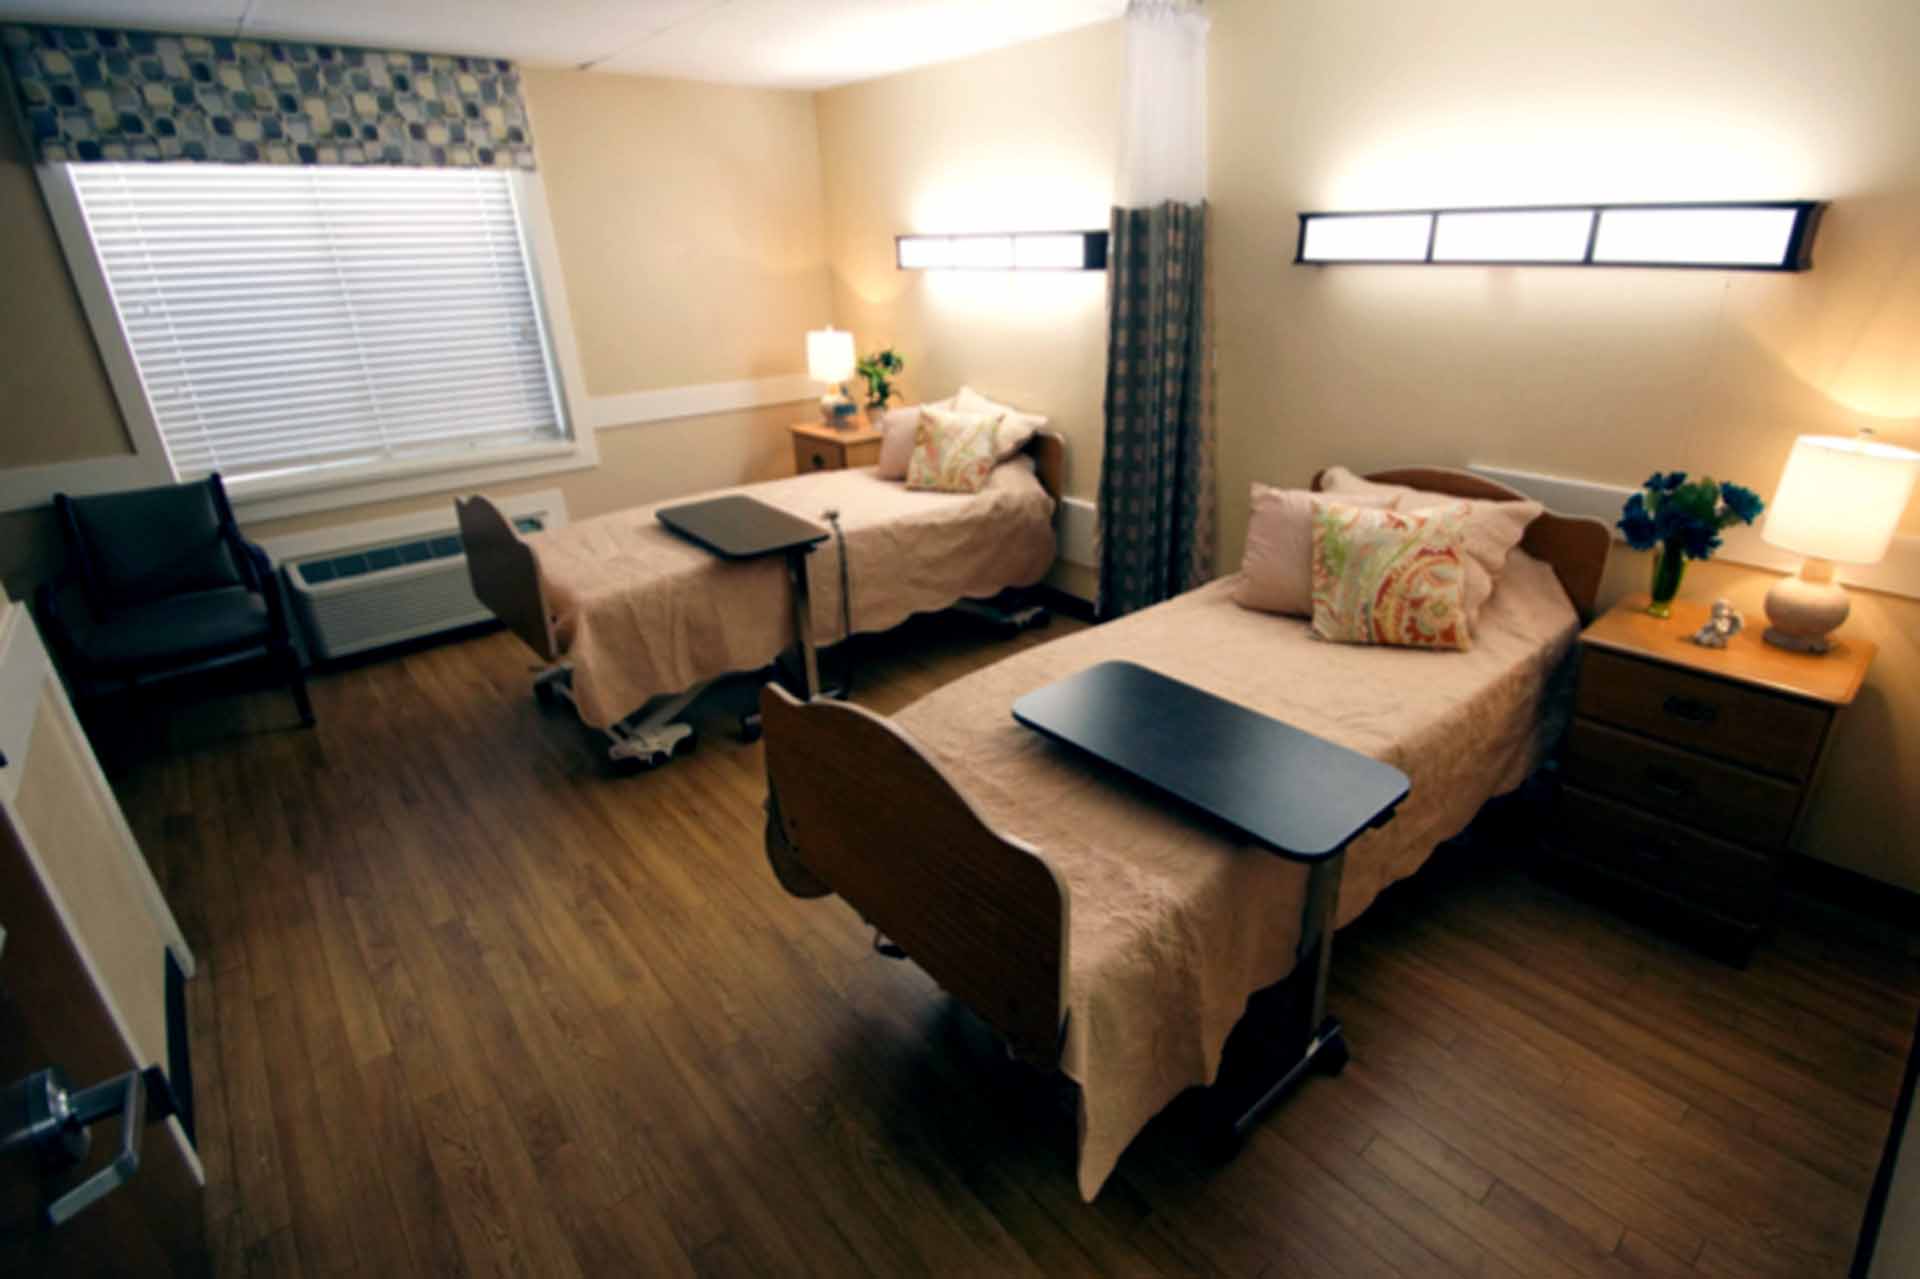
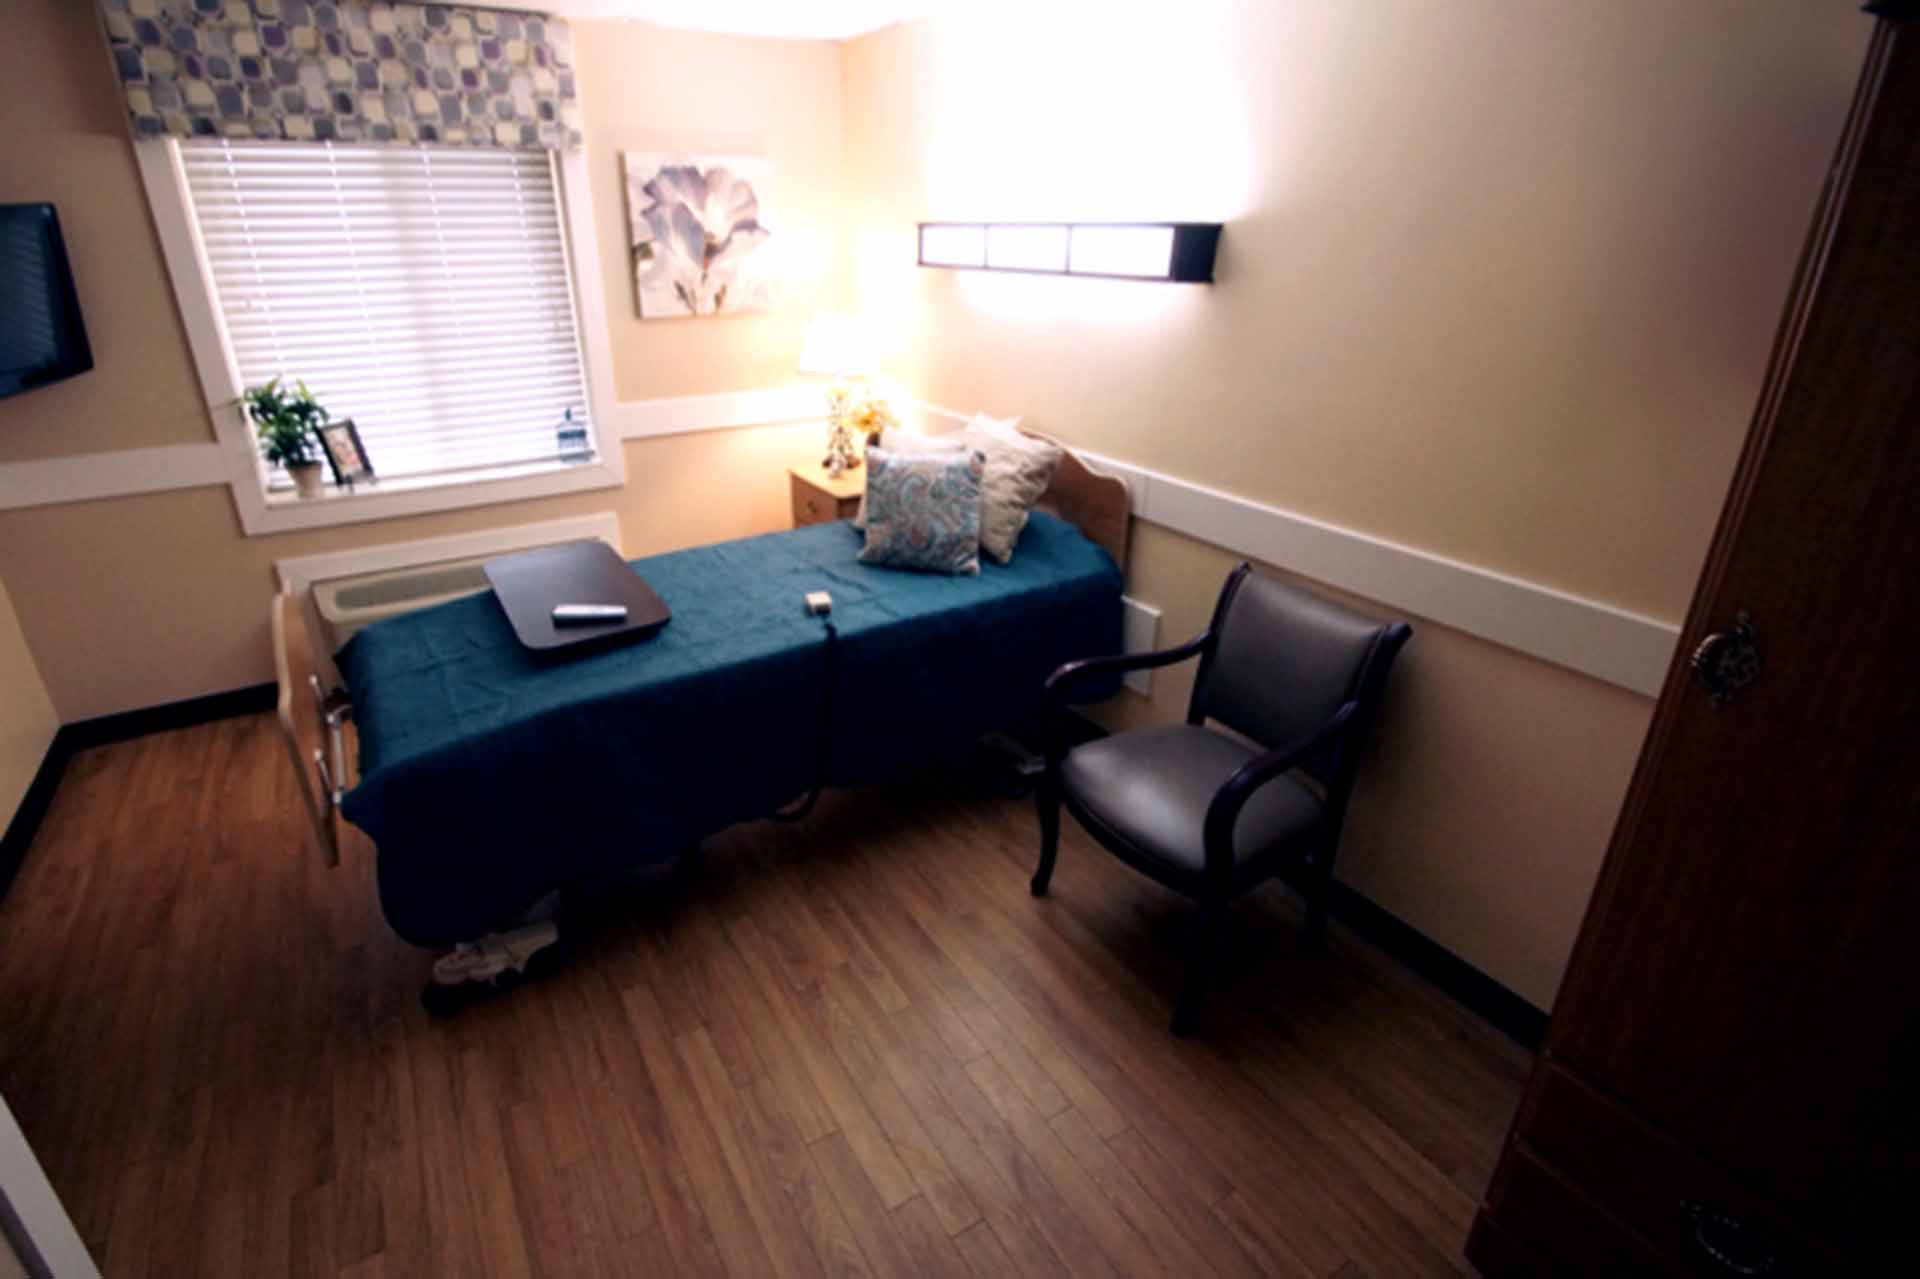
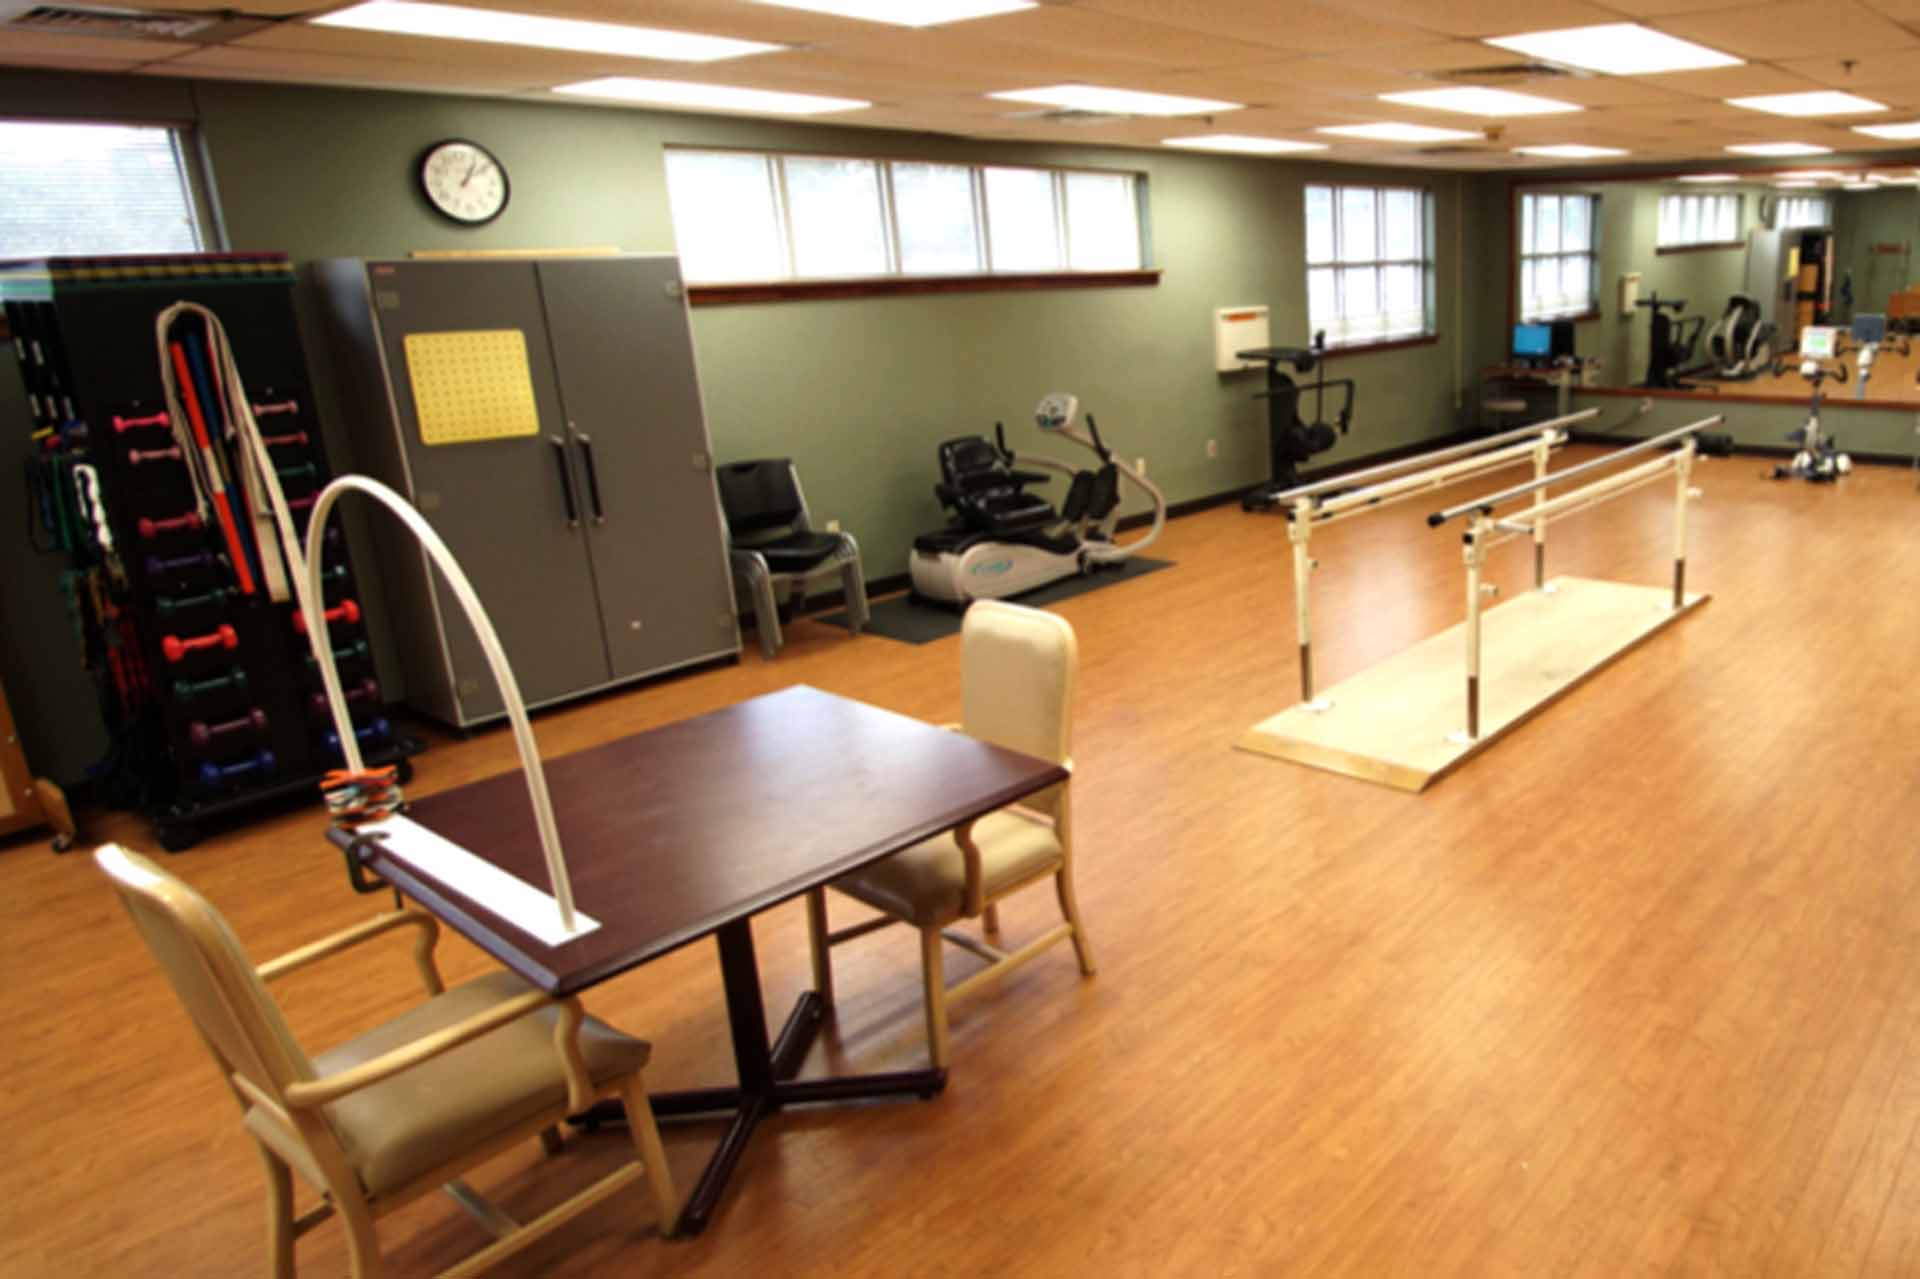
Within their welcoming walls, the facility provides an array of therapeutic services, including outpatient therapy and short-term rehabilitation suites. Their commitment to holistic well-being is evidenced by the presence of state-of-the-art therapy equipment and a compassionate staff who are there to support every step of the journey. From wound care and stroke recovery to cardiac care, pain management, and dysphagia therapy, this center leaves no stone unturned in its pursuit of comprehensive and effective care, ensuring that seniors receive the attention they need to thrive.

(901) 755-3860

Quality ratings

Measured by Centers for Medicare & Medicaid Services (CMS)

Overall rating Info Official CMS rating based on health inspections, staffing and quality measures.
1/5
Mississippi average: 3.0/5
Health Inspection Info Official CMS rating based on deficiencies found during state health inspections.
1/5
Mississippi average: 2.9/5
Staffing Info Official CMS rating based on nurse staffing hours per resident per day.
3/5
Mississippi average: 2.4/5

Nursing care per resident

Info Average daily nursing hours per resident (adjusted for acuity). Higher values indicate more nursing time per resident.
3h 47m per day

This home provides 4% more nursing time per resident than the Mississippi average.

Mississippi average: 3h 38m per day

Staffing hours breakdown

Info Hours of care per resident per day, broken down by staff type. Data from CMS Medicare.
Staff type Facility State avg National avg
Registered Nurse (RN) Info Registered nurse hours per resident per day. 17m per day 25m per day 29m per day

Capacity and availability

Medium-capacity home

Offers a balance of services and community atmosphere.

Total beds 188

This home usually has limited availability

Occupancy is moderate, suggesting balanced demand.

Similar demand to the Mississippi average
Occupancy rate 94.6%
Residents per day (avg) 176
Occupancy rate
94.6%
Residents per day (avg)
176

Who this home usually serves

TYPE OF STAY

Mix of rehab and long-term care

This home supports both short-term rehab and long-term care, with residents staying for a wide range of durations.

Breakdown by payment type

Medicare

23% of new residents, usually for short-term rehab.

Typical stay 1 - 2 months

Private pay

42% of new residents, often for short stays.

Typical stay 2 - 3 months

Medicaid

35% of new residents, often for long-term daily care.

Typical stay 11 - 12 months

Finances and operations

Privately-owned community
Home revenue
$20.8M
Operating loss
-$1.3M
Privately-owned community
Home revenue
$20,771,684.00
Operating loss
$-1,279,719.00
Payroll costs Info The portion of the home's budget spent on staff, including nurses, caregivers, and other employees who support care and operations.
$10.5M
50.6% of revenue
Other operating costs Info All remaining costs needed to run the home, such as food, utilities, building maintenance, supplies and administrative expenses.
$11.5M
Total costs $22.1M
Bed community size
188-bed community
A large-scale community that may provide a wide range of amenities, services, and structured programs.
Walk Score
Walk Score: 47 / 100
Somewhat walkable. A few nearby services may be reachable on foot, but most trips require transportation.
BBB Rating
BBB Rating: A+ (Not Accredited)
An independent rating from the Better Business Bureau based on factors such as complaint history, transparency, and business practices.
How BBB ratings work

About this community

License details

Facility type
Nursing Home
Status Appl In Process

Additional licensing details

CMS Certification Number: 445197

Ownership & operating entity

Quince Nursing and Rehabilitation Center is legally operated by Quince Nursing and Rehabilitation LLC, and administrated by Felix Strickland.

Staffing

Key information about the people who lead and staff this community.

Leadership

Contact: Mr. Bo Maynard, Executive Director

Types of Care at Quince Nursing and Rehabilitation Center

Nursing Home
Contact Quince Nursing and Rehabilitation Center

Health Inspection History

Inspections
Total health inspections 4

Mississippi average 4.4


Last Health inspection on Jul 2025

Total health citations 20
Citations per inspection
5

Health citations are formal notices following inspections when they fail to comply with safety and care standards.

18 of 20 citations resulted from standard inspections; and 2 of 20 resulted from complaint investigations.

Breakdown of citation severity (last 3 years)
Critical Health citations More info 5
400% worse than Mississippi average

Mississippi average: 1


Serious Health citations More info 0
100% better than Mississippi average

Mississippi average: 1.1

5 critical citations More info Mississippi average: 1

0 serious citations More info Mississippi average: 1.1

15 moderate citations More info Mississippi average: 14.6

0 minor citations More info Mississippi average: 0.3
Citations history (last 3 years)
Abuse/Neglect critical citation Jul 01, 2025
Corrected

Nursing Services moderate citation Jul 01, 2025
Corrected

Abuse/Neglect critical citation Oct 22, 2021
Corrected

Abuse/Neglect critical citation Oct 22, 2021
Corrected

Compare Nursing Homes around Southaven

The information below is reported by the Mississippi State Department of Health, Bureau of Health Facilities Licensure.
Allenbrooke Nursing & Rehab Center
AL

Assisted Living For seniors needing help with daily tasks but not full-time nursing.

IL

Independent Living For self-sufficient seniors seeking community and minimal assistance.

MC

Memory Care Specialized care for those with Memory Loss, Alzheimer's, or dementia, ensuring safety and support.

SNF

Nursing Homes 24/7 care needed

Memphis
180
A+
48
ANDERSON, RICHIE
89.6%
$18,434,339.00
$10,237,003.00
55.5%
164.20
3/5
3.5298
3/5
2/5
4/5
-
8
1
-8%
-3%
+23%
-
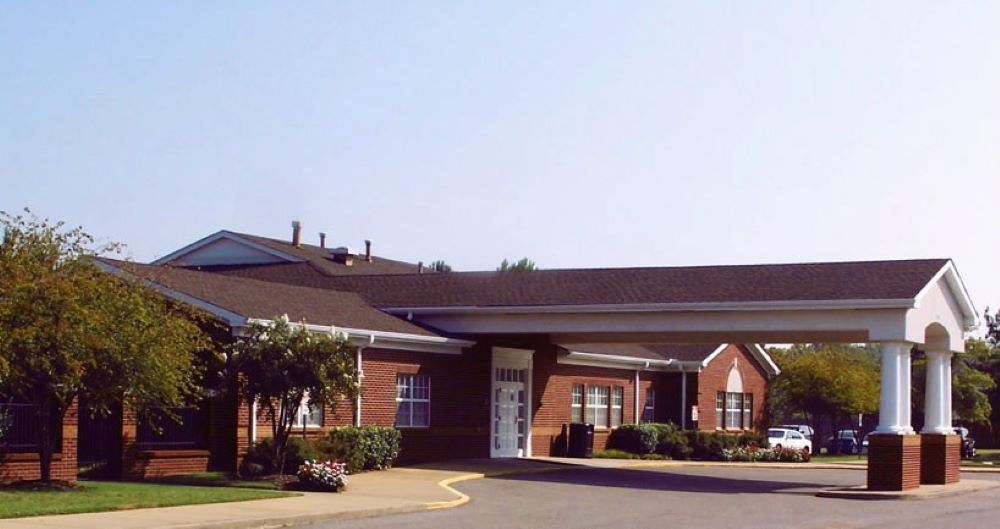
DeSoto Healthcare Center
SNF

Nursing Home 24/7 care needed

AL

Assisted Living For seniors needing help with daily tasks but not full-time nursing.

Southaven (Brook Hollow)
120
A+
25
DESOTO HEALTHCARE INC
78.2%
$12,085,026.00
$4,437,714.00
36.7%
93.80
2/5
4.5442
2/5
4/5
2/5
1
17
2
-40%
-2%
-5%
-
Diversicare of Safe Haven
SNF

Nursing Home 24/7 care needed

AL

Assisted Living For seniors needing help with daily tasks but not full-time nursing.

Southaven
140
-
20
DAVIS, HANNAH
93.5%
$17,213,053.00
$5,978,609.00
34.7%
132.80
1/5
3.8754
1/5
3/5
3/5
7
40
7
+41%
-16%
+14%
Studio / 1 Bed / 2 Bed
Quince Nursing and Rehabilitation Center
SNF

Nursing Home 24/7 care needed

AL

Assisted Living For seniors needing help with daily tasks but not full-time nursing.

Memphis (Keswick - Stornaway)
188
A+
47
COTTRELL, JULIE
94.6%
$19,494,836.00
$10,504,548.00
53.9%
176.10
1/5
3.7836
1/5
3/5
-
1
20
5
-10%
+4%
+30%
Studio / 1 Bed / 2 Bed
AccentCare
SNF

Nursing Home 24/7 care needed

AL

Assisted Living For seniors needing help with daily tasks but not full-time nursing.

-
-
-
46
-
-
-
-
-
-
-
-
-
-
-
-
-
-
-
-
-
-

Places of interest near Quince Nursing and Rehabilitation Center

Address 14.4 miles from city center — 2.07 miles to nearest hospital (Methodist Le Bonheur Germantown Hospital)

Address 6733 Quince Rd, Memphis, TN 38119

Calculate Travel Distance to Quince Nursing and Rehabilitation Center

Add your location

Address

Staffing Data

Source: CMS Payroll-Based Journal (Q2 2025)

258
Total Staff
255
Employees
3
Contractors
74,079
Total Hours (Quarter)
106
Avg Staff/Day
7.7
Avg Shift (hrs)
Nursing Staff Breakdown
Role Count Avg Shift (hrs) Uses Contractors?
Registered Nurse209.4 No
Licensed Practical Nurse558.1 No
Certified Nursing Assistant1197.3 No
Staff by Category
Administration
3 staff
7.8hs shift avg
Nursing Staff
198 staff
7.7hs shift avg
Physicians & Practitioners
8 staff
7.8hs shift avg
Therapy Services
37 staff
7.5hs shift avg
Activities & Recreation
1 staff
7.3hs shift avg
Social Services
4 staff
7.2hs shift avg
Dietary Services
4 staff
7.5hs shift avg
Other Services
3 staff
8.2hs shift avg
Contractor Analysis
0.1%
of total hours from contractors
78 contractor hours this quarter
Medical Director: 1 Occupational Therapy Assistant: 2
Role Employees Contractors Total Staff Total Hours Days Worked % of Days Avg Shift (hrs)
Certified Nursing Assistant119011932,49391100%7.3
Licensed Practical Nurse5505516,34891100%8.1
Physical Therapist200206,88591100%7.8
Registered Nurse200205,59191100%9.4
Respiratory Therapy Technician4041,4048695%6.5
Physical Therapy Assistant3031,3637380%7.7
Clinical Nurse Specialist6061,3586774%7.8
Qualified Social Worker4041,3337178%7.2
Speech Language Pathologist4041,0777481%7.5
Dental Services Staff2029896571%8.3
Other Dietary Services Staff3039878998%7.3
Administrator2029686369%8
RN Director of Nursing4046944448%7.3
Physical Therapy Aide3035097077%7.1
Nurse Practitioner2025046369%8
Dietitian1014966268%8
Therapeutic Recreation Specialist1014766571%7.3
Mental Health Service Worker1014725965%8
Medical Director011641213%5.3
Occupational Therapy Aide101561719%3.3
Occupational Therapy Assistant0221433%4.5

Facility Characteristics

Source: CMS Long-Term Care Facility Characteristics (Data as of Jan 2026)

Total census
147 residents
Residents by payment source
Medicare
22 residents (15%)
Medicaid
57 residents (38.8%)
Private pay or other
68 residents (46.3%)
Programs & Services
Residents' Group

Residents meet regularly to discuss policies, care quality, and activities

Active Resident Council

Organized group of residents that meets regularly to discuss facility policies, quality of life, and activities.

Quality of care over time

These measures show how residents usually do over time at this home, based on health outcomes and preventive care.

High-risk clinical events score Info A composite score based on pressure ulcers, falls with injury, weight loss, walking ability decline, and activities of daily living decline. 7.8
26% better than Mississippi average

Mississippi average: 10.5

Functional decline score Info A composite score based on activities of daily living decline, walking ability decline, and incontinence. 14.5
26% better than Mississippi average

Mississippi average: 19.5

Long-stay resident measures
Need for Help with Daily Activities Increased Info Percent of long-stay residents whose need for help with daily activities has increased 11.1%
31% better than Mississippi average

Mississippi average: 16.0%

Walking Ability Worsened Info Percent of long-stay residents whose ability to move independently worsened 17.2%
21% better than Mississippi average

Mississippi average: 21.7%

Low Risk Residents with Bowel/Bladder Incontinence Info Percent of low risk long-stay residents who lose control of their bowels or bladder 15.1%
27% better than Mississippi average

Mississippi average: 20.7%

Falls with Major Injury Info Percent of long-stay residents experiencing one or more falls with major injury 1.7%
54% better than Mississippi average

Mississippi average: 3.7%

High Risk Residents with Pressure Ulcers Info Percent of long-stay high risk residents with pressure ulcers 4.9%
10% better than Mississippi average

Mississippi average: 5.4%

Urinary Tract Infection Info Percent of long-stay residents with a urinary tract infection 6.0%
190% worse than Mississippi average

Mississippi average: 2.1%

Lost Too Much Weight Info Percent of long-stay residents who lose too much weight 4.0%
36% better than Mississippi average

Mississippi average: 6.3%

Depressive Symptoms Info Percent of long-stay residents who have depressive symptoms 0.0%
100% better than Mississippi average

Mississippi average: 11.0%

Pneumococcal Vaccine Info Percent of long-stay residents assessed and appropriately given the pneumococcal vaccine 98.6%
10% better than Mississippi average

Mississippi average: 89.9%

Influenza Vaccine Info Percent of long-stay residents assessed and appropriately given the seasonal influenza vaccine 97.8%
In line with Mississippi average

Mississippi average: 94.5%

Hospitalizations per 1,000 days Info Number of hospitalizations per 1,000 long-stay resident days. 1.59
In line with Mississippi average

Mississippi average: 1.58

ED visits per 1,000 days Info Number of outpatient emergency department visits per 1,000 long-stay resident days. 0.94
40% better than Mississippi average

Mississippi average: 1.57

Short-stay resident measures
Significantly above average Mississippi avg: 3.4 Info CMS star rating based on short-stay quality measure performance. 5 stars = much above average, 1 star = much below average.
Pneumococcal Vaccine Info Percent of short-stay residents assessed and appropriately given the pneumococcal vaccine 90.7%
14% better than Mississippi average

Mississippi average: 79.7%

Antipsychotic medication increase Info Percent of short-stay residents who newly received an antipsychotic medication 1.5%
15% better than Mississippi average

Mississippi average: 1.7%

Influenza Vaccine Info Percent of short-stay residents assessed and appropriately given the seasonal influenza vaccine 98.6%
24% better than Mississippi average

Mississippi average: 79.8%

Re-hospitalized after SNF stay Info Percentage of short-stay residents who were re-hospitalized after their nursing home admission. 13.7%
38% better than Mississippi average

Mississippi average: 22.2%

Emergency department visits Info Percentage of short-stay residents who had an outpatient emergency department visit. 4.5%
60% better than Mississippi average

Mississippi average: 11.2%

Falls with major injury Info Percentage of SNF residents who experience falls with major injury during their stay. 0.0%
100% better than Mississippi average

Mississippi average: 0.8%

Ability to care for self at discharge Info Percentage of residents at or above expected ability to care for themselves at discharge. 45.8%
15% worse than Mississippi average

Mississippi average: 53.7%

Successful return to home or community Info Rate of successful return to home or community from a skilled nursing facility. 36.3%
28% worse than Mississippi average

Mississippi average: 50.6%

Penalties and fines

Federal penalties imposed by CMS for regulatory violations, including civil money penalties (fines) and denials of payment for new Medicare/Medicaid admissions.

Source: CMS Penalties Database (Data as of Jan 2026)

Total fines amount $72K
17% lower than Mississippi average

Mississippi average: $86K

Number of fines 1
43% fewer fines than Mississippi average

Mississippi average: 1.7

Payment Denials Info Serious action where Medicare and/or Medicaid temporarily stops payments for new residents until issues are fixed. 0
100% fewer payment denials than Mississippi average

Mississippi average: 0.5

Fines amount comparison
This facility $72K
Mississippi average $86K
Penalty History

Penalties are imposed by CMS for violations of federal nursing home regulations.

Civil Money Penalty Info Fines imposed for noncompliance, which can be assessed per day or per instance of violation. Jul 1, 2025
$72K

Last updated: Jan 2026

Guides for Better Senior Living

Care Cost Calculator: See Prices in Your Area

Nursing Home Data Explorer

Don’t Wait Too Long: 7 Red Flag Signs Your Parent Needs Assisted Living Now

The True Cost of Assisted Living in 2025 – And How Families Are Paying For It

Understanding Senior Living Costs: Pricing Models, Discounts & Financial Assistance

Financial Aid for Mississippi Seniors

Get financial aid guidance

Elderly and Disabled Waiver

Mississippi Medicaid E&D Waiver

Age 65+ or disabled, Mississippi resident, Medicaid- eligible, nursing home-level care need.

~$2,829/month (300% FBR, individual).

$4,000 (individual, higher than most states).

Higher asset limit; rural focus.

Mississippi Caregiver Respite Program

MS NFCSP Respite

Caregiver of someone 60+, Mississippi resident.

No strict limit; prioritizes low-income.

Not applicable.

Limited slots; rural emphasis.

Assisted Living (AL) Waiver

Mississippi Assisted Living Waiver

Age 65+ or disabled, Mississippi resident, Medicaid-eligible, NFLOC, living in approved AL facility.

~$2,829/month (300% FBR, individual); QIT required.

$4,000 (individual), $6,000 (couple).

Only for AL facilities with waiver contracts; small program size.

Independent Living (IL) Waiver

Mississippi Independent Living Waiver

Age 16+ (65+ for seniors), Mississippi resident, Medicaid-eligible, NFLOC but capable of self-direction.

~$2,829/month (300% FBR, individual); QIT required.

$4,000 (individual), $6,000 (couple).

Self-directed care; limited to in-home settings.

Medicare Savings Program (MSP)

Mississippi Medicare Savings Program

Age 65+ or disabled, Mississippi resident, Medicare Part A/B.

~$2,510/month (QMB), ~$3,380/month (SLMB), ~$3,598/month (QI)—individual.

$9,430 (individual), $14,130 (couple).

Three tiers; no waitlist; includes Extra Help for Part D.

Mississippi Homemaker Program

Mississippi Homemaker Program (via Area Agencies on Aging)

Age 60+, Mississippi resident, not Medicaid-eligible, needs assistance with daily living.

~$1,063/month (100% FPL, individual); prioritizes low-income.

Not strictly assessed; need-based focus.

10 AAAs; waitlist possible due to funding caps.

Senior Community Service Employment Program (SCSEP)

Mississippi SCSEP

Age 55+, unemployed, low-income, Mississippi resident.

~$1,983/month (125% FPL).

Not specified; income-focused.

Priority for veterans, rural residents; MDES oversees.

VA Aid and Attendance (A&A) and Housebound Benefits

Mississippi VA Aid and Attendance/Housebound

Age 65+ or disabled veteran/spouse, Mississippi resident, wartime service, need for ADL help (A&A) or homebound.

Net income < ~$1,984/month (veteran with dependent, A&A); pension offsets income.

~$155,356 (net worth limit).

High veteran population in rural areas.