Resorts at Chester River Manor

Nursing Home

Resorts at Chester River Manor

200 Morgnec Rd, Chestertown, MD 21620 View Map
Nursing Home
icon
Care Cost Calculator: See Prices in Your Area Care Cost Calculator: See Prices in Your Area icon
Overview of Resorts at Chester River Manor

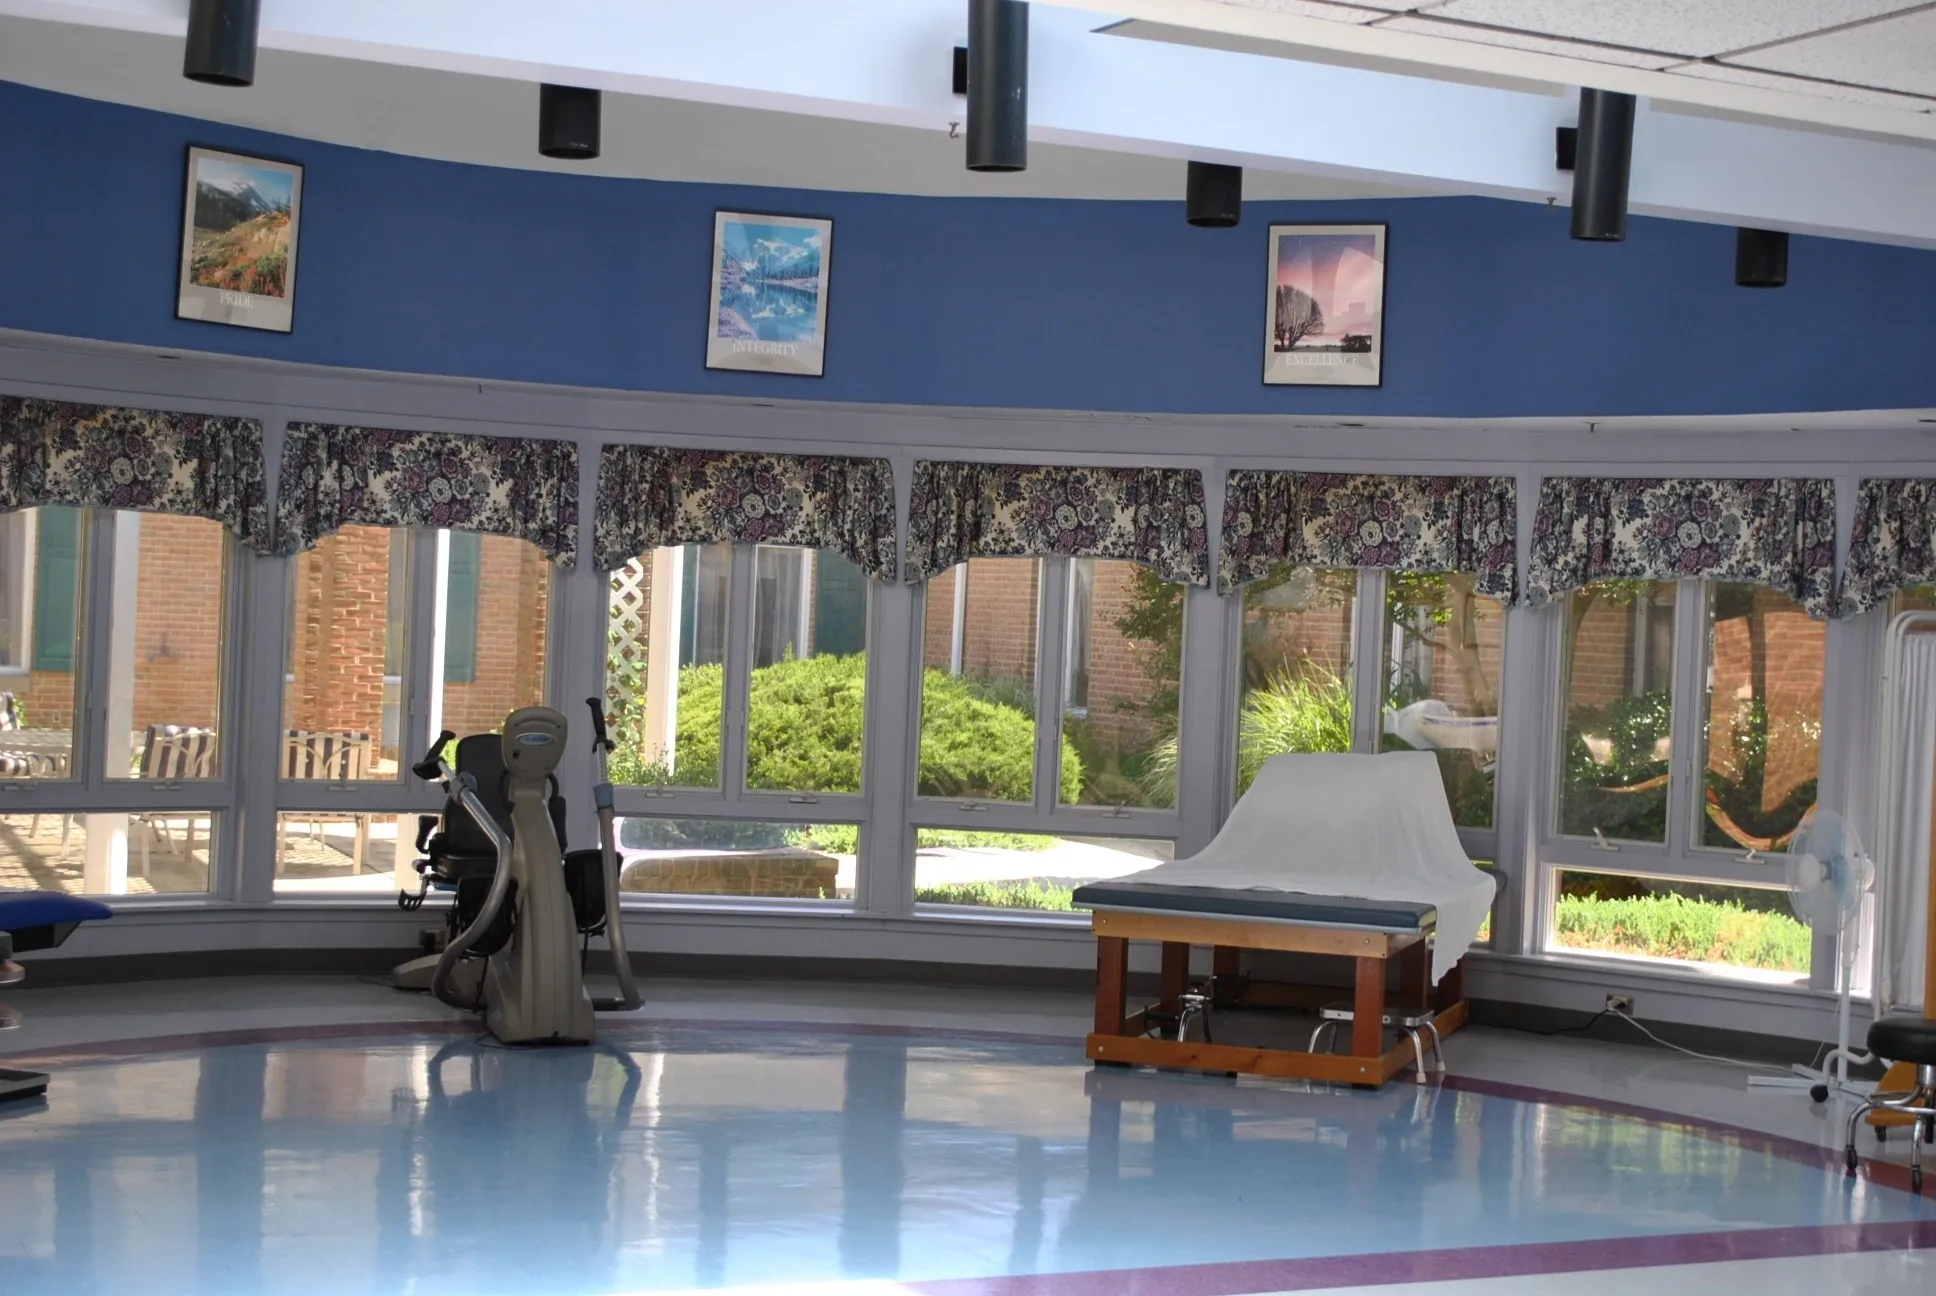
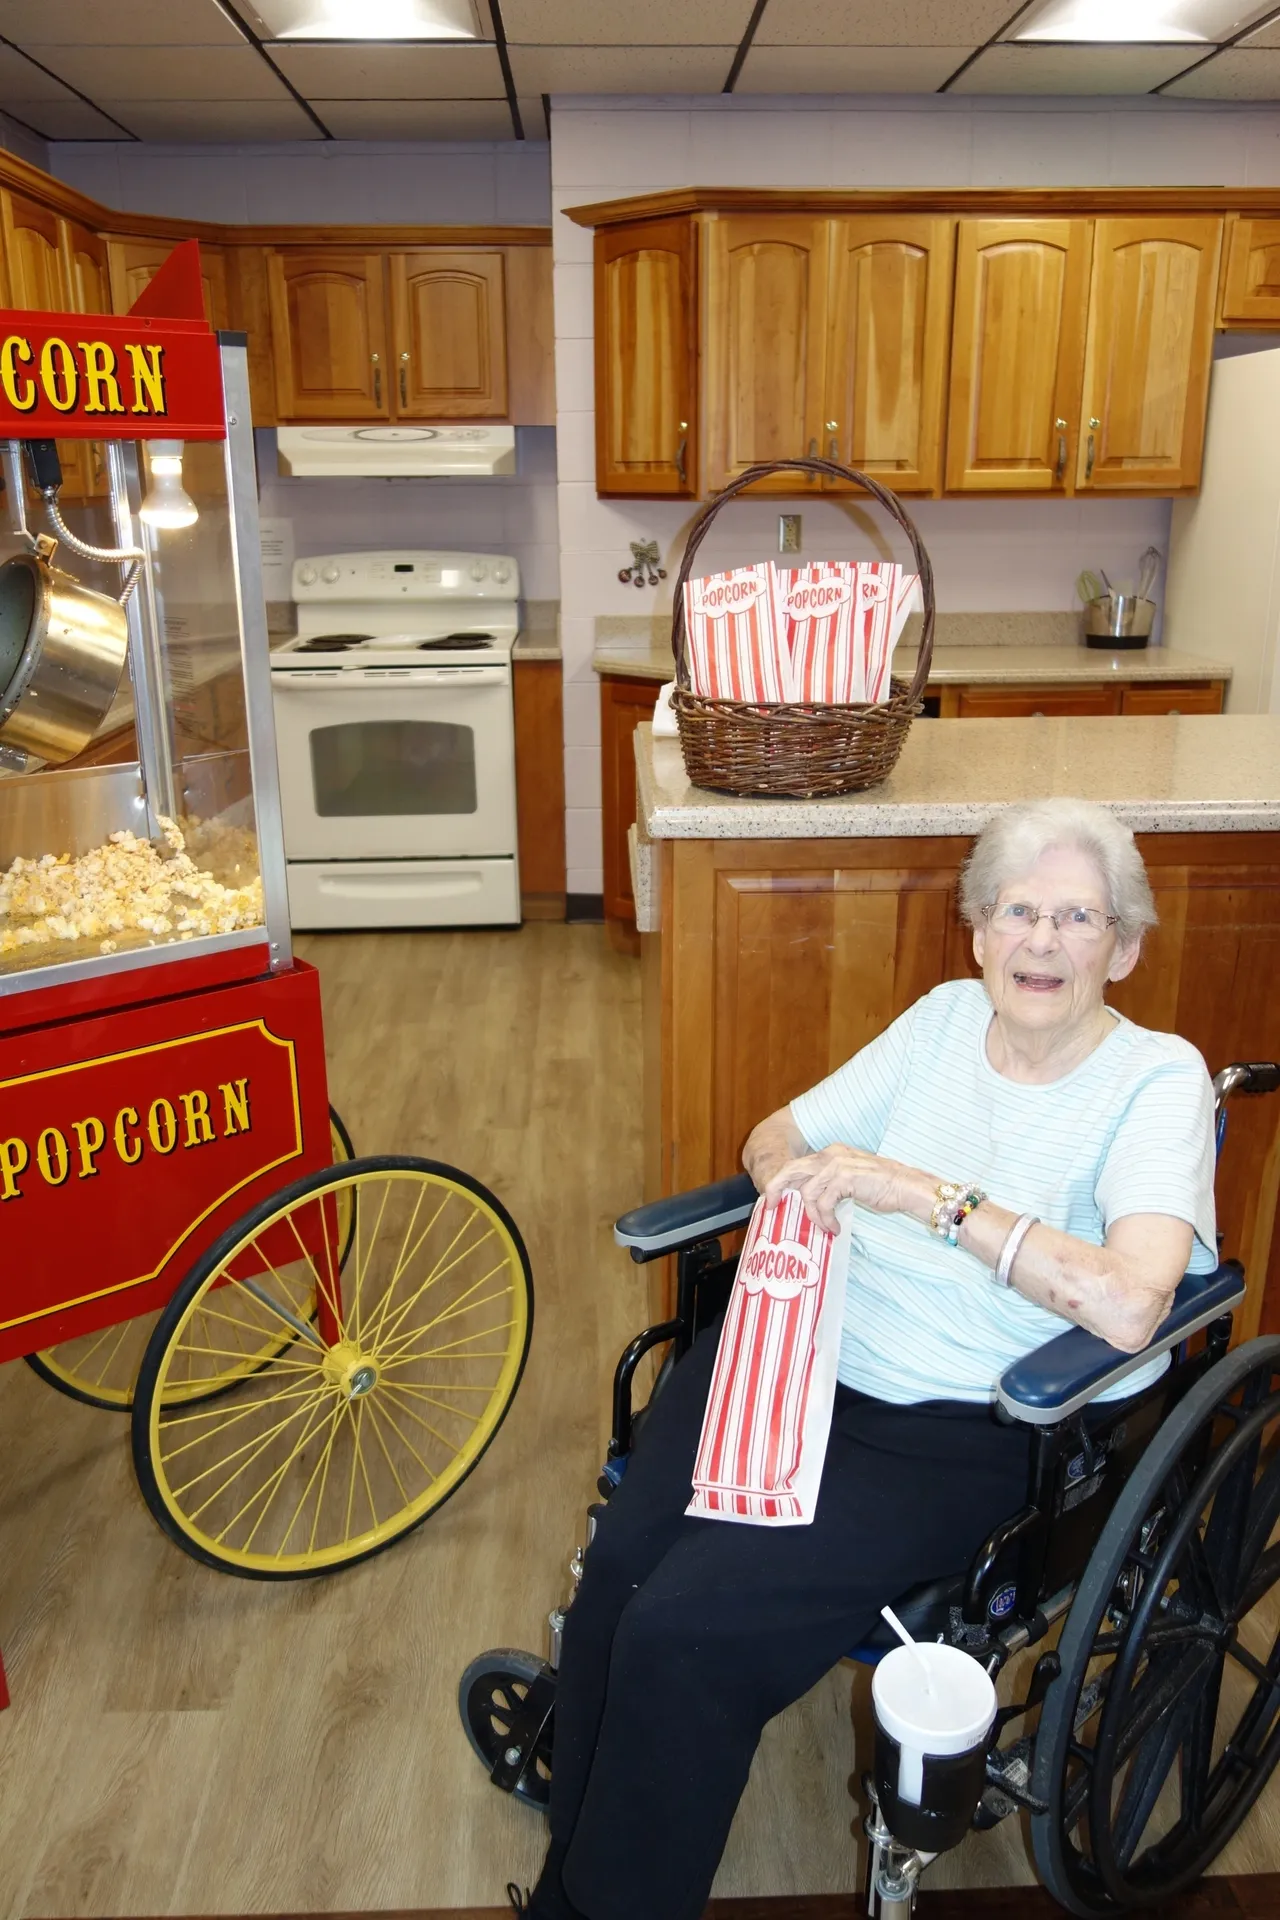
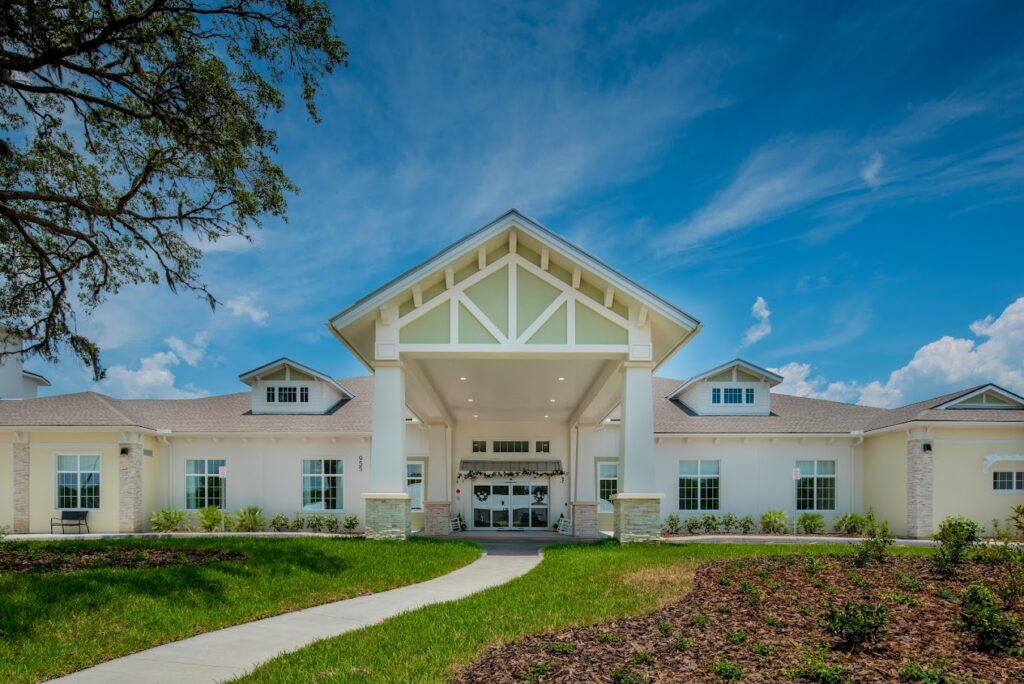
Hidden in scenic Kent County, Resorts at Chester River Manor is a family-owned community dedicated to providing outstanding rehabilitative services, long-term care, respite, and hospice services. Committed to delivering superior care and quicker recoveries, Resorts at Chester River Manor ensures that every resident receives the treatment they need and the service they deserve. With a partnership with Tender Touch for therapy services and a full recreation program, every stay is marked by superior comfort and enjoyment.

Resorts at Chester River Manor excels in sub-acute rehabilitation, offering personalized treatment plans to support residents in building healthier lives and ensuring successful transitions back to everyday life. For those requiring extended care, the long-term care program provides unparalleled healthcare options tailored to meet diverse needs. Respite services are also available, offering short-term stays that provide caregivers with much-needed breaks or opportunities for senior living trials. With a flexible calendar of stimulating activities, residents have opportunities to engage in meaningful programs that support their emotional, intellectual, physical, social, and spiritual well-being.

(410) 778-4550

Quality ratings

Measured by Centers for Medicare & Medicaid Services (CMS)

Overall rating Info Official CMS rating based on health inspections, staffing and quality measures.
3/5
Maryland average: 3.0/5
Health Inspection Info Official CMS rating based on deficiencies found during state health inspections.
4/5
Maryland average: 2.8/5
Staffing Info Official CMS rating based on nurse staffing hours per resident per day.
1/5
Maryland average: 3.0/5
Quality Measures Info Official CMS rating based on clinical outcomes for residents.
2/5
Maryland average: 3.7/5

Staffing hours breakdown

Info Hours of care per resident per day, broken down by staff type. Data from CMS Medicare.
Staff type Facility State avg National avg
Registered Nurse (RN) Info Registered nurse hours per resident per day. 38m per day 50m per day 41m per day
LPN / LVN Info Licensed Practical Nurse / Licensed Vocational Nurse hours per resident per day. 42m per day 54m per day 52m per day
Nurse Aide Info Nurse aide hours per resident per day. 2h 17m per day 2h 10m per day 2h 21m per day
Total Nursing (Weekend) Info Total number of nurse staff hours per resident per day on weekends. 3h 29m per day 3h 29m per day 3h 26m per day
Physical Therapist Info Physical therapist staff hours per resident per day. 2m per day 5m per day 4m per day
RN (Weekend) Info Registered nurse hours per resident per day on weekends. 33m per day 37m per day 29m per day

Capacity and availability

Smaller home

May offer a more intimate, personalized care environment.

Total beds 98

This home usually has limited availability

Occupancy is moderate, suggesting balanced demand.

Similar demand to the Maryland average
Occupancy rate 94.4%
Residents per day (avg) 94
Occupancy rate
94.4%
Residents per day (avg)
94

Who this home usually serves

TYPE OF STAY

Mostly short-term rehab stays

Most residents typically stay for a few weeks or months before returning home or moving on.

Might be optimal for
Short stays Recovery Medicare-covered care

Breakdown by payment type

Medicare

54% of new residents, usually for short-term rehab.

Typical stay 1 - 2 months

Private pay

38% of new residents, often for short stays.

Typical stay 1 months

Medicaid

8% of new residents, often for long-term daily care.

Typical stay 4 - 5 years

Finances and operations

Proprietary home
Corporation
Home revenue
$12.9M
Operating loss
-$101.5K
Proprietary home Corporation
Home revenue
$12,864,796.00
Operating loss
$-101,530.00
Payroll costs Info The portion of the home's budget spent on staff, including nurses, caregivers, and other employees who support care and operations.
$4.4M
33.9% of revenue
Other operating costs Info All remaining costs needed to run the home, such as food, utilities, building maintenance, supplies and administrative expenses.
$8.6M
Total costs $13.0M

What does this home offer?

Accepts Medicaid icon

Accept Medicaid: Yes

Total residents icon

Total Residents: 98

Housing options icon

Housing Options: Private / Semi-Private Rooms

Building type icon
Building type icon

Building Type: Single-story

Types of Care at Resorts at Chester River Manor

Nursing Care Respite Care

Compare Assisted Living around Usa

The information below is reported by the Maryland Department of Health, Office of Health Care Quality.
Job Haines Home
AL

Assisted Living For seniors needing help with daily tasks but not full-time nursing.

HC

Home Care

HC

Hospice Care

SNF

Nursing Homes 24/7 care needed

Bloomfield
40
No
85
HAVERON, NOREEN
45.5%
$13,340,016.00
$10,214,151.00
76.6%
36.90
5/5
6.3081
5/5
5/5
4/5
4
-
-21%
+63%
-41%
Studio / 1 Bed / Private / Semi-Private Rooms
Resorts at Chester River Manor
SNF

Nursing Homes 24/7 care needed

Chestertown
98
No
53
SEITZ, STEWART
94.4%
$12,795,540.00
$4,360,315.00
34.1%
93.90
3/5
-
4/5
1/5
2/5
30
1
-17%
-
+15%
Private / Semi-Private Rooms
Village Veranda at Lady Lake
AL

Assisted Living For seniors needing help with daily tasks but not full-time nursing.

IL

Independent Living For self-sufficient seniors seeking community and minimal assistance.

MC

Memory Care Specialized care for those with Memory Loss, Alzheimer's, or dementia, ensuring safety and support.

SNF

Nursing Homes 24/7 care needed

Lady Lake
145
Yes
25
-
-
-
-
-
-
-
-
-
-
-
-
-
-
-
-
Private / Semi-Private Rooms
The Canopy at Hickory Creek
AL

Assisted Living For seniors needing help with daily tasks but not full-time nursing.

IL

Independent Living For self-sufficient seniors seeking community and minimal assistance.

MC

Memory Care Specialized care for those with Memory Loss, Alzheimer's, or dementia, ensuring safety and support.

SNF

Nursing Homes 24/7 care needed

Titusville
72
Yes
38
Hickory Creek Operations, LLC
-
-
-
-
-
-
-
-
-
-
-
-
-
-
-
Private / Semi-Private Rooms
Amani Place AFH III
AL

Assisted Living For seniors needing help with daily tasks but not full-time nursing.

HC

Hospice Care

MC

Memory Care Specialized care for those with Memory Loss, Alzheimer's, or dementia, ensuring safety and support.

SNF

Nursing Homes 24/7 care needed

Spokane Valley
-
No
1
-
-
-
-
-
-
-
-
-
-
-
-
-
-
-
-
Private / Semi-Private Rooms

Places of interest near Resorts at Chester River Manor

Address 0.7 miles from city center — 0.47 miles to nearest hospital (DaVita Chestertown Dialysis Center)

Address 200 Morgnec Rd, Chestertown, MD 21620

Calculate Travel Distance to Resorts at Chester River Manor

Add your location

Address

Staffing Data

Source: CMS Payroll-Based Journal (Q2 2025)

82
Total Staff
53
Employees
29
Contractors
36,767
Total Hours (Quarter)
44
Avg Staff/Day
9.2
Avg Shift (hrs)
Nursing Staff Breakdown
Role Count Avg Shift (hrs) Uses Contractors?
Registered Nurse910.3 Yes
Licensed Practical Nurse99.9 No
Certified Nursing Assistant409.6 Yes
Staff by Category
Administration
2 staff
7.2hs shift avg
Nursing Staff
58 staff
9.8hs shift avg
Physicians & Practitioners
4 staff
8.4hs shift avg
Therapy Services
9 staff
7.4hs shift avg
Activities & Recreation
0 staff
0hs shift avg
Social Services
3 staff
7.8hs shift avg
Dietary Services
4 staff
7hs shift avg
Other Services
2 staff
7.6hs shift avg
Contractor Analysis
39.5%
of total hours from contractors
14,540 contractor hours this quarter
Registered Nurse: 1 Certified Nursing Assistant: 14 Administrator: 1 Speech Language Pathologist: 2 Physical Therapy Aide: 2 Qualified Social Worker: 3 Occupational Therapy Aide: 1 Respiratory Therapy Technician: 2 Physical Therapy Assistant: 1 Medical Director: 1 Occupational Therapy Assistant: 1
Role Employees Contractors Total Staff Total Hours Days Worked % of Days Avg Shift (hrs)
Certified Nursing Assistant26144019,55591100%9.6
Licensed Practical Nurse9095,87491100%9.9
Registered Nurse8194,18991100%10.3
Other Dietary Services Staff3031,06591100%7
Physical Therapy Aide0229486673%8.1
Mental Health Service Worker2028156470%7.6
Physical Therapy Assistant0117286369%11.5
Clinical Nurse Specialist3036887178%8.7
Administrator0115206571%8
Nurse Practitioner1014886167%8
Speech Language Pathologist0224845662%7.6
Dietitian1014756875%7
Occupational Therapy Aide0113138290%3.8
Respiratory Therapy Technician0222614044%6.4
Qualified Social Worker0332493235%7.8
Medical Director011691719%4
Occupational Therapy Assistant0115078%7.1

Health Inspection History

Inspections
Total health inspections 4

Maryland average 3.9


Last Health inspection on Mar 2024

Total health citations 30
Citations per inspection
7.5

Health citations are formal notices following inspections when they fail to comply with safety and care standards.

29 of 30 citations resulted from standard inspections; and 1 of 30 resulted from complaint investigations.

Breakdown of citation severity (last 3 years)
Critical Health citations More info 0
100% better than Maryland average

Maryland average: 0.5


Serious Health citations More info 1
67% worse than Maryland average

Maryland average: 0.6

0 critical citations More info Maryland average: 0.5

1 serious citation More info Maryland average: 0.6

29 moderate citations More info Maryland average: 47.2

0 minor citations More info Maryland average: 1.7
Citations history (last 3 years)
Abuse/Neglect moderate citation Mar 08, 2024
Corrected

Infection Control moderate citation Mar 08, 2024
Corrected

Infection Control moderate citation Mar 08, 2024
Corrected

Nursing Services moderate citation Mar 08, 2024
Corrected

Facility Characteristics

Source: CMS Long-Term Care Facility Characteristics (Data as of Jan 2026)

Ownership: For-Profit Corporation
Resident Census by Payment Source
87 Total Residents
Medicare 14 (16.1%)
Medicaid 66 (75.9%)
Private Pay/Other 7 (8%)
Programs & Services
Residents' Group
Family Engagement

Active councils help families stay involved in care decisions and facility operations.

Quality of care over time

These measures show how residents usually do over time at this home, based on health outcomes and preventive care.

High-risk clinical events score Info A composite score based on pressure ulcers, falls with injury, weight loss, walking ability decline, and activities of daily living decline. 15.3
18% worse than Maryland average

Maryland average: 12.9

Functional decline score Info A composite score based on activities of daily living decline, walking ability decline, and incontinence. 30.3
18% worse than Maryland average

Maryland average: 25.7

Long-stay resident measures
Need for Help with Daily Activities Increased Info Percent of long-stay residents whose need for help with daily activities has increased 30.4%
28% worse than Maryland average

Maryland average: 23.7%

Walking Ability Worsened Info Percent of long-stay residents whose ability to move independently worsened 33.7%
22% worse than Maryland average

Maryland average: 27.7%

Low Risk Residents with Bowel/Bladder Incontinence Info Percent of low risk long-stay residents who lose control of their bowels or bladder 26.8%
In line with Maryland average

Maryland average: 25.9%

Falls with Major Injury Info Percent of long-stay residents experiencing one or more falls with major injury 3.9%
70% worse than Maryland average

Maryland average: 2.3%

High Risk Residents with Pressure Ulcers Info Percent of long-stay high risk residents with pressure ulcers 4.8%
26% better than Maryland average

Maryland average: 6.5%

Urinary Tract Infection Info Percent of long-stay residents with a urinary tract infection 0.0%
100% better than Maryland average

Maryland average: 1.6%

Lost Too Much Weight Info Percent of long-stay residents who lose too much weight 3.5%
40% better than Maryland average

Maryland average: 5.8%

Depressive Symptoms Info Percent of long-stay residents who have depressive symptoms 25.1%
24% worse than Maryland average

Maryland average: 20.2%

Antipsychotic Use Info Percent of long-stay residents who received an antipsychotic medication 32.7%
153% worse than Maryland average

Maryland average: 12.9%

Pneumococcal Vaccine Info Percent of long-stay residents assessed and appropriately given the pneumococcal vaccine 100.0%
9% better than Maryland average

Maryland average: 92.0%

Influenza Vaccine Info Percent of long-stay residents assessed and appropriately given the seasonal influenza vaccine 100.0%
In line with Maryland average

Maryland average: 96.6%

Hospitalizations per 1,000 days Info Number of hospitalizations per 1,000 long-stay resident days. 0.31
77% better than Maryland average

Maryland average: 1.32

ED visits per 1,000 days Info Number of outpatient emergency department visits per 1,000 long-stay resident days. 1.38
14% worse than Maryland average

Maryland average: 1.21

Short-stay resident measures
Pneumococcal Vaccine Info Percent of short-stay residents assessed and appropriately given the pneumococcal vaccine 98.9%
26% better than Maryland average

Maryland average: 78.4%

Antipsychotic medication increase Info Percent of short-stay residents who newly received an antipsychotic medication 1.9%
33% worse than Maryland average

Maryland average: 1.4%

Influenza Vaccine Info Percent of short-stay residents assessed and appropriately given the seasonal influenza vaccine 98.0%
22% better than Maryland average

Maryland average: 80.6%

Re-hospitalized after SNF stay Info Percentage of short-stay residents who were re-hospitalized after their nursing home admission. 18.6%
12% better than Maryland average

Maryland average: 21.2%

Emergency department visits Info Percentage of short-stay residents who had an outpatient emergency department visit. 17.2%
74% worse than Maryland average

Maryland average: 9.9%

Falls with major injury Info Percentage of SNF residents who experience falls with major injury during their stay. 1.6%
112% worse than Maryland average

Maryland average: 0.8%

Ability to care for self at discharge Info Percentage of residents at or above expected ability to care for themselves at discharge. 51.6%
In line with Maryland average

Maryland average: 53.7%

Successful return to home or community Info Rate of successful return to home or community from a skilled nursing facility. 49.7%
In line with Maryland average

Maryland average: 50.6%

Guides for Better Senior Living

Care Cost Calculator: See Prices in Your Area

Nursing Home Data Explorer

Don’t Wait Too Long: 7 Red Flag Signs Your Parent Needs Assisted Living Now

The True Cost of Assisted Living in 2025 – And How Families Are Paying For It

Understanding Senior Living Costs: Pricing Models, Discounts & Financial Assistance

Financial Aid for Maryland Seniors

Get financial aid guidance

Community Options Waiver

Maryland Medicaid Community Options Waiver

Age 65+ or disabled, Maryland resident, Medicaid- eligible, nursing home-level care need.

~$2,829/month (300% FBR, individual).

$2,000 (individual), $3,000 (couple) (excludes home, car).

High urban demand; rural outreach efforts.

Senior Care Program

Maryland Senior Care

Age 65+, Maryland resident, at risk of nursing home placement.

~$2,000/month (individual, varies by county).

$11,000 (individual).

Limited funding; waitlists common in high-demand areas.

Maryland Nursing Home Medicaid

Maryland Medical Assistance (Medicaid) Nursing Home Program

Age 65+, Maryland resident, Medicaid-eligible, requires nursing home-level care.

$943/month (individual); most income applied to care costs.

$2,500 (individual), $3,000 (couple); spousal protections up to $155,356.

Home equity limit $636,000; estate recovery applies post-55.

Senior Assisted Living Subsidy Program

Maryland Senior Assisted Living Group Home Subsidy

Age 62+, Maryland resident, in or moving to approved assisted living, low/moderate income.

~$34,000/year (individual, varies by county).

Not strict; prioritizes low-income.

Not available statewide; facility must be licensed by MDH.

Veterans Aid and Attendance (A&A) Benefit

Maryland VA Aid and Attendance

Wartime veteran/spouse, age 65+ or disabled, needs ADL help, Maryland resident.

Net income minus medical expenses < $1,984/month (individual with A&A).

$155,356 (net worth limit).

High veteran population in suburban/rural areas.

Senior Prescription Drug Assistance Program (SPDAP)

Maryland Senior Prescription Drug Assistance Program

Age 65+, Maryland resident (6+ months), Medicare Part D enrolled.

$48,560/year (individual, 300% FPL).

None specified.

Supplements Medicare Part D; annual enrollment required.

Medicare Savings Programs (MSP)

Maryland Medicare Savings Programs

Age 65+, Maryland resident, Medicare Part A/B enrollee.

$2,014/month (QMB), $2,706/month (SLMB/QI, individual).

$9,090 (individual), $13,630 (couple).

Includes QMB, SLMB, QI categories.

Community Personal Assistance Services (CPAS)

Maryland Medicaid Community Personal Assistance Services

Age 65+, Maryland resident, Medicaid-eligible, needs ADL assistance.

$943/month (individual); spend-down available.

$2,500 (individual), $3,000 (couple).

Consumer-directed option allows hiring family caregivers.

Who we are

Your Senior Care Partner, Every Step of the Way

We help families find affordable senior communities and unlock same day discounts, Medicaid, and Medicare options tailored to your needs.

Contact us Today