Resorts at Chester River Manor
Nursing Home & Respite Care · Chestertown, MD
CMS overall rating Info CMS (the Centers for Medicare & Medicaid Services) is the federal agency that rates nursing home quality. Its Overall Rating runs from 1 to 5 stars, combining health inspections, staffing, and quality measures, with inspections weighted most heavily.

Resorts at Chester River Manor

Nursing Home & Respite Care · Chestertown, MD
CMS overall rating Info CMS (the Centers for Medicare & Medicaid Services) is the federal agency that rates nursing home quality. Its Overall Rating runs from 1 to 5 stars, combining health inspections, staffing, and quality measures, with inspections weighted most heavily.
Calculator: See prices in your area
Resorts at Chester River Manor accepts Medicare, Medicaid, and private pay.

Overview of Resorts at Chester River Manor

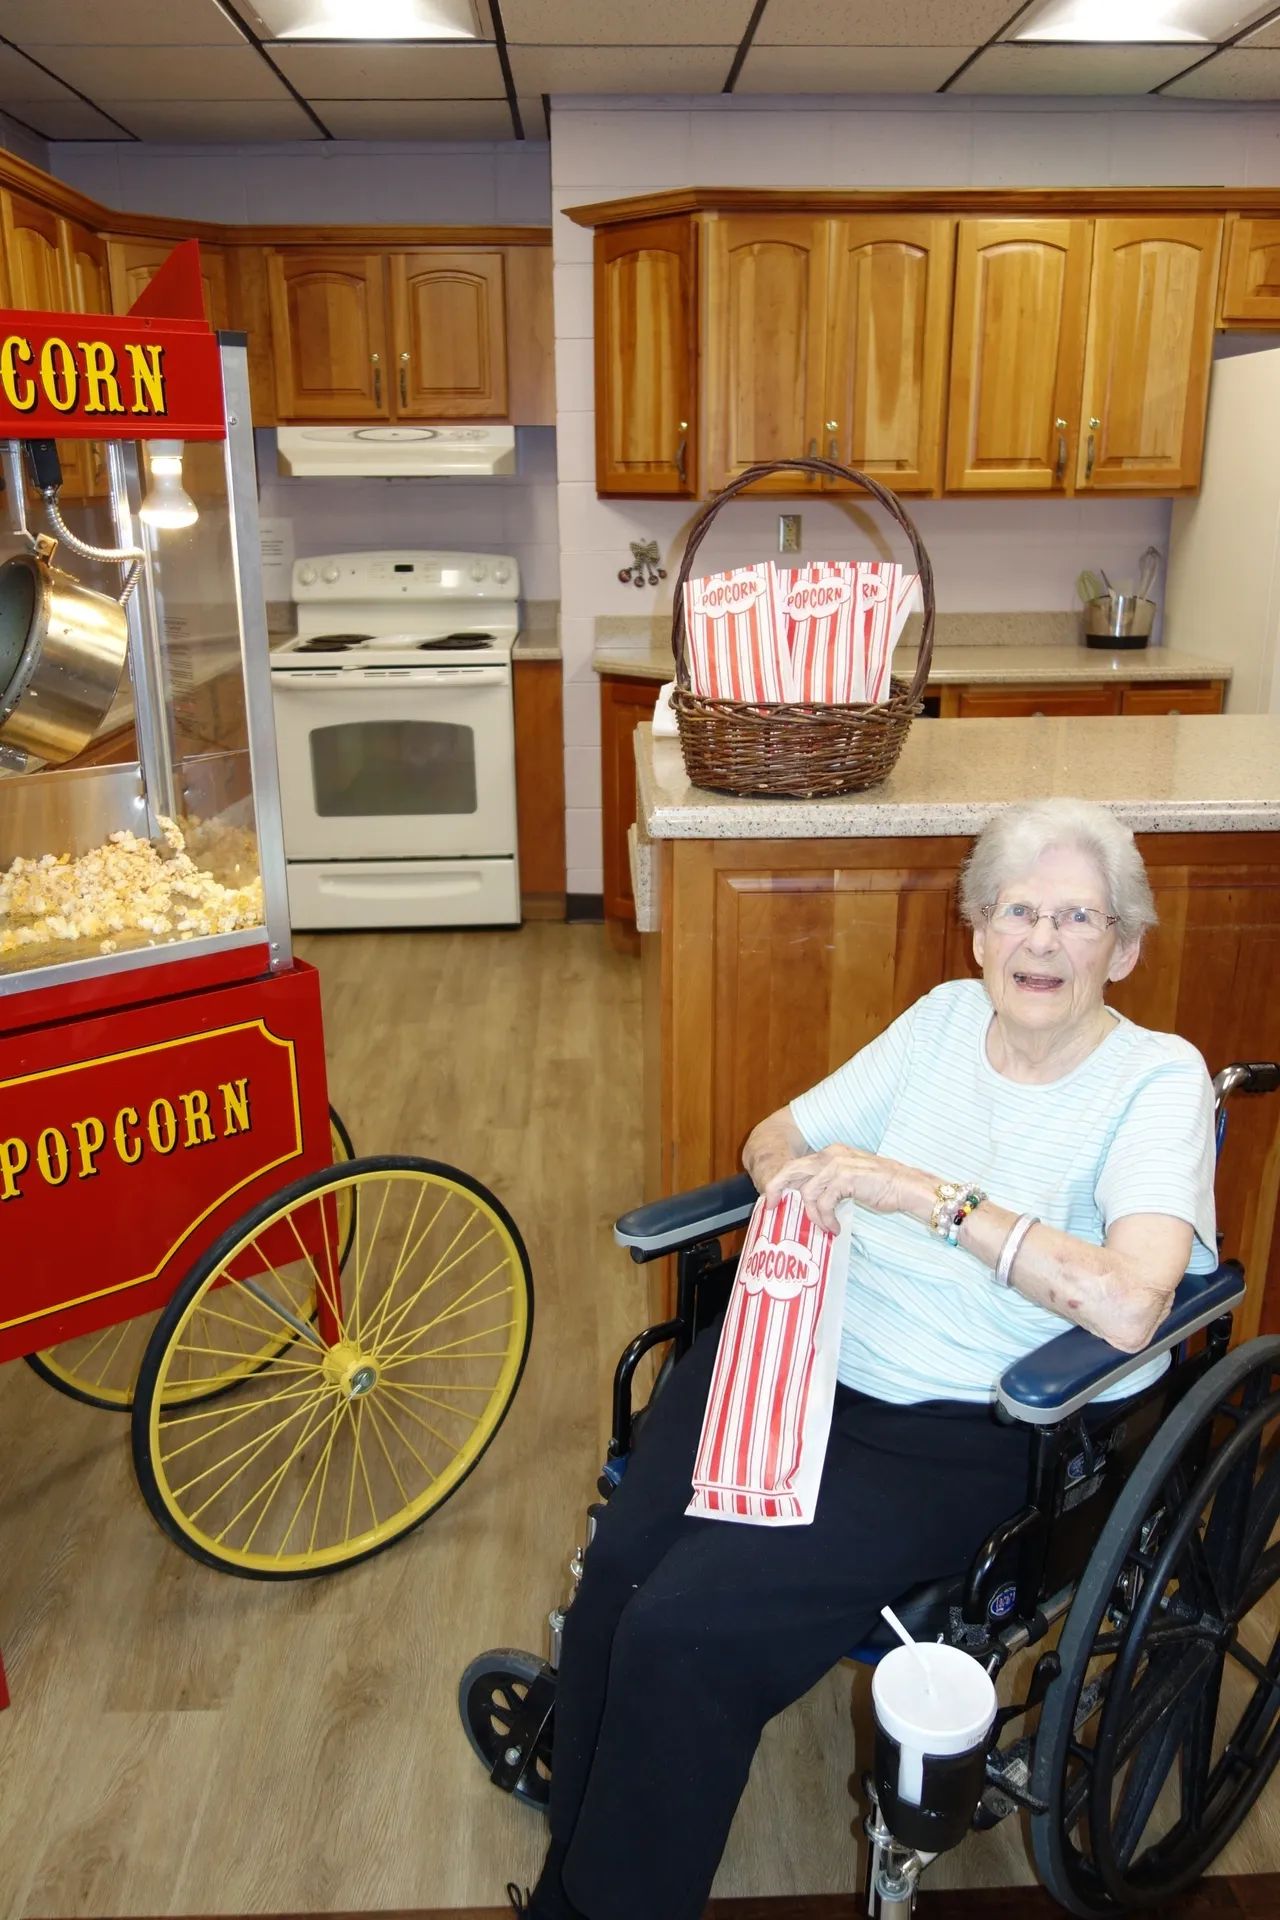
Hidden in scenic Kent County, Resorts at Chester River Manor is a family-owned community dedicated to providing outstanding rehabilitative services, long-term care, respite, and hospice services. Committed to delivering superior care and quicker recoveries, Resorts at Chester River Manor ensures that every resident receives the treatment they need and the service they deserve. With a partnership with Tender Touch for therapy services and a full recreation program, every stay is marked by superior comfort and enjoyment.

Resorts at Chester River Manor excels in sub-acute rehabilitation, offering personalized treatment plans to support residents in building healthier lives and ensuring successful transitions back to everyday life. For those requiring extended care, the long-term care program provides unparalleled healthcare options tailored to meet diverse needs. Respite services are also available, offering short-term stays that provide caregivers with much-needed breaks or opportunities for senior living trials. With a flexible calendar of stimulating activities, residents have opportunities to engage in meaningful programs that support their emotional, intellectual, physical, social, and spiritual well-being.

Quality ratings

Measured by Centers for Medicare & Medicaid Services (CMS)

Overall rating Info The Overall CMS Rating combines results from health inspections, staffing levels and quality measures. Health inspections carry the most weight. Staffing and quality scores can increase or decrease the final rating based on performance compared to state and national standards.
Health Inspection Info Based on the results of the facility's three most recent standard inspections and any complaint investigations. CMS reviews the number, scope, and severity of deficiencies, with more recent findings weighted more heavily.
Staffing Info Measures average nursing staff hours per resident per day, including Registered Nurses (RNs) and total nursing staff. Ratings are adjusted based on the level of care residents require and are compared to state and national benchmarks.
Quality Measures Info Based on clinical and physical health indicators reported to CMS, such as hospital readmissions, falls, pressure ulcers, and improvements in mobility. These measures reflect how well residents' health needs are being managed.

Staffing hours breakdown

Info Daily nursing hours per resident by staff type, reported to CMS. Higher is generally better — compare this facility to state and national averages to see where staffing stands.

Hours per resident per day — compared to state averages

Staff typeHours / Day / Residentvs state avg
Registered Nurse (RN) Info RNs hold the highest nursing license and can assess residents, interpret test results, and direct care plans. More RN hours per day often signals stronger clinical oversight and faster response to health changes. 38m per day ▼ 23% State avg: 50m per day · National avg: 41m per day
LPN / LVN Info Licensed Practical Nurses (LPNs) or Licensed Vocational Nurses (LVNs) deliver routine hands-on care — medication administration, wound dressing, and monitoring vital signs. They work under RN supervision and make up a large share of daily bedside care. 41m per day ▼ 24% State avg: 54m per day · National avg: 52m per day
Nurse Aide Info Certified Nurse Aides (CNAs) provide the most direct day-to-day assistance: bathing, dressing, feeding, and mobility. Nurse aide hours are typically the largest staffing category and directly affect residents' quality of life. 2h 16m per day ▲ 5% State avg: 2h 10m per day · National avg: 2h 21m per day
Weekend Total Nursing Info Combined nursing hours (RN + LPN + Nurse Aide) per resident per day on weekends. Staffing often drops on weekends — this figure reveals whether the facility maintains adequate coverage outside of weekday hours. 3h 28m per day ■ Avg State avg: 3h 29m per day · National avg: 3h 26m per day
Physical Therapist Info Hours per resident per day provided by licensed Physical Therapists (PTs) or PT Assistants. PT services help residents recover mobility after injury or illness and are especially important for post-acute (short-stay) rehabilitation. 2m per day ▼ 65% State avg: 5m per day · National avg: 4m per day
Weekend RN Info Registered nurse hours specifically on weekends. Facilities sometimes reduce RN presence on Saturdays and Sundays — a low weekend RN figure compared to weekday hours can indicate reduced clinical oversight when most administrative staff are absent. 30m per day ▼ 19% State avg: 37m per day · National avg: 29m per day

Capacity and availability

This home usually has limited availability

Similar occupancy to the state average
Occupancy rate
94.4%
Avg. Length of Stay
180 days
Bed community size
98-bed community Rank #135 / 697Bed count — State benchmarkedThis home is ranked 135th out of 697 homes in Maryland. Shows this facility's certified or reported bed count compared to other Maryland facilities. Larger communities may offer more amenities, programs, and on-site services for residents and families.Rankings are based only on facilities in Maryland that report data for that category. Facilities without available data are excluded from the ranking.Click the rank badge to see the full State ranking.Click here to see the full State ranking.
A larger shared setting that may offer more common spaces and organized community services.
Walk Score
Walk Score: 53 / 100 Rank #393 / 985Walk Score — State benchmarkedThis home is ranked 393rd out of 985 homes in Maryland. Shows how walkable this facility's neighborhood is compared to the average Walk Score across Maryland facilities. Higher scores benefit residents, families, and staff.Rankings are based only on facilities in Maryland that report data for that category. Facilities without available data are excluded from the ranking.Click the rank badge to see the full State ranking.Click here to see the full State ranking.
Moderately walkable. Some errands can be accomplished on foot, with a mix of nearby amenities.

Payment & Insurance

2 services
Accept Medicaid
Accept Medicare

Therapy & Rehabilitation

3 services
Rehabilitation Services
Respite Care
Short-Term Rehab

Staffing & Medical

1 service
24-Hour Staffing

Amenities & Lifestyle

Private & Semi-Private Accommodations
Comprehensive Therapeutic Recreation Program
Nutritious Meals & Snacks
Beautician Services
Phone Services
Laundry Services
Religious Services
24-Hour Skilled Nursing Care
Psychology
Psychiatry/Psychotherapy Services
Diabetic Management
Podiatry Services
Dental Services
Optometry Services
Radiology
Diagnostic Lab Work
Specific ProgramsSub Acute Rehabilitation, Respite Services & Short Term Stays
Religious Services
Operating Hours24 hours a day, 7 days a week

Contact Resorts at Chester River Manor

Staffing Data

Reporting period: October 1 – December 31, 2025 (Q4 2025). Source: CMS Payroll-Based Journal report.

Total staff 83
Employees 53
Contractors 30
Staff to resident ratio 0.95 : 1
0% compared with State average

State average ratio: 0 : 0

Avg staff/day 44
Average shift 9.3 hours
0% compared with State average

State average: 0 hours

Total staff hours (quarter) 37,646

Nursing staff breakdown

Q4 2025 · Oct 1 – Dec 31 More info This data comes from the CMS Payroll-Based Journal report covering October 1 – December 31, 2025.
Registered Nurse

Manages medical care and health needs.

RN Staff Info 10 total: 9 full-time employees and 1 contractor. 10
Average shift length Info Average shift length. Calculated as total hours divided by days worked and average staff per day. 10 hours
Licensed Practical Nurse

Assists with medical care and medications.

LPN Staff Info All 10 LPN Staff are full-time employees. No contractors work on this role. 10
Average shift length Info Average shift length. Calculated as total hours divided by days worked and average staff per day. 10 hours
Certified Nursing Assistant

Helps with daily care and mobility.

CNA Staff Info 35 total: 23 full-time employees and 12 contractors. 35
Average shift length Info Average shift length. Calculated as total hours divided by days worked and average staff per day. 10 hours

Contractor staffing

Q4 2025 · Oct 1 – Dec 31 More info This data comes from the CMS Payroll-Based Journal report covering October 1 – December 31, 2025.

Total hours from contractors

38.1%

14,329 contractor hours this quarter

Certified Nursing Assistant: 12 Speech Language Pathologist: 3 Physical Therapy Aide: 3 Physical Therapy Assistant: 3 Respiratory Therapy Technician: 2 Qualified Social Worker: 2 Registered Nurse: 1 Administrator: 1 Occupational Therapy Aide: 1 Medical Director: 1 Occupational Therapy Assistant: 1

Staff by category

Q4 2025 · Oct 1 – Dec 31 More info This data comes from the CMS Payroll-Based Journal report covering October 1 – December 31, 2025.
Certified Nursing Assistant23123520,02292100%10
Licensed Practical Nurse100106,01792100%10
Registered Nurse91104,63492100%10
Other Dietary Services Staff4041,0958491%6.9
Physical Therapy Aide0339876672%8.2
Administrator1129686672%8
Clinical Nurse Specialist2026257784%8
Mental Health Service Worker2025216166%7.1
Physical Therapy Assistant0335034751%10.5
Dietitian1014966470%7.8
Speech Language Pathologist0334735257%7.7
Nurse Practitioner1013924953%8
Occupational Therapy Aide0113278896%3.7
Respiratory Therapy Technician0222584549%5.7
Qualified Social Worker0221962729%7.3
Medical Director011861820%4.8
Occupational Therapy Assistant0114867%8
35 Certified Nursing Assistant
% of Days 100%
10 Licensed Practical Nurse
% of Days 100%
10 Registered Nurse
% of Days 100%
4 Other Dietary Services Staff
% of Days 91%
3 Physical Therapy Aide
% of Days 72%
2 Administrator
% of Days 72%
2 Clinical Nurse Specialist
% of Days 84%
2 Mental Health Service Worker
% of Days 66%
3 Physical Therapy Assistant
% of Days 51%
1 Dietitian
% of Days 70%
3 Speech Language Pathologist
% of Days 57%
1 Nurse Practitioner
% of Days 53%
1 Occupational Therapy Aide
% of Days 96%
2 Respiratory Therapy Technician
% of Days 49%
2 Qualified Social Worker
% of Days 29%
1 Medical Director
% of Days 20%
1 Occupational Therapy Assistant
% of Days 7%

Penalties and fines

Federal penalties imposed by CMS for regulatory violations, including civil money penalties (fines) and denials of payment for new Medicare/Medicaid admissions.

Source: CMS Penalties Database

No penalties in the past 3 years

No civil money penalties or payment denials were reported in the last 3 years.

Quality of care over time

These measures show how residents usually do over time at this home, based on health outcomes and preventive care.

High-risk clinical events score Info A composite score based on pressure ulcers, falls with injury, weight loss, walking ability decline, and activities of daily living decline. 15.3
18% worse than State average

State average: 12.9

Functional decline score Info A composite score based on activities of daily living decline, walking ability decline, and incontinence. 30.3
18% worse than State average

State average: 25.7

Long-stay resident measures
Above average State avg: 3.7 Info CMS star rating based on long-stay quality measure performance. 5 stars = significantly above average, 1 star = significantly below average.
Need for Help with Daily Activities Increased Info Percent of long-stay residents whose need for help with daily activities has increased 30.4%
28% worse than State average

State average: 23.7%

Walking Ability Worsened Info Percent of long-stay residents whose ability to move independently worsened 33.7%
22% worse than State average

State average: 27.7%

Low Risk Residents with Bowel/Bladder Incontinence Info Percent of low risk long-stay residents who lose control of their bowels or bladder 26.8%
In line with State average

State average: 25.9%

Falls with Major Injury Info Percent of long-stay residents experiencing one or more falls with major injury 3.9%
70% worse than State average

State average: 2.3%

High Risk Residents with Pressure Ulcers Info Percent of long-stay high risk residents with pressure ulcers 4.8%
26% better than State average

State average: 6.5%

Urinary Tract Infection Info Percent of long-stay residents with a urinary tract infection 0.0%
100% better than State average

State average: 1.6%

Lost Too Much Weight Info Percent of long-stay residents who lose too much weight 3.5%
40% better than State average

State average: 5.8%

Depressive Symptoms Info Percent of long-stay residents who have depressive symptoms 25.1%
24% worse than State average

State average: 20.2%

Antipsychotic Use Info Percent of long-stay residents who received an antipsychotic medication 32.7%
153% worse than State average

State average: 12.9%

Pneumococcal Vaccine Info Percent of long-stay residents assessed and appropriately given the pneumococcal vaccine 100.0%
9% better than State average

State average: 92.0%

Influenza Vaccine Info Percent of long-stay residents assessed and appropriately given the seasonal influenza vaccine 100.0%
In line with State average

State average: 96.6%

Hospitalizations per 1,000 days Info Number of hospitalizations per 1,000 long-stay resident days. 0.31
77% better than State average

State average: 1.32

ED visits per 1,000 days Info Number of outpatient emergency department visits per 1,000 long-stay resident days. 1.38
14% worse than State average

State average: 1.21

Short-stay resident measures
Average State avg: 3.7 Info CMS star rating based on short-stay quality measure performance. 5 stars = much above average, 1 star = much below average.
Pneumococcal Vaccine Info Percent of short-stay residents assessed and appropriately given the pneumococcal vaccine 98.9%
26% better than State average

State average: 78.4%

Antipsychotic medication increase Info Percent of short-stay residents who newly received an antipsychotic medication 1.9%
33% worse than State average

State average: 1.4%

Influenza Vaccine Info Percent of short-stay residents assessed and appropriately given the seasonal influenza vaccine 98.0%
22% better than State average

State average: 80.6%

Re-hospitalized after SNF stay Info Percentage of short-stay residents who were re-hospitalized after their nursing home admission. 18.6%
12% better than State average

State average: 21.2%

Emergency department visits Info Percentage of short-stay residents who had an outpatient emergency department visit. 17.2%
74% worse than State average

State average: 9.9%

Falls with major injury Info Percentage of SNF residents who experience falls with major injury during their stay. 1.6%
112% worse than State average

State average: 0.8%

Ability to care for self at discharge Info Percentage of residents at or above expected ability to care for themselves at discharge. 51.6%
In line with State average

State average: 53.7%

Successful return to home or community Info Rate of successful return to home or community from a skilled nursing facility. 49.7%
In line with State average

State average: 50.6%

Breakdown by payment type

Medicare

54% of new residents, usually for short-term rehab.

Typical stay 1 - 2 months

Private pay

38% of new residents, often for short stays.

Typical stay 1 months

Medicaid

8% of new residents, often for long-term daily care.

Typical stay 4 - 5 years

Facility Characteristics

Source: CMS Long-Term Care Facility Characteristics (Data as of Jan 2026)

Total residents 87
Medicare
14
16.1% of residents
Medicaid
66
75.9% of residents
Private pay or other
7
8% of residents
Programs & Services
Residents Group

Residents meet regularly to discuss policies, care quality, and activities

Active Resident Council

Organized group of residents that meets regularly to discuss facility policies, quality of life, and activities.

Finances and operations

Based on CMS SNF Cost Report for fiscal year ending in 12/2023.

For-profit
Corporation
Net patient revenue Info Net patient revenue — what the home actually collects for resident care, after contractual allowances, bad debt and discounts are subtracted from its gross charges (CMS cost report, Worksheet G-3). It covers resident care only; money the home earns from other sources is shown separately as "Other income."
$12.2M
Net patient income Info Net patient income: net patient revenue minus the home's total operating expenses. A positive figure means it earns more from resident care than it spends to deliver it; a negative figure means the opposite. It excludes non-operating "other income."
-$170.8K
For-profit Corporation
Net patient revenue Info Net patient revenue — what the home actually collects for resident care, after contractual allowances, bad debt and discounts are subtracted from its gross charges (CMS cost report, Worksheet G-3). It covers resident care only; money the home earns from other sources is shown separately as "Other income."
$12.2M
Net patient income Info Net patient income: net patient revenue minus the home's total operating expenses. A positive figure means it earns more from resident care than it spends to deliver it; a negative figure means the opposite. It excludes non-operating "other income."
-$170.8K
Other income Info Money the home earns outside of resident care — such as investments, grants, rentals and other non-operating sources (CMS cost report, Worksheet G-3). It is tracked separately from net patient revenue: it is not part of that figure, and it is not included in net patient income.
$69.3K
Payroll costs Info Staff salaries plus wage-related costs — benefits such as payroll taxes, health insurance and retirement — from the home's own accounting records (CMS cost report, Worksheet A). Contract or agency labor is counted separately, under other operating costs.
$4.9M 39.8% of net patient revenue Info Payroll as a share of revenue: staff salaries and wage-related benefits divided by net patient revenue. A higher figure means more of each revenue dollar goes to staff pay.
Other operating costs Info Everything it costs to run the home apart from payroll — food, utilities, supplies, maintenance, contract labor and administration. Calculated as total operating expense minus payroll (staff salaries and wage-related benefits).
$7.5M
Total costs Info The home's total operating expense for the year — all the costs of running it, salaries included (CMS cost report, Worksheet G-3).
$12.4M

What does this home offer?

Housing options icon

Housing Options: Private / Semi-Private Rooms

Building type icon
Building type icon

Building Type: Single-story

Who this home usually serves

TYPE OF STAY

Mostly short-term rehab stays

Most residents typically stay for a few weeks or months before returning home or moving on.

Most new residents arrive under Medicare (54% of admissions), and a typical Medicare stay runs around 1 - 2 months.

Admissions
193 total

Coverage residents most often arrive under.

Medicare 54%
Private pay 38%
Medicaid 8%
Discharges
188 total

Coverage residents most often leave under.

Medicare 46%
Private pay 30%
Medicaid 24%

Places of interest near Resorts at Chester River Manor

Address 0.7 miles from city center Info Estimated distance in miles from Chestertown's city center to Resorts at Chester River Manor's address, calculated via Google Maps.

Calculate Travel Distance to Resorts at Chester River Manor

Add your location

Address

Compare Nursing Homes around the area

The information below is reported by the Maryland Department of Health, Office of Health Care Quality.

Resorts at Chester River Manor
NH
RC
Chestertown (Morgnec Road) -98 - 53 Private / Semi-Private Rooms
Ginger Cove
NH
AL
HC
IL
MC
Annapolis (River Crescent Drive) -96 A+ 51 1 Bed / 2 Bed
Bedford Court, a CCRC
NH
AL
HC
IL
MC
RC
Silver Spring (International Drive) -76 - 64 Studio / 1 Bed
Lutheran Village at Miller’s Grant
NH
AL
IL
Ellicott City (Lutheran Village At Miller’s Grant) -36 - 19 1 Bed / 2 Bed
Maplewood Park Place
NH
AL
IL
MC
Bethesda (Pooks Hill) -29 - 38 1 Bed / 2 Bed

Frequently Asked Questions about Resorts at Chester River Manor

What neighborhood is Resorts at Chester River Manor in?

Resorts at Chester River Manor is in the Morgnec Road neighborhood.

Is Resorts at Chester River Manor in a walkable area?

Resorts at Chester River Manor has a walk score of 53. Moderately walkable. Some errands can be accomplished on foot, with a mix of nearby amenities.

What is the occupancy rate at Resorts at Chester River Manor?

Resorts at Chester River Manor's occupancy is 94.4%.

Does Resorts at Chester River Manor operate as a for-profit or non-profit?

Resorts at Chester River Manor is registered as a for-profit.

Are there photos of Resorts at Chester River Manor?

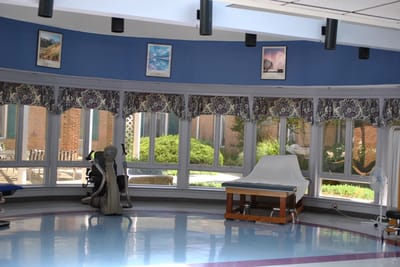
Yes — there are 4 photos of Resorts at Chester River Manor in the photo gallery on this page.

What is the address of Resorts at Chester River Manor?

Resorts at Chester River Manor is located at 200 Morgnec Rd, Chestertown, MD 21620.

What is the phone number of Resorts at Chester River Manor?

(410) 778-4550 will put you in contact with the team at Resorts at Chester River Manor.

Guides for Better Senior Living

Care Cost Calculator: See Prices in Your Area

Nursing Home Data Explorer

Don’t Wait Too Long: 7 Red Flag Signs Your Parent Needs Assisted Living Now

The True Cost of Assisted Living in 2025 – And How Families Are Paying For It

Understanding Senior Living Costs: Pricing Models, Discounts & Financial Assistance