Nursing Home

River Glen Health Care Center

Nursing Home

River Glen Health Care Center

162 S Britain Rd., Southbury, CT 06488 View map
Overview of River Glen Health Care Center

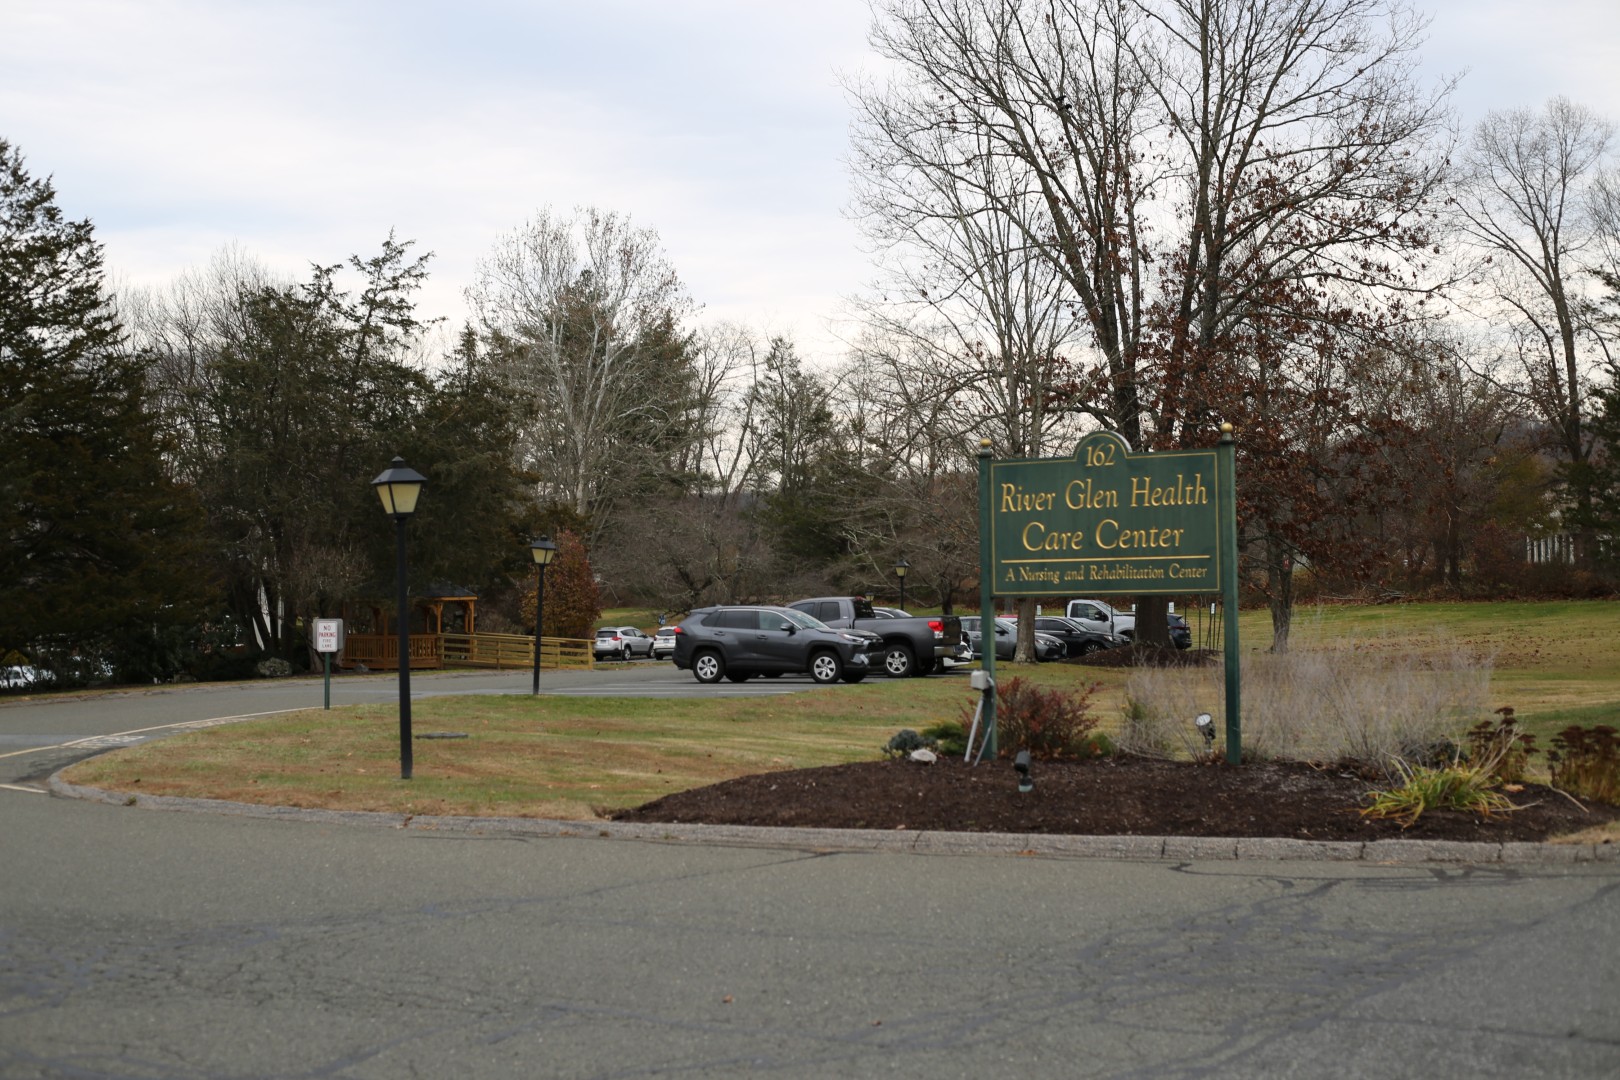
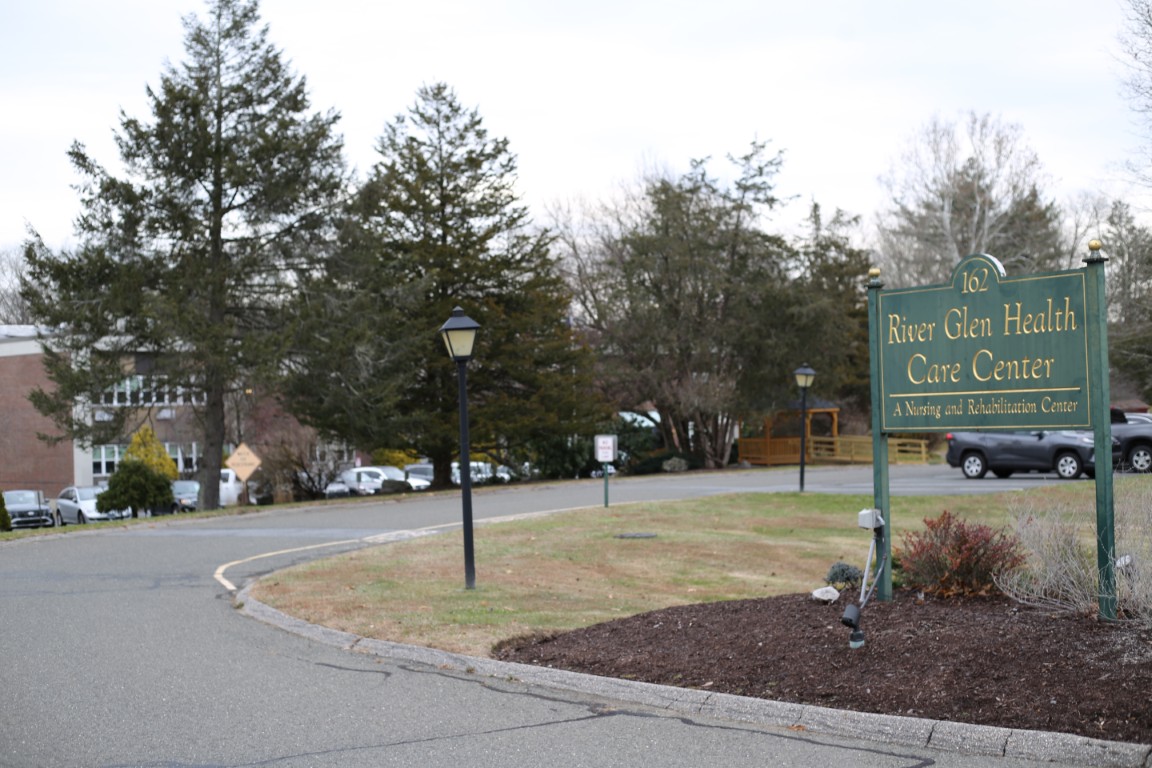
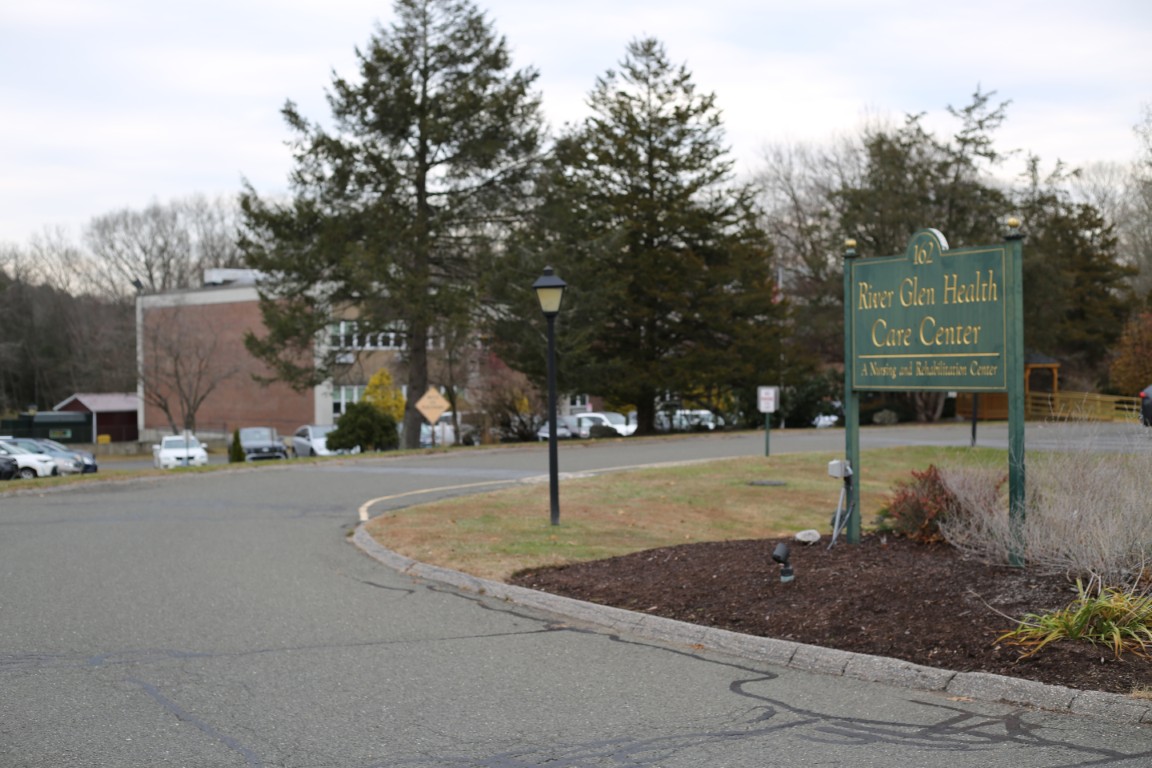
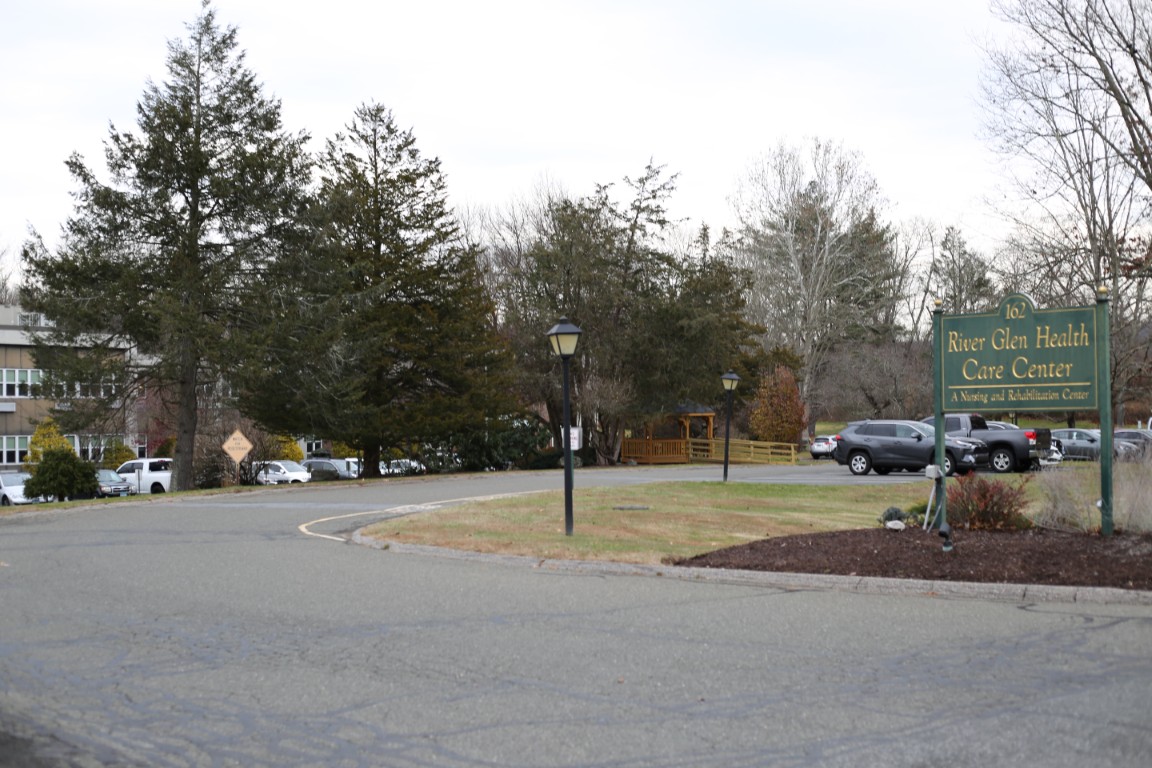
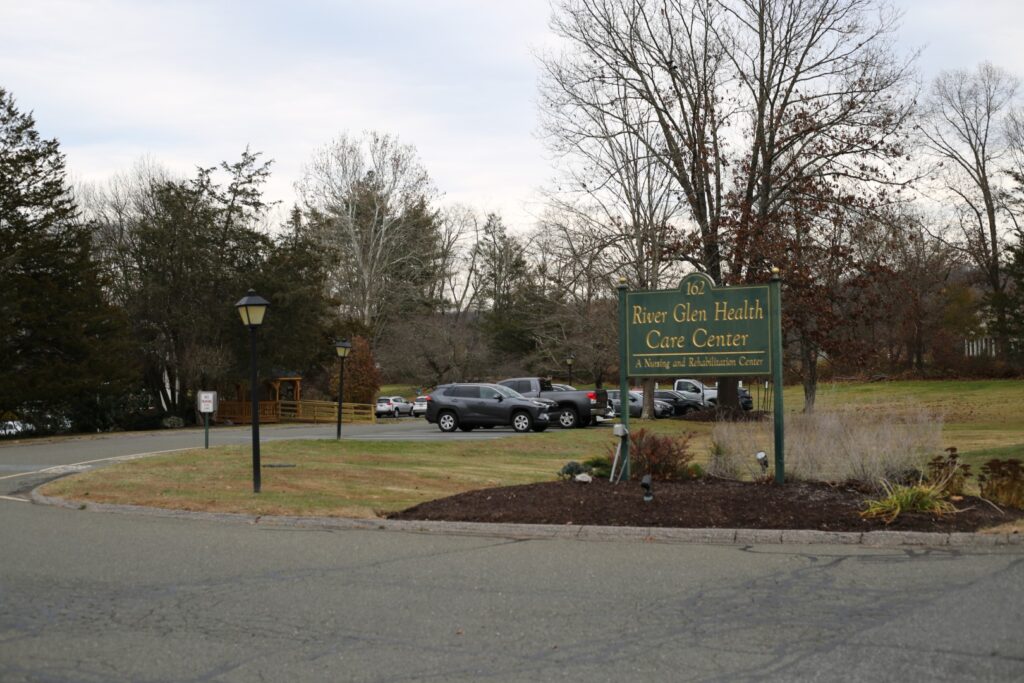
River Glen Health Care Center is a compassionate nursing home in Southbury, CT, that offers rehabilitation and skilled nursing. With its nurturing environment, the community strives to keep older adults comfortable and safe. Therapy services, respite care, and complex medical care are also offered to meet residents’ healthcare needs. The community’s wellness-centered approach provides residents with the utmost care and attention to enrich their living experiences.

Board games, light exercises, and a variety of recreational activities provides residents with more opportunities to live actively and maintain social connections. With state-of-the-art equipment and cozy communal spaces, residents are guaranteed a laid-back retirement. Set near a church, restaurants, and other local amenities, residents have quick access to their necessities. This nursing home is one of the best options for nursing care in Connecticut, especially with its top-tier amenities.

(203) 264-9600

Quality ratings

Measured by Centers for Medicare & Medicaid Services (CMS)

Overall rating Info Official CMS rating based on health inspections, staffing and quality measures.
5/5
Connecticut average: 3.4/5
Health Inspection Info Official CMS rating based on deficiencies found during state health inspections.
5/5
Connecticut average: 3.1/5
Staffing Info Official CMS rating based on nurse staffing hours per resident per day.
4/5
Connecticut average: 3.4/5
Quality Measures Info Official CMS rating based on clinical outcomes for residents.
4/5
Connecticut average: 3.6/5

Nursing care per resident

Info Average daily nursing hours per resident (adjusted for acuity). Higher values indicate more nursing time per resident.
3h 36m per day

This home provides 11% less nursing time per resident than the Connecticut average.

Connecticut average: 4h 4m per day

Staffing hours breakdown

Info Hours of care per resident per day, broken down by staff type. Data from CMS Medicare.
Staff type Facility State avg National avg
Registered Nurse (RN) Info Registered nurse hours per resident per day. 32m per day 28m per day 29m per day

Capacity and availability

Medium-capacity home

Offers a balance of services and community atmosphere.

Total beds 120

This home usually has limited availability

Occupancy is moderate, suggesting balanced demand.

Similar demand to the Connecticut average
Occupancy rate 89.2%
Residents per day (avg) 110
Occupancy rate
89.2%
Residents per day (avg)
110

Who this home usually serves

TYPE OF STAY

Mix of rehab and long-term care

This home supports both short-term rehab and long-term care, with residents staying for a wide range of durations.

Breakdown by payment type

Medicare

46% of new residents, usually for short-term rehab.

Typical stay 23 days

Private pay

54% of new residents, often for short stays.

Typical stay 1 - 2 months

Finances and operations

Privately-owned community
Operated by a business corporation.
Home revenue
$28.8M
Profit
$423.7K
Privately-owned community Operated by a business corporation.
Home revenue
$28,787,753.00
Profit
$423,748.00
Payroll costs Info The portion of the home's budget spent on staff, including nurses, caregivers, and other employees who support care and operations.
$9.0M
31.1% of revenue
Other operating costs Info All remaining costs needed to run the home, such as food, utilities, building maintenance, supplies and administrative expenses.
$19.4M
Total costs $28.4M
Years in operation
17 years in operation
A community with a solid operating history and experience delivering ongoing care.
Walk Score
Walk Score: 35 / 100
Somewhat walkable. A few nearby services may be reachable on foot, but most trips require transportation.

Services

Hospice
Intergenerational Recreation
Iv Therapy
Outpatient Therapy
Recreation
Rehabilitation Therapy
Respiratory Therapy
Respite Care

About this community

Occupancy

Occupancy rate
89%
In line with Connecticut average
Occupied beds
107 / 120
Average residents 102 per day

License details

Facility type
Chronic & Convalescent Nursing Home
Status Active
Issuance January 7, 2009
Expiration June 30, 2027

Additional licensing details

License number: 2280

Room costs

Private Room (15 rooms) $693 per day
Semi-Private Room (44 rooms) $621 per day

Staffing

Key information about the people who lead and staff this community.

Languages Spoken

French Italian Portuguese Spanish Tagalog

Staff Composition (State Data)

Admin
3 FTE
Registered Nurse
13 FTE
Licensed Practical Nurse
23 FTE
Nursing Assistant
37 FTE
Recreation
5 FTE
Social Services
2 FTE
Food Service Supervisor
2 FTE
Physical Therapy
6 FTE
Occupational Therapy
5 FTE
Speech Therapy
1 FTE
Dietary
10 FTE
Other Staff
13 FTE

Additional Policies & Features

Religious Affiliation: No Affiliation
Religious Services: All Denominations, Catholic, Jewish, Protestant

What does this home offer?

Building type icon
Building type icon

Building Type: 2-story

Dining services icon

Dining Services

Beauty services icon

Beauty Services

Social and recreational activities icon

Social and Recreational Activities

Rehabilitative support icon

Rehabilitative Support

On-site medical care and health services icon

On-site Medical Care and Health Services

Types of Care at River Glen Health Care Center

Nursing Home
Contact River Glen Health Care Center

Inspection History

In Connecticut, the Department of Public Health, Facility Licensing and Investigations Section conducts mandatory inspections and unannounced surveys to monitor the quality of care in long-term facilities.

10 visits/inspections

8 routine inspections

Breakdown by inspection type
  • 1 renewal/recertification inspection
  • 1 licensing inspection
  • 2 plans of correction
  • 5 statements of deficiencies

Results

2 with issues

5 without issues

Connecticut average: 13 visits/inspections

Latest inspection

Date:November 6, 2025

Inspection history

01-29-2024 Inspection Report
04-30-2019 Inspection Report
06-12-2023 Inspection Report
07-05-2020 Statement of Deficiencies
08-14-2019 Plan of Correction
08-15-2025 Inspection Report
09-16-2025 Inspection Report
09-26-2025 Plan of Correction
10-07-2020 Statement of Deficiencies
10-08-2020 Statement of Deficiencies
10-16-2020 Statement of Deficiencies
11-06-2025 Inspection Report
12-15-2020 Statement of Deficiencies
12-22-2023 Inspection Report

35 deficiencies

Deficiencies indicate regulatory issues. A higher number implies the facility had several areas requiring improvement.

Inspection Report Summary for River Glen Health Care Center

The most recent inspection on September 16, 2025, confirmed that all previously cited deficiencies were corrected as of August 14, 2025. Earlier inspections, including one on August 15, 2025, identified multiple deficiencies related to medication storage and administration, documentation accuracy, resident supervision, and infection control. Complaint investigations from 2019 substantiated issues with resident care, safety, and documentation, including failures in timely physician notification, ambulation, and fall prevention. Enforcement actions such as fines or license suspensions were not listed in the available reports, and most complaints were substantiated when investigated. The facility’s record shows improvement with recent corrections following prior citations.

Health Inspection History

Inspections
Total health inspections 3

Connecticut average 5.7


Last Health inspection on Dec 2023

Total health citations 19
Citations per inspection
6.33

Health citations are formal notices following inspections when they fail to comply with safety and care standards.

All 19 citations resulted from standard inspections.

Breakdown of citation severity (last 3 years)
Critical Health citations More info 0
100% better than Connecticut average

Connecticut average: 0.3


Serious Health citations More info 1
43% worse than Connecticut average

Connecticut average: 0.7

0 critical citations More info Connecticut average: 0.3

1 serious citation More info Connecticut average: 0.7

17 moderate citations More info Connecticut average: 28.8

1 minor citation More info Connecticut average: 2.3
Citations history (last 3 years)
Pharmacy moderate citation Dec 22, 2023
Corrected

Quality of Care minor citation Dec 22, 2023
Corrected

Care Planning moderate citation Dec 22, 2023
Corrected

Resident Rights moderate citation Dec 22, 2023
Corrected

Compare Nursing Homes around Connecticut

The information below is reported by the Connecticut Department of Public Health, Facility Licensing and Investigations Section.
River Glen Health Care Center
SNF

Nursing Homes 24/7 care needed

Southbury
120
35
THCI COMPANY, LLC
88.9%
$28,772,207.00
$8,953,512.00
31.1%
110
5/5
3.5997
5/5
4/5
4/5
19
1
-40%
-9%
+6%
Private / Semi-Private Rooms
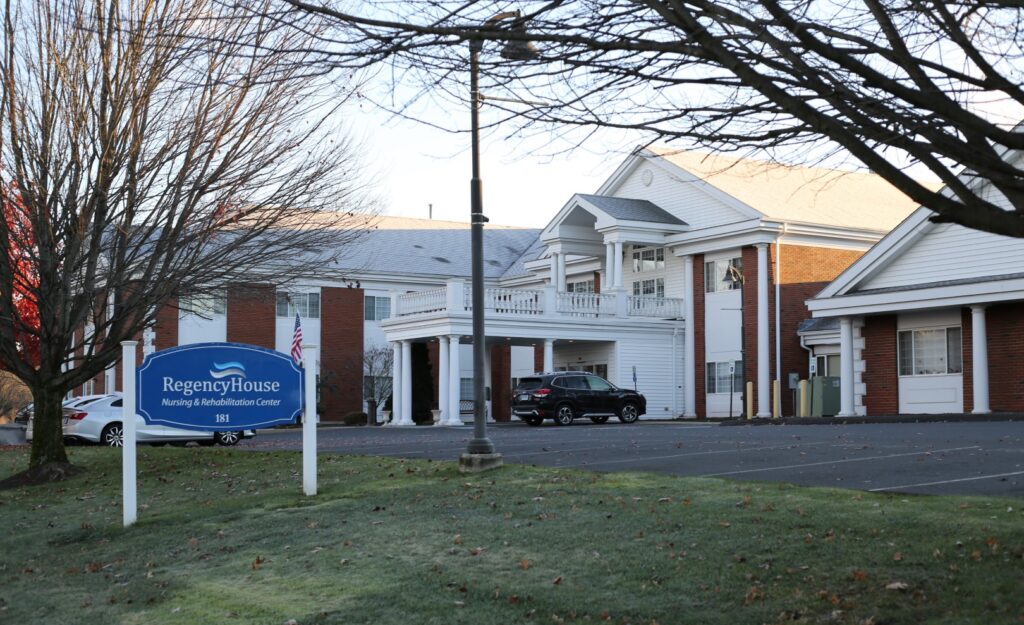
Regency House Of Wallingford I
SNF

Nursing Homes 24/7 care needed

Wallingford (Wallingford Center)
130
39
BARRY BOKOW 2012 FAMILY TRUST
96.3%
$29,082,828.00
$7,852,686.00
27%
124.80
5/5
3.4698
4/5
3/5
5/5
13
-
-11%
-13%
+15%
Private / Semi-Private Rooms
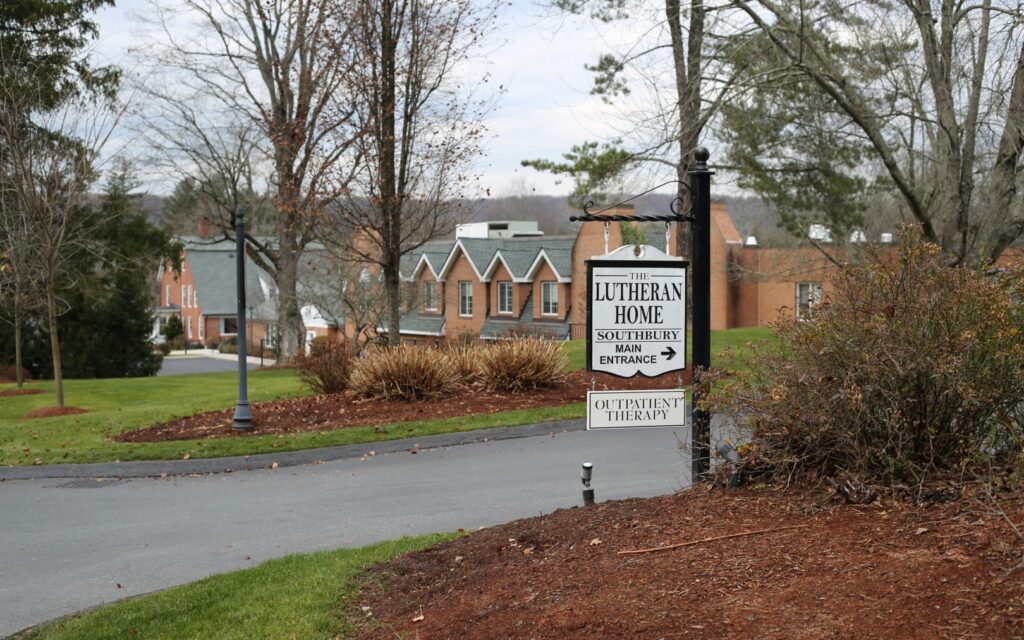
Lutheran Home Of Southbury Inc
SNF

Nursing Homes 24/7 care needed

Southbury
134
3
ASCENTRIA CARE ALLIANCE INC
93.5%
$22,742,789.00
$9,156,872.00
40.3%
110.00
4/5
4.8083
4/5
4/5
4/5
20
-
+41%
+21%
+11%
1 Bed
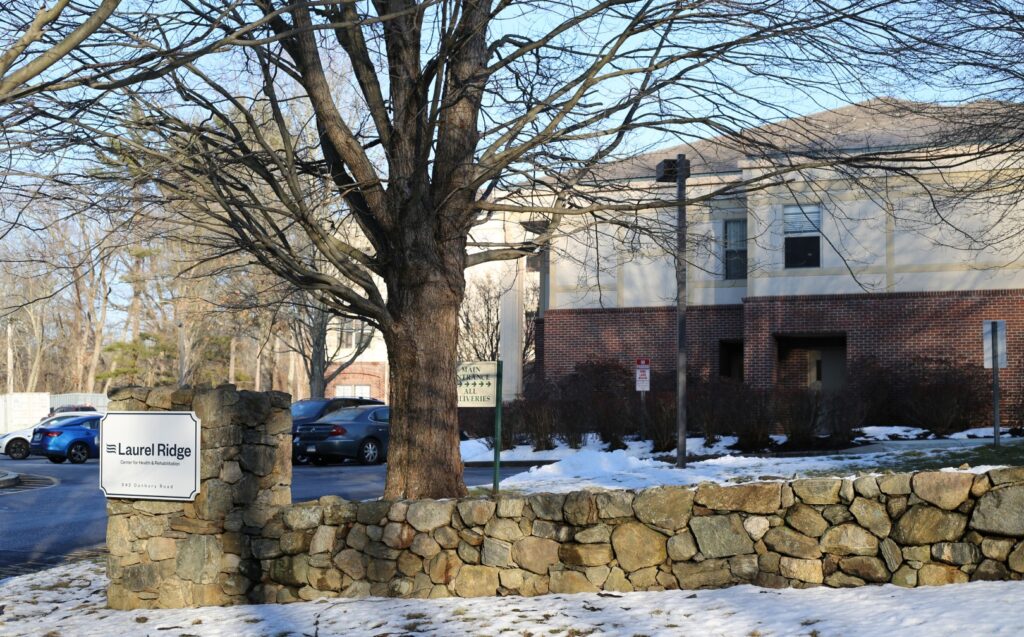
Laurel Ridge Health Care Center
SNF

Nursing Homes 24/7 care needed

Ridgefield (Route 7 Gateway)
-
-
DAVID REIS FAMILY TRUST NO. 3
85.1%
$28,200,247.00
$8,647,532.00
30.7%
111
2/5
3.7960
2/5
2/5
3/5
-
-
-
-4%
+1%
-

Places of interest near River Glen Health Care Center

Address 2.2 miles from city center

Address 162 S Britain Rd., Southbury, CT 06488

Calculate Travel Distance to River Glen Health Care Center

Add your location

Address

Staffing Data

Source: CMS Payroll-Based Journal (Q2 2025)

166
Total Staff
165
Employees
1
Contractors
46,724
Total Hours (Quarter)
67
Avg Staff/Day
7.7
Avg Shift (hrs)
Nursing Staff Breakdown
Role Count Avg Shift (hrs) Uses Contractors?
Registered Nurse116.4 No
Licensed Practical Nurse258.2 No
Certified Nursing Assistant698.1 No
Staff by Category
Administration
2 staff
8hs shift avg
Nursing Staff
105 staff
8hs shift avg
Physicians & Practitioners
24 staff
7.5hs shift avg
Therapy Services
18 staff
6.7hs shift avg
Activities & Recreation
1 staff
5.7hs shift avg
Social Services
3 staff
7.7hs shift avg
Dietary Services
9 staff
7.3hs shift avg
Other Services
4 staff
7.3hs shift avg
Contractor Analysis
0.1%
of total hours from contractors
24 contractor hours this quarter
Medical Director: 1
Role Employees Contractors Total Staff Total Hours Days Worked % of Days Avg Shift (hrs)
Certified Nursing Assistant6906919,92191100%8.1
Licensed Practical Nurse250258,62291100%8.2
Clinical Nurse Specialist230235,87991100%7.5
Other Dietary Services Staff8081,98291100%7.2
Respiratory Therapy Technician6061,4858998%6.7
Registered Nurse110111,4269099%6.4
Physical Therapy Assistant5051,3508998%6.6
Physical Therapy Aide4041,2207582%6.6
Speech Language Pathologist2029517684%7.1
Dental Services Staff3037516268%6.9
Qualified Social Worker3035086673%7.7
Nurse Practitioner1014886369%7.7
Mental Health Service Worker1014886167%8
Administrator1014806066%8
Dietitian1014325459%8
Occupational Therapy Aide1013846066%6.4
Qualified Activities Professional1013345965%5.7
Medical Director0112433%8

Facility Characteristics

Source: CMS Long-Term Care Facility Characteristics (Data as of Jan 2026)

Total census
106 residents
Residents by payment source
Medicare
47 residents (44.3%)
Medicaid
38 residents (35.8%)
Private pay or other
21 residents (19.8%)
Programs & Services
Residents' Group

Residents meet regularly to discuss policies, care quality, and activities

Active Resident Council

Organized group of residents that meets regularly to discuss facility policies, quality of life, and activities.

Quality of care over time

These measures show how residents usually do over time at this home, based on health outcomes and preventive care.

High-risk clinical events score Info A composite score based on pressure ulcers, falls with injury, weight loss, walking ability decline, and activities of daily living decline. 10.3
In line with Connecticut average

Connecticut average: 10.4

Functional decline score Info A composite score based on activities of daily living decline, walking ability decline, and incontinence. 23.3
11% worse than Connecticut average

Connecticut average: 21.1

Long-stay resident measures
Above average Connecticut avg: 3.2 Info CMS star rating based on long-stay quality measure performance. 5 stars = significantly above average, 1 star = significantly below average.
Need for Help with Daily Activities Increased Info Percent of long-stay residents whose need for help with daily activities has increased 17.8%
6% better than Connecticut average

Connecticut average: 18.9%

Walking Ability Worsened Info Percent of long-stay residents whose ability to move independently worsened 22.5%
17% worse than Connecticut average

Connecticut average: 19.2%

Low Risk Residents with Bowel/Bladder Incontinence Info Percent of low risk long-stay residents who lose control of their bowels or bladder 29.6%
19% worse than Connecticut average

Connecticut average: 24.9%

Falls with Major Injury Info Percent of long-stay residents experiencing one or more falls with major injury 1.8%
48% better than Connecticut average

Connecticut average: 3.5%

High Risk Residents with Pressure Ulcers Info Percent of long-stay high risk residents with pressure ulcers 4.7%
In line with Connecticut average

Connecticut average: 4.6%

Urinary Tract Infection Info Percent of long-stay residents with a urinary tract infection 5.0%
195% worse than Connecticut average

Connecticut average: 1.7%

Lost Too Much Weight Info Percent of long-stay residents who lose too much weight 4.8%
23% better than Connecticut average

Connecticut average: 6.3%

Depressive Symptoms Info Percent of long-stay residents who have depressive symptoms 0.4%
97% better than Connecticut average

Connecticut average: 15.2%

Antipsychotic Use Info Percent of long-stay residents who received an antipsychotic medication 19.6%
14% worse than Connecticut average

Connecticut average: 17.2%

Pneumococcal Vaccine Info Percent of long-stay residents assessed and appropriately given the pneumococcal vaccine 92.9%
6% better than Connecticut average

Connecticut average: 87.5%

Influenza Vaccine Info Percent of long-stay residents assessed and appropriately given the seasonal influenza vaccine 97.4%
In line with Connecticut average

Connecticut average: 93.5%

Hospitalizations per 1,000 days Info Number of hospitalizations per 1,000 long-stay resident days. 1.29
39% better than Connecticut average

Connecticut average: 2.10

ED visits per 1,000 days Info Number of outpatient emergency department visits per 1,000 long-stay resident days. 0.24
84% better than Connecticut average

Connecticut average: 1.53

Short-stay resident measures
Above average Connecticut avg: 3.3 Info CMS star rating based on short-stay quality measure performance. 5 stars = much above average, 1 star = much below average.
Pneumococcal Vaccine Info Percent of short-stay residents assessed and appropriately given the pneumococcal vaccine 61.8%
12% worse than Connecticut average

Connecticut average: 70.1%

Antipsychotic medication increase Info Percent of short-stay residents who newly received an antipsychotic medication 0.9%
41% better than Connecticut average

Connecticut average: 1.5%

Influenza Vaccine Info Percent of short-stay residents assessed and appropriately given the seasonal influenza vaccine 57.5%
18% worse than Connecticut average

Connecticut average: 69.8%

Re-hospitalized after SNF stay Info Percentage of short-stay residents who were re-hospitalized after their nursing home admission. 25.0%
In line with Connecticut average

Connecticut average: 25.0%

Emergency department visits Info Percentage of short-stay residents who had an outpatient emergency department visit. 11.1%
In line with Connecticut average

Connecticut average: 11.1%

Falls with major injury Info Percentage of SNF residents who experience falls with major injury during their stay. 0.0%
100% better than Connecticut average

Connecticut average: 0.8%

Ability to care for self at discharge Info Percentage of residents at or above expected ability to care for themselves at discharge. 41.4%
23% worse than Connecticut average

Connecticut average: 53.7%

Successful return to home or community Info Rate of successful return to home or community from a skilled nursing facility. 63.5%
26% better than Connecticut average

Connecticut average: 50.6%

Guides for Better Senior Living

Care Cost Calculator: See Prices in Your Area

Nursing Home Data Explorer

Don’t Wait Too Long: 7 Red Flag Signs Your Parent Needs Assisted Living Now

The True Cost of Assisted Living in 2025 – And How Families Are Paying For It

Understanding Senior Living Costs: Pricing Models, Discounts & Financial Assistance

Financial Aid for Connecticut Seniors

Get financial aid guidance

Connecticut Home Care Program for Elders

CHCPE

Age 65+, Connecticut resident, at risk of nursing home placement.

State-funded: ~$1,600/month; Medicaid: ~$2,829/month (300% FBR).

$1,600 (state), $2,000 (Medicaid, individual).

Two tiers (state and Medicaid); waitlists possible.

Statewide Respite Care Program

CT Respite Care

Caregiver of senior with dementia, Connecticut resident.

~$2,500/month (individual, varies).

$40,000 (individual).

Limited to dementia caregivers; capped funding.

Congregate Housing Services Program (CHSP)

Connecticut Congregate Housing Services Program

Age 62+, Connecticut resident, frail but not needing 24/7 care, resides in CHSP-eligible housing.

~$41,000/year (individual, adjusted annually).

Not specified; focus is income-based.

Limited to 14 state-subsidized sites; participants pay 10% of service costs.

Medicare Savings Program (MSP)

Connecticut Medicare Savings Program

Age 65+ or disabled, Connecticut resident, enrolled in Medicare Part A/B.

~$2,510/month (individual, QMB); ~$3,380/month (SLMB); ~$3,598/month (ALMB)—adjusted annually.

None since 2023 policy change.

Three tiers (Qualified Medicare Beneficiary, Specified Low-Income, Additional Low-Income); no asset test.

Senior Community Service Employment Program (SCSEP)

Connecticut SCSEP (federally funded, state-administered)

Age 55+, unemployed, low-income, Connecticut resident.

~$1,983/month (125% FPL, individual).

Not specified; income-focused.

Priority for veterans, rural residents; limited slots (~500/year).

Tour Icon
Planning a tour? Check our touring checklist.
Chat Icon
Thinking of living here? We can help you speak to a current resident