Saint Anthony Majestic Care
Nursing Home, Assisted Living, Home Care, Hospice Care, Independent Living, Memory Care & Nursing Care · Indiana, IN
CMS overall rating Info CMS (the Centers for Medicare & Medicaid Services) is the federal agency that rates nursing home quality. Its Overall Rating runs from 1 to 5 stars, combining health inspections, staffing, and quality measures, with inspections weighted most heavily.

Saint Anthony Majestic Care

Nursing Home, Assisted Living, Home Care, Hospice Care, Independent Living, Memory Care & Nursing Care · Indiana, IN
CMS overall rating Info CMS (the Centers for Medicare & Medicaid Services) is the federal agency that rates nursing home quality. Its Overall Rating runs from 1 to 5 stars, combining health inspections, staffing, and quality measures, with inspections weighted most heavily.
Calculator: See prices in your area
Saint Anthony Majestic Care accepts Medicare, Medicaid, and private pay.

Overview of Saint Anthony Majestic Care

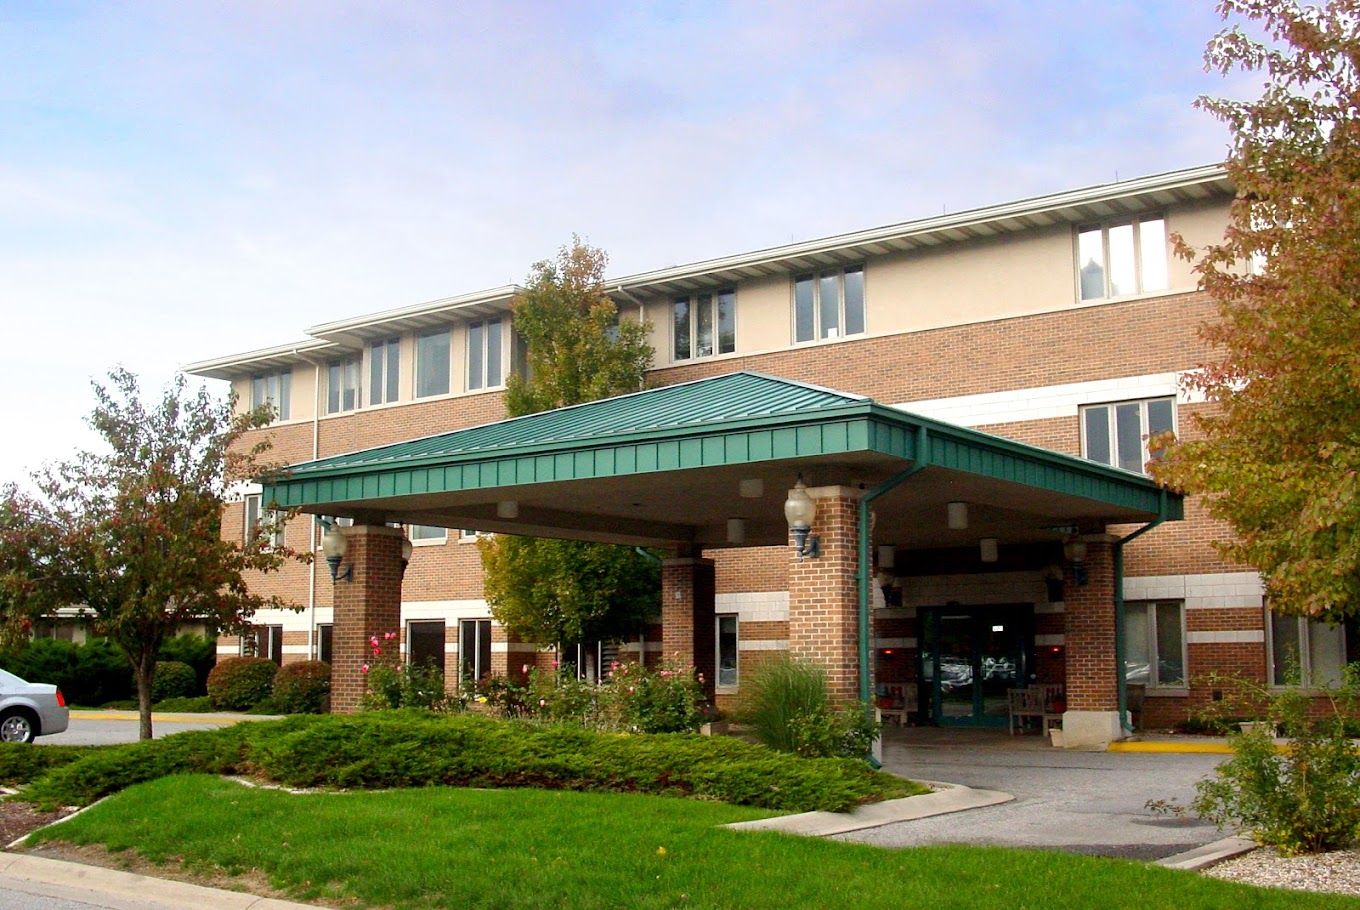
Located in Crown Point, IN, Saint Anthony Majestic Care prioritizes a comprehensive range of health services, including memory care, short-term rehabilitation, physical and occupational therapy, speech and outpatient therapy, and more. Majestic Care features specialized memory care neighborhoods designed to provide a warm, secure environment that keeps residents active and safe. Here, residents can choose from well-appointed and cozy accommodations, including a variety of floor plans tailored to their preferences.

Majestic Care provides quality care as it utilizes RapidTech Software, a revolutionary technology powered by Artificial Intelligence. This advanced software allows for rapid, objective assessments of fall risk and employs predictive analytics to support the Care Team with precise, comprehensive evaluations. With a commitment to excellence, Saint Anthony Majestic Care provides a vibrant, fulfilling environment where residents thrive and every moment is enriched.

Quality ratings

Measured by Centers for Medicare & Medicaid Services (CMS)

Overall rating Info The Overall CMS Rating combines results from health inspections, staffing levels and quality measures. Health inspections carry the most weight. Staffing and quality scores can increase or decrease the final rating based on performance compared to state and national standards.
▼ 67.6% Below IN avg. ▼ 67.6% Below IN avg.IN average: 3.1Click the badge to see the full State ranking.Click here to see the full State ranking.
Health Inspection Info Based on the results of the facility's three most recent standard inspections and any complaint investigations. CMS reviews the number, scope, and severity of deficiencies, with more recent findings weighted more heavily.
▼ 64.4% Below IN avg. ▼ 64.4% Below IN avg.IN average: 2.8Click the badge to see the full State ranking.Click here to see the full State ranking.
Staffing Info Measures average nursing staff hours per resident per day, including Registered Nurses (RNs) and total nursing staff. Ratings are adjusted based on the level of care residents require and are compared to state and national benchmarks.
▼ 59.3% Below IN avg. ▼ 59.3% Below IN avg.IN average: 2.5Click the badge to see the full State ranking.Click here to see the full State ranking.
Quality Measures Info Based on clinical and physical health indicators reported to CMS, such as hospital readmissions, falls, pressure ulcers, and improvements in mobility. These measures reflect how well residents' health needs are being managed.
▼ 2.2% Below IN avg. ▼ 2.2% Below IN avg.IN average: 4.1Click the badge to see the full State ranking.Click here to see the full State ranking.

Staffing hours breakdown

Info Daily nursing hours per resident by staff type, reported to CMS. Higher is generally better — compare this facility to state and national averages to see where staffing stands.

Hours per resident per day — compared to Indiana state averages

Total nursing care / resident Info This home is ranked 232nd out of 291 homes in Indiana for nurse hours. Total adjusted nursing hours per resident per day, combining RN, LPN, and aide time. CMS adjusts this for case-mix so facilities can be fairly compared.
2h 56m per day
Rank #232 / 291Nurse hours — State benchmarkedThis home is ranked 232nd out of 291 homes in Indiana. Shows adjusted nurse hours per resident per day benchmarked to the Indiana average, with a ranking across 291 Indiana facilities. More hours mean more direct care. The national average is about 3.5 hrs; below 3.0 is a red flag.Rankings are based only on facilities in Indiana that report data for that category. Facilities without available data are excluded from the ranking.Click the rank badge to see the full State ranking.Click here to see the full State ranking.
This facility Indiana avg (3h 26m per day)
vs Indiana avg
-15%

4 of 6 metrics below state avg

Standout metric Physical Therapist is +25% above state avg
Staff typeHours / Day / Residentvs state avg
Registered Nurse (RN) Info RNs hold the highest nursing license and can assess residents, interpret test results, and direct care plans. More RN hours per day often signals stronger clinical oversight and faster response to health changes. 25m per day ▼ 37% State avg: 39m per day · National avg: 41m per day
LPN / LVN Info Licensed Practical Nurses (LPNs) or Licensed Vocational Nurses (LVNs) deliver routine hands-on care — medication administration, wound dressing, and monitoring vital signs. They work under RN supervision and make up a large share of daily bedside care. 38m per day ▼ 19% State avg: 47m per day · National avg: 52m per day
Nurse Aide Info Certified Nurse Aides (CNAs) provide the most direct day-to-day assistance: bathing, dressing, feeding, and mobility. Nurse aide hours are typically the largest staffing category and directly affect residents' quality of life. 2h 16m per day ■ Avg State avg: 2h 15m per day · National avg: 2h 20m per day
Weekend Total Nursing Info Combined nursing hours (RN + LPN + Nurse Aide) per resident per day on weekends. Staffing often drops on weekends — this figure reveals whether the facility maintains adequate coverage outside of weekday hours. 2h 45m per day ▼ 16% State avg: 3h 16m per day · National avg: 3h 27m per day
Physical Therapist Info Hours per resident per day provided by licensed Physical Therapists (PTs) or PT Assistants. PT services help residents recover mobility after injury or illness and are especially important for post-acute (short-stay) rehabilitation. 5m per day ▲ 25% State avg: 4m per day · National avg: 4m per day
Weekend RN Info Registered nurse hours specifically on weekends. Facilities sometimes reduce RN presence on Saturdays and Sundays — a low weekend RN figure compared to weekday hours can indicate reduced clinical oversight when most administrative staff are absent. 18m per day ▼ 32% State avg: 27m per day · National avg: 29m per day

Capacity and availability

This home usually has limited availability

Higher occupancy than the Indiana average: 69.4%
Occupancy rate
90.2% Rank #29 / 434Occupancy rate — State benchmarkedThis home is ranked 29th out of 434 homes in Indiana. Shows this facility's occupancy rate versus the Indiana average, with its Statewide rank out of 434. Higher occupancy signals strong local demand and financial stability.Rankings are based only on facilities in Indiana that report data for that category. Facilities without available data are excluded from the ranking.Click the rank badge to see the full State ranking.Click here to see the full State ranking.
Avg. Length of Stay
148 days
Bed community size
189-bed community Rank #37 / 437Bed count — State benchmarkedThis home is ranked 37th out of 437 homes in Indiana. Shows this facility's certified or reported bed count compared to other Indiana facilities. Larger communities may offer more amenities, programs, and on-site services for residents and families.Rankings are based only on facilities in Indiana that report data for that category. Facilities without available data are excluded from the ranking.Click the rank badge to see the full State ranking.Click here to see the full State ranking.
A large-scale community that may provide a wide range of amenities, services, and structured programs.
Years in operation
7 years in operation Rank #107 / 378Years in operation — State benchmarkedThis home is ranked 107th out of 378 homes in Indiana. Shows how long this facility has been in operation compared to other Indiana facilities. Longer operating histories may benefit residents, families, and staff.Rankings are based only on facilities in Indiana that report data for that category. Facilities without available data are excluded from the ranking.Click the rank badge to see the full State ranking.Click here to see the full State ranking.
An established community with some operational experience and growing routines.
Walk Score
Walk Score: 53 / 100 Rank #193 / 587Walk Score — State benchmarkedThis home is ranked 193rd out of 587 homes in Indiana. Shows how walkable this facility's neighborhood is compared to the average Walk Score across Indiana facilities. Higher scores benefit residents, families, and staff.Rankings are based only on facilities in Indiana that report data for that category. Facilities without available data are excluded from the ranking.Click the rank badge to see the full State ranking.Click here to see the full State ranking.
Moderately walkable. Some errands can be accomplished on foot, with a mix of nearby amenities.
BBB Rating
BBB Rating: A+ (Not Accredited)
An independent rating from the Better Business Bureau based on factors such as complaint history, transparency, and business practices.
How BBB ratings work

About this community

License Details

CertificationsPaths to QUALITY™

Ownership & Operating Entity

Profit StatusFor-Profit

Staffing

Key information about the people who lead and staff this community.

Leadership

ContactDavid Marx, Member

Therapy & Rehabilitation

2 services
Rehabilitation Services
Respite Care

Staffing & Medical

1 service
24-Hour Staffing

Memory & Specialized Care

1 service
No Alzheimer's certification

Amenities & Lifestyle

Private Suites
Beautiful Chapel
Branded ProgramsLife Story Communities Memory Care, JOY program
Wellness ProgramYes
Specific ProgramsPastoral Care, Holy Family Child Care, Occupational Therapy, Physical Therapy, Speech Therapy
Religious ServicesYes

Contact Saint Anthony Majestic Care

Health Inspection History

Inspections since 2023
Total health inspections 8

Indiana average 6


Last Health inspection on Jun 2025

Total health citations
49 Rank #266 / 292Health citations — State benchmarkedThis home is ranked 266th out of 292 homes in Indiana. Shows this facility's total health deficiency citations benchmarked to the Indiana State average, with a ranking across all 292 IN facilities. Lower citation counts earn a better rank.Rankings are based only on facilities in Indiana that report data for that category. Facilities without available data are excluded from the ranking.Click the rank badge to see the full State ranking.Click here to see the full State ranking.

Indiana average 25

Citations per inspection
6.12 Rank #239 / 292Citations per inspection — State benchmarkedThis home is ranked 239th out of 292 homes in Indiana. Shows average deficiency citations per CMS inspection for this facility versus the Indiana mean across 292 facilities with citation data. Lower is better.Rankings are based only on facilities in Indiana that report data for that category. Facilities without available data are excluded from the ranking.Click the rank badge to see the full State ranking.Click here to see the full State ranking.

Indiana average 4.12


Health citations are formal notices following inspections when they fail to comply with safety and care standards.

26 of 49 citations resulted from standard inspections; 14 of 49 resulted from complaint investigations; and 9 of 49 came from combined inspections (standard and complaint).

Breakdown of citation severity (last 3 years)
Critical health citations
0
100% better than Indiana average

Indiana average: 0.2


Serious health citations
0
100% better than Indiana average

Indiana average: 0.6

0 critical citations Indiana average: 0.2

0 serious citations Indiana average: 0.6

48 moderate citations Indiana average: 23.8

1 minor citation Indiana average: 0.4
Citations history (last 3 years)
Pharmacy moderate citation Jun 16, 2025
Corrected

Quality of Care moderate citation Jun 16, 2025
Corrected

Quality of Care moderate citation Jun 16, 2025
Corrected

Quality of Care moderate citation Jun 16, 2025
Corrected

Staffing Data

Reporting period: October 1 – December 31, 2025 (Q4 2025). Source: CMS Payroll-Based Journal report.

Total staff 224
Employees 220
Contractors 4
Staff to resident ratio 1.17 : 1
1166567% more staff per resident than Indiana average
Indiana average ratio: 0.00 : 1 Indiana average ratio: 0.00 : 1See full Indiana ranking
Avg staff/day 92
Average shift 7.9 hours
0% compared with Indiana average
Indiana average: 7.7 hours Indiana average shift: 7.7 hoursSee full Indiana ranking
Total staff hours (quarter) 66,930

Nursing staff breakdown

Q4 2025 · Oct 1 – Dec 31 More info This data comes from the CMS Payroll-Based Journal report covering October 1 – December 31, 2025.
Registered Nurse

Manages medical care and health needs.

RN Staff Info All 17 RN Staff are full-time employees. No contractors work on this role. 17
Average shift length Info Average shift length. Calculated as total hours divided by days worked and average staff per day. 7.7 hours
Licensed Practical Nurse

Assists with medical care and medications.

LPN Staff Info All 23 LPN Staff are full-time employees. No contractors work on this role. 23
Average shift length Info Average shift length. Calculated as total hours divided by days worked and average staff per day. 8.6 hours
Certified Nursing Assistant

Helps with daily care and mobility.

CNA Staff Info All 104 CNA Staff are full-time employees. No contractors work on this role. 104
Average shift length Info Average shift length. Calculated as total hours divided by days worked and average staff per day. 7.9 hours

Contractor staffing

Q4 2025 · Oct 1 – Dec 31 More info This data comes from the CMS Payroll-Based Journal report covering October 1 – December 31, 2025.

Total hours from contractors

0.1%

84 contractor hours this quarter

Other Physician: 2 Occupational Therapy Aide: 1 Occupational Therapy Assistant: 1

Staff by category

Q4 2025 · Oct 1 – Dec 31 More info This data comes from the CMS Payroll-Based Journal report covering October 1 – December 31, 2025.
Certified Nursing Assistant104010430,42292100%7.9
Licensed Practical Nurse230237,48892100%8.6
Medication Aide/Technician170176,42292100%8.4
Registered Nurse170174,96292100%7.7
Speech Language Pathologist140143,6858087%6.8
RN Director of Nursing7072,8848896%8.5
Physical Therapy Aide6061,9987177%7.9
Other Dietary Services Staff5051,58692100%7
Clinical Nurse Specialist4041,3328087%8.4
Respiratory Therapy Technician4041,2507683%6.6
Dietitian2021,0226975%8.3
Physical Therapy Assistant4048877784%6.2
Administrator3038726166%8
Dental Services Staff5055965762%7.9
Mental Health Service Worker1014806065%8
Qualified Social Worker2024786571%6.4
Nurse Practitioner1013924953%8
Nurse Aide in Training101901415%6.4
Occupational Therapy Aide0114889%6
Other Physician022241213%2
Occupational Therapy Assistant0111222%6
104 Certified Nursing Assistant
% of Days 100%
23 Licensed Practical Nurse
% of Days 100%
17 Medication Aide/Technician
% of Days 100%
17 Registered Nurse
% of Days 100%
14 Speech Language Pathologist
% of Days 87%
7 RN Director of Nursing
% of Days 96%
6 Physical Therapy Aide
% of Days 77%
5 Other Dietary Services Staff
% of Days 100%
4 Clinical Nurse Specialist
% of Days 87%
4 Respiratory Therapy Technician
% of Days 83%
2 Dietitian
% of Days 75%
4 Physical Therapy Assistant
% of Days 84%
3 Administrator
% of Days 66%
5 Dental Services Staff
% of Days 62%
1 Mental Health Service Worker
% of Days 65%
2 Qualified Social Worker
% of Days 71%
1 Nurse Practitioner
% of Days 53%
1 Nurse Aide in Training
% of Days 15%
1 Occupational Therapy Aide
% of Days 9%
2 Other Physician
% of Days 13%
1 Occupational Therapy Assistant
% of Days 2%

Penalties and fines

Federal penalties imposed by CMS for regulatory violations, including civil money penalties (fines) and denials of payment for new Medicare/Medicaid admissions.

Source: CMS Penalties Database

No penalties in the past 3 years

No civil money penalties or payment denials were reported in the last 3 years.

Quality of care over time

These measures show how residents usually do over time at this home, based on health outcomes and preventive care.

High-risk clinical events score Info A composite score based on pressure ulcers, falls with injury, weight loss, walking ability decline, and activities of daily living decline. 6.7
17% better than Indiana average

Indiana average: 8.0

Functional decline score Info A composite score based on activities of daily living decline, walking ability decline, and incontinence. 14.2
17% better than Indiana average

Indiana average: 17.1

Long-stay resident measures
Need for Help with Daily Activities Increased Info Percent of long-stay residents whose need for help with daily activities has increased 10.8%
10% better than Indiana average

Indiana average: 12.0%

Walking Ability Worsened Info Percent of long-stay residents whose ability to move independently worsened 8.4%
42% better than Indiana average

Indiana average: 14.4%

Low Risk Residents with Bowel/Bladder Incontinence Info Percent of low risk long-stay residents who lose control of their bowels or bladder 23.5%
In line with Indiana average

Indiana average: 24.6%

Falls with Major Injury Info Percent of long-stay residents experiencing one or more falls with major injury 0.8%
79% better than Indiana average

Indiana average: 3.9%

High Risk Residents with Pressure Ulcers Info Percent of long-stay high risk residents with pressure ulcers 6.2%
42% worse than Indiana average

Indiana average: 4.4%

Urinary Tract Infection Info Percent of long-stay residents with a urinary tract infection 0.0%
100% better than Indiana average

Indiana average: 1.2%

Lost Too Much Weight Info Percent of long-stay residents who lose too much weight 7.1%
25% worse than Indiana average

Indiana average: 5.7%

Depressive Symptoms Info Percent of long-stay residents who have depressive symptoms 29.7%
23% worse than Indiana average

Indiana average: 24.1%

Antipsychotic Use Info Percent of long-stay residents who received an antipsychotic medication 11.4%
9% better than Indiana average

Indiana average: 12.4%

Pneumococcal Vaccine Info Percent of long-stay residents assessed and appropriately given the pneumococcal vaccine 99.2%
6% better than Indiana average

Indiana average: 93.7%

Influenza Vaccine Info Percent of long-stay residents assessed and appropriately given the seasonal influenza vaccine 100.0%
5% better than Indiana average

Indiana average: 95.4%

Short-stay resident measures
Pneumococcal Vaccine Info Percent of short-stay residents assessed and appropriately given the pneumococcal vaccine 81.4%
In line with Indiana average

Indiana average: 81.7%

Antipsychotic medication increase Info Percent of short-stay residents who newly received an antipsychotic medication 1.1%
19% better than Indiana average

Indiana average: 1.4%

Influenza Vaccine Info Percent of short-stay residents assessed and appropriately given the seasonal influenza vaccine 80.8%
In line with Indiana average

Indiana average: 79.0%

Breakdown by payment type

Medicare

55% of new residents, usually for short-term rehab.

Typical stay 1 - 2 months

Private pay

24% of new residents, often for short stays.

Typical stay 3 - 4 months

Medicaid

21% of new residents, often for long-term daily care.

Typical stay 1 - 2 years

Facility Characteristics

Source: CMS Long-Term Care Facility Characteristics (Data as of Jan 2026)

Total residents 192
Medicare
34
17.7% of residents
Medicaid
155
80.7% of residents
Private pay or other
3
1.6% of residents
Programs & Services
Residents Group

Residents meet regularly to discuss policies, care quality, and activities

CCRC

Part of a Continuing Care Retirement Community offering multiple care levels

Active Resident Council

Organized group of residents that meets regularly to discuss facility policies, quality of life, and activities.

Finances and operations

Based on CMS SNF Cost Report for fiscal year ending in 12/2023.

Voluntary non-profit community
Operated by a church.
Net patient revenue Info Net patient revenue — what the home actually collects for resident care, after contractual allowances, bad debt and discounts are subtracted from its gross charges (CMS cost report, Worksheet G-3). It covers resident care only; money the home earns from other sources is shown separately as "Other income."
$26.2M
Net patient income Info Net patient income: net patient revenue minus the home's total operating expenses. A positive figure means it earns more from resident care than it spends to deliver it; a negative figure means the opposite. It excludes non-operating "other income."
$4.2M
Voluntary non-profit community Operated by a church.
Net patient revenue Info Net patient revenue — what the home actually collects for resident care, after contractual allowances, bad debt and discounts are subtracted from its gross charges (CMS cost report, Worksheet G-3). It covers resident care only; money the home earns from other sources is shown separately as "Other income."
$26.2M Rank #8 / 294Revenue — State benchmarkedThis home is ranked 8th out of 294 homes in Indiana. Shows this facility's annual revenue compared to the Indiana average. Higher revenue generally means more resources for staffing and capital — read alongside Payroll %.Rankings are based only on facilities in Indiana that report data for that category. Facilities without available data are excluded from the ranking.Click the rank badge to see the full State ranking.Click here to see the full State ranking.
Net patient income Info Net patient income: net patient revenue minus the home's total operating expenses. A positive figure means it earns more from resident care than it spends to deliver it; a negative figure means the opposite. It excludes non-operating "other income."
$4.2M
Other income Info Money the home earns outside of resident care — such as investments, grants, rentals and other non-operating sources (CMS cost report, Worksheet G-3). It is tracked separately from net patient revenue: it is not part of that figure, and it is not included in net patient income.
$167.3K
Payroll costs Info Staff salaries plus wage-related costs — benefits such as payroll taxes, health insurance and retirement — from the home's own accounting records (CMS cost report, Worksheet A). Contract or agency labor is counted separately, under other operating costs. Rank #14 / 294Payroll — State benchmarkedThis home is ranked 14th out of 294 homes in Indiana. Shows total annual staff payroll benchmarked to the Indiana average. Higher payroll investment relative to peers often signals better staffing and less reliance on cheaper contract labor.Rankings are based only on facilities in Indiana that report data for that category. Facilities without available data are excluded from the ranking.Click the rank badge to see the full State ranking.Click here to see the full State ranking.
$9.5M 36% of net patient revenue Info Payroll as a share of revenue: staff salaries and wage-related benefits divided by net patient revenue. A higher figure means more of each revenue dollar goes to staff pay. Rank #241 / 294Payroll % — State benchmarkedThis home is ranked 241st out of 294 homes in Indiana. Shows payroll as a percentage of revenue versus the Indiana average. Well-run Indiana facilities typically land around 54–68% — the top third Statewide. Below 25% may signal understaffing or heavy agency use — read with Staffing ratings.Rankings are based only on facilities in Indiana that report data for that category. Facilities without available data are excluded from the ranking.Click the rank badge to see the full State ranking.Click here to see the full State ranking.
Other operating costs Info Everything it costs to run the home apart from payroll — food, utilities, supplies, maintenance, contract labor and administration. Calculated as total operating expense minus payroll (staff salaries and wage-related benefits).
$12.6M
Total costs Info The home's total operating expense for the year — all the costs of running it, salaries included (CMS cost report, Worksheet G-3).
$22.0M

What does this home offer?

Building type icon
Building type icon

Building Type: 3-story

Who this home usually serves

TYPE OF STAY

Mostly short-term rehab stays

Most residents typically stay for a few weeks or months before returning home or moving on.

Most new residents arrive under Medicare (55% of admissions), and a typical Medicare stay runs around 1 - 2 months.

Admissions
418 total

Coverage residents most often arrive under.

Medicare 55%
Private pay 24%
Medicaid 21%
Discharges
423 total

Coverage residents most often leave under.

Medicare 41%
Private pay 30%
Medicaid 29%

Places of interest near Saint Anthony Majestic Care

Address 1.5 miles from city center Info Estimated distance in miles from Crown Point's city center to Saint Anthony Majestic Care's address, calculated via Google Maps.

Calculate Travel Distance to Saint Anthony Majestic Care

Add your location

Address

Compare Nursing Homes around Indiana

The information below is reported by the Indiana Department of Health, Division of Long Term Care.

5 facilities compared · CMS & IN Dept. of Health data

The Barrington of Carmel
NH
AL
IL
MC
Carmel
154
Facility 154
IN AVG 116
Rank #82 / 437
71.4%
Facility 71.4%
IN AVG 69.4%
Rank #174 / 434
+3%
9.22
Facility 9.22
IN AVG 3.44
Rank #1 / 291
-61%+168%
$0
Facility $0
IN AVG $31.4k
Rank #1 / 293
94
Facility 94
IN AVG 83
Rank #47 / 384
5
Facility 5
IN AVG 25.0
Rank #11 / 292
2.5
Facility 2.5
IN AVG 4.1
Rank #52 / 292
-110A+
39
Facility 39
IN AVG 37
Rank #275 / 587
Bhi Retirement Communities Inc
$17.0M
Facility $17.0M
IN AVG $10.7M
Rank #43 / 294
$6.9M
Facility $6.9M
IN AVG $4.2M
Rank #67 / 294
40.6%
Facility 40.6%
IN AVG 42%
Rank #217 / 294
155817
Greenwood Village South
NH
AL
IL
MC
Greenwood
207
Facility 207
IN AVG 116
Rank #27 / 437
--
4.16
Facility 4.16
IN AVG 3.44
Rank #39 / 291
-50%+21%
$0
Facility $0
IN AVG $31.4k
Rank #1 / 293
83
Facility 83
IN AVG 83
Rank #151 / 384
6
Facility 6
IN AVG 25.0
Rank #17 / 292
3.0
Facility 3.0
IN AVG 4.1
Rank #82 / 292
-38A+
50
Facility 50
IN AVG 37
Rank #205 / 587
Pamela Seegers
$28.2M
Facility $28.2M
IN AVG $10.7M
Rank #3 / 294
$15.6M
Facility $15.6M
IN AVG $4.2M
Rank #3 / 294
55.4%
Facility 55.4%
IN AVG 42%
Rank #150 / 294
155026
North River Health Campus
NH
ADC
AL
IL
MC
Evansville (East Baseline Road)
95
Facility 95
IN AVG 116
Rank #269 / 437
50.5%
Facility 50.5%
IN AVG 69.4%
Rank #346 / 434
-27%
3.66
Facility 3.66
IN AVG 3.44
Rank #72 / 291
+63%+7%
$0
Facility $0
IN AVG $31.4k
Rank #1 / 293
91
Facility 91
IN AVG 83
Rank #71 / 384
10
Facility 10
IN AVG 25.0
Rank #41 / 292
3.3
Facility 3.3
IN AVG 4.1
Rank #108 / 292
-53A+
11
Facility 11
IN AVG 37
Rank #456 / 587
Thomas Cook
$10.8M
Facility $10.8M
IN AVG $10.7M
Rank #134 / 294
$5.8M
Facility $5.8M
IN AVG $4.2M
Rank #101 / 294
53.6%
Facility 53.6%
IN AVG 42%
Rank #101 / 294
155854
The Restoracy of Carmel
NH
MC
Carmel (Carmel Arts & Design District)
72
Facility 72
IN AVG 116
Rank #344 / 437
94.4%
Facility 94.4%
IN AVG 69.4%
Rank #12 / 434
+36%
4.61
Facility 4.61
IN AVG 3.44
Rank #27 / 291
-46%+34%
$0
Facility $0
IN AVG $31.4k
Rank #1 / 293
70
Facility 70
IN AVG 83
Rank #326 / 384
44
Facility 44
IN AVG 25.0
Rank #251 / 292
6.3
Facility 6.3
IN AVG 4.1
Rank #244 / 292
269A+
77
Facility 77
IN AVG 37
Rank #30 / 587
Euson Lindsay Legacy, LLC
$10.1M
Facility $10.1M
IN AVG $10.7M
Rank #164 / 294
$4.4M
Facility $4.4M
IN AVG $4.2M
Rank #147 / 294
43.7%
Facility 43.7%
IN AVG 42%
Rank #133 / 294
155846
Saint Anthony Majestic Care
NH
AL
HC
IL
MC
NC
Crown Point (West Franciscan Drive)
189
Facility 189
IN AVG 116
Rank #37 / 437
90.2%
Facility 90.2%
IN AVG 69.4%
Rank #29 / 434
+30%
2.93
Facility 2.93
IN AVG 3.44
Rank #232 / 291
-22%-15%
$0
Facility $0
IN AVG $31.4k
Rank #1 / 293
-
49
Facility 49
IN AVG 25.0
Rank #266 / 292
6.1
Facility 6.1
IN AVG 4.1
Rank #239 / 292
-177A+
53
Facility 53
IN AVG 37
Rank #193 / 587
Thomas Barry
$26.2M
Facility $26.2M
IN AVG $10.7M
Rank #8 / 294
$9.5M
Facility $9.5M
IN AVG $4.2M
Rank #14 / 294
36%
Facility 36%
IN AVG 42%
Rank #241 / 294
155214

Financial Assistance for
Nursing Home in Indiana

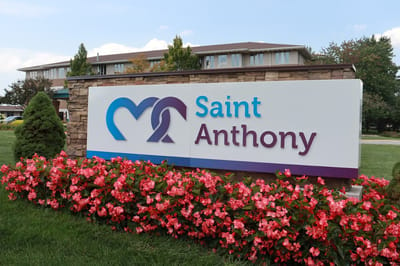
Saint Anthony Majestic Care is located in Crown Point, Indiana.
Here are the financial assistance programs available to residents in Indiana.

Get Financial aid guidance

Aged and Disabled Waiver

Indiana Medicaid A&D Waiver

Age 65+ or disabled
General Indiana resident, Medicaid-eligible, nursing home-level care need.
Income Limits (2025) ~$2,829/month 300% FBR, individual
Asset Limits $2,000 (individual), $3,000 (couple).
IN

Requires level-of-care determination.

Benefits
Personal care (5-7 hours/day) Respite (240 hours/year) Adult day care (~$60/day) Home health services

CHOICE Program

Indiana CHOICE

Age 60+
General Indiana resident, at risk of nursing home.
Income Limits ~$2,000/month varies
Asset Limits $10,000 individual
IN

Limited funding; regional variation.

Benefits
In-home care (3-5 hours/week) Respite (up to 10 days/year) Transportation (~5 trips/month)

Residential Care Assistance Program (RCAP)

Indiana Residential Care Assistance Program

Age 65+
General or blind, or disabled, Indiana resident, in approved facility, low-income or SSI recipient.
Income Limits (2025) ~$1,004/month including SSI
Asset Limits $2,000 (individual), $3,000 (couple).
IN

~50 facilities statewide; per diem rate set by FSSA.

Benefits
Room/board Laundry Minimal care coordination (~$20-$50/day subsidy)

Medicare Savings Program (MSP)

Indiana Medicare Savings Program

Age 65+ or disabled
General Indiana resident, Medicare Part A/B.
Income Limits (2025) ~$2,510/month (QMB), ~$3,380/month (SLMB), ~$3,598/month (QI)—individual.
Asset Limits $9,430 (individual), $14,130 (couple).
IN

Three tiers; no waitlist.

Benefits
Covers Part B premiums ($174.70/month) Deductibles ($240/year) Copays (~20%)

National Family Caregiver Support Program (NFCSP) Respite

Indiana NFCSP Respite Care

Age
General Caregivers of 60+ needing care or 55+ caregivers of others; Indiana resident; functional needs (2+ ADLs).
Income Limits (2025) Prioritizes ~$24,980/year (individual); no strict cap.
Asset Limits Not assessed; need-based.
IN

16 AAAs; prioritizes low-income, rural caregivers.

Benefits
Respite (4-6 hours/week or 5 days/year) Adult day care ($60/day) Caregiver training

VA Aid and Attendance (A&A) and Housebound Benefits

Indiana VA Aid and Attendance/Housebound

Age 65+ or disabled veteran/spouse
General Indiana resident, wartime service, need for ADL help (A&A) or homebound.
Income Limits (2025) Net income < ~$1,984/month (veteran with dependent, A&A); pension offsets income.
Asset Limits ~$155,356 net worth limit
IN

High veteran demand statewide.

Benefits
Cash (~$1,433-$2,642/month veteran, ~$951-$1,318 spouse) for care costs (e.g., in-home, assisted living)

Frequently Asked Questions about Saint Anthony Majestic Care

What neighborhood is Saint Anthony Majestic Care in?

Saint Anthony Majestic Care is in the West Franciscan Drive neighborhood of Crown Point.

Is Saint Anthony Majestic Care in a walkable area?

Saint Anthony Majestic Care has a walk score of 53. Moderately walkable. Some errands can be accomplished on foot, with a mix of nearby amenities.

What is the occupancy rate at Saint Anthony Majestic Care?

Saint Anthony Majestic Care's occupancy is 90.2%.

Does Saint Anthony Majestic Care operate as a for-profit or non-profit?

Saint Anthony Majestic Care is registered as a for-profit in IN.

Are there photos of Saint Anthony Majestic Care?

Yes — there are 5 photos of Saint Anthony Majestic Care in the photo gallery on this page.

What is the address of Saint Anthony Majestic Care?

Saint Anthony Majestic Care is located at 203 W Franciscan Dr, Crown Point, IN 46307.

What is the phone number of Saint Anthony Majestic Care?

(219) 661-5100 will put you in contact with the team at Saint Anthony Majestic Care.

Guides for Better Senior Living

Care Cost Calculator: See Prices in Your Area

Nursing Home Data Explorer

Don’t Wait Too Long: 7 Red Flag Signs Your Parent Needs Assisted Living Now

The True Cost of Assisted Living in 2025 – And How Families Are Paying For It

Understanding Senior Living Costs: Pricing Models, Discounts & Financial Assistance