


Total health inspections
6
Ohio average 6.7
Last Health inspection on Jan 2025
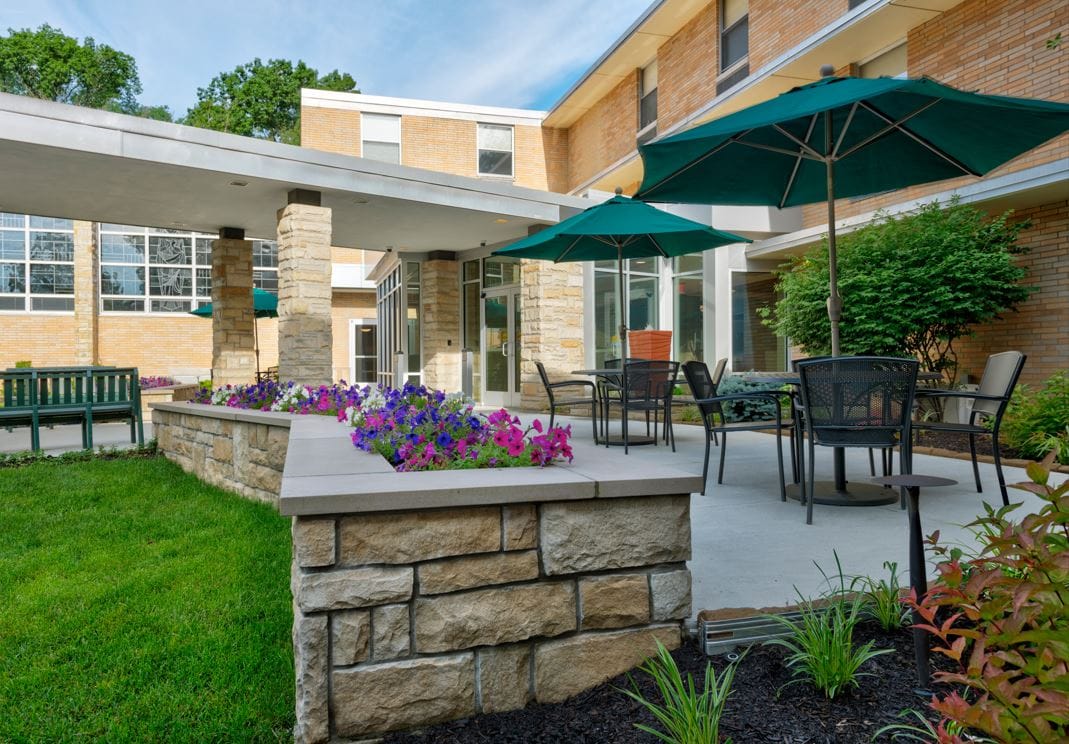


Discover an exceptional living experience at Saint Margaret Hall in Cincinnati, OH, where residents benefit from skilled nursing, long-term care, assisted living, and respite care services. The dedicated team is committed to ensuring that every resident enjoys a broad range of services and access to a diverse array of activities tailored to their residents’ interests.
At Saint Margaret Hall, residents can take advantage of convenient onsite services, including access to medical appointments, home-style dining, and a well-stocked shop for everyday necessities. The community also features an exciting calendar of events, offering options such as movie nights, cooking classes, gardening, yoga, and walking groups. Experience the warmth, hospitality, and vibrant community spirit at Saint Margaret Hall where every day is an opportunity for connection and enrichment.
| Staff type | Hours / Day / Resident | vs state avg |
|---|---|---|
|
Registered Nurse (RN)
| 21m per day | ▼ 45% State avg: 38m per day · National avg: 41m per day |
|
LPN / LVN
| 1h 9m per day | ▲ 18% State avg: 58m per day · National avg: 52m per day |
|
Nurse Aide
| 2h 1m per day | ▼ 6% State avg: 2h 8m per day · National avg: 2h 21m per day |
|
Weekend Total Nursing
| 3h 9m per day | ▼ 4% State avg: 3h 17m per day · National avg: 3h 26m per day |
|
Physical Therapist
| 9m per day | ▲ 189% State avg: 3m per day · National avg: 4m per day |
|
Weekend RN
| 12m per day | ▼ 53% State avg: 25m per day · National avg: 29m per day |
Key information about the people who lead and staff this community.
In Ohio, the Department of Health, Bureau of Survey and Certification conducts unannounced onsite inspections to evaluate the quality of care and environment in all licensed facilities.
Citations
| This Facility | OH Average | vs. OH Avg |
|---|---|---|---|
|
Total citations
| 6 | 2 | This facility has 200% more total citations than a typical Ohio nursing home (6 vs. OH avg 2).↑ 200% worse |
Every two years, the Ohio Department of Aging and the Office of the State Long-Term Care Ombudsman organizations conduct a satisfaction survey among residents in long-term care facilities to assess their quality of care and life.
Ohio average: 86 / 100
Ohio average: 89 / 100
Ohio average: 95 / 100
Ohio average: 82 / 100
Ohio average: 86 / 100
Ohio average: 89 / 100
Ohio average: 80 / 100
Ohio average: 81 / 100
Based on the RCF Resident Satisfaction Survey 2022-23, Final Results
Have you gotten or are you getting physical therapy, occupational therapy or speech therapy, while living at this care facility?
This facility67/100
Ohio average46/100
Did (Do) the therapists help you set goals?
This facility67/100
Ohio average89/100
Did (Does) the therapy help you meet your goals?
This facility100/100
Ohio average88/100
Can you decide how to spend your day?
This facility100/100
Ohio average94/100
Did (Do) you know who to speak to about your therapy progress?
This facility100/100
Ohio average85/100
Scores represent percent of positive resident responses for each item, excluding "don't know" and "not applicable" responses and instances where the question was skipped.
Based on the RCF Resident Satisfaction Survey 2022-23, Final Results
Can you enjoy the outdoors if you want to?
This facility83/100
Ohio average91/100
Do you feel safe here?
This facility100/100
Ohio average98/100
Are your personal items safe here?
This facility100/100
Ohio average92/100
Do you feel you have enough privacy?
This facility100/100
Ohio average95/100
Are you able to get around the building if you want to?
This facility100/100
Ohio average95/100
Is it easy for you to get around in your room (or apartment)?
This facility100/100
Ohio average96/100
Is it very clean here?
This facility100/100
Ohio average96/100
Can you find a place to be alone if you want to be alone?
This facility100/100
Ohio average96/100
Scores represent percent of positive resident responses for each item, excluding "don't know" and "not applicable" responses and instances where the question was skipped.
Based on the RCF Resident Satisfaction Survey 2022-23, Final Results
Did you receive a thorough orientation to SAINT MARGARET HALL, INC?
This facility60/100
Ohio average70/100
Did you feel warmly welcomed as a new resident?
This facility83/100
Ohio average93/100
Were you given enough information to learn how things work here?
This facility100/100
Ohio average82/100
Scores represent percent of positive resident responses for each item, excluding "don't know" and "not applicable" responses and instances where the question was skipped.
Based on the RCF Resident Satisfaction Survey 2022-23, Final Results
Are you friends with anyone who lives here?
This facility33/100
Ohio average81/100
Do the people who work here help you with technology, if needed?
This facility83/100
Ohio average89/100
Overall, are you satisfied with the care you receive here?
This facility100/100
Ohio average94/100
Are you encouraged to speak up about things you don’t like here?
This facility100/100
Ohio average81/100
Are your concerns taken care of in a timely way?
This facility100/100
Ohio average86/100
Are you as involved in decisions about your care as you want to be?
This facility100/100
Ohio average85/100
Do the people who work here seem happy to work here?
This facility100/100
Ohio average92/100
Do the people who work here go above and beyond to give you a good life?
This facility100/100
Ohio average87/100
Do the people who work here tell you when rules, policies, and procedures change?
This facility100/100
Ohio average78/100
Would you highly recommend SAINT MARGARET HALL, INC to someone who needs this type of care?
This facility100/100
Ohio average89/100
Scores represent percent of positive resident responses for each item, excluding "don't know" and "not applicable" responses and instances where the question was skipped.
Based on the RCF Resident Satisfaction Survey 2022-23, Final Results
Do the people who work here ever get angry at you?
This facility83/100
Ohio average88/100
Do the people who care for you explain your care and services to you?
This facility83/100
Ohio average85/100
Do the people who work here do things the way you want them done?
This facility100/100
Ohio average88/100
Do the people who work here make sure you are comfortable when they provide care or services?
This facility100/100
Ohio average95/100
Do the people who work here do everything they can to protect you from getting sick?
This facility100/100
Ohio average94/100
Do the people who work here check on you often enough to see if you need anything?
This facility100/100
Ohio average81/100
Do the people who work here support you to do as much for yourself as you are able to do?
This facility100/100
Ohio average96/100
Are the people who work here knowledgeable about your medical conditions and treatments?
This facility100/100
Ohio average90/100
Do the same people take care of you most of the time?
This facility100/100
Ohio average84/100
Do you have opportunities to maintain your health and wellness, if you want?
This facility100/100
Ohio average92/100
Do you feel confident the people who work here would come quickly anytime you needed help?
This facility100/100
Ohio average85/100
Scores represent percent of positive resident responses for each item, excluding "don't know" and "not applicable" responses and instances where the question was skipped.
Based on the RCF Resident Satisfaction Survey 2022-23, Final Results
Are there enjoyable things to do on the weekends, if you want?
This facility50/100
Ohio average63/100
Are you as connected to the community as you want to be?
This facility60/100
Ohio average71/100
Do you have something to look forward to most days?
This facility67/100
Ohio average77/100
Do you feel included in life here?
This facility67/100
Ohio average89/100
Do you like the activities here?
This facility75/100
Ohio average83/100
Do you have plenty of opportunities to do things that are meaningful to you?
This facility83/100
Ohio average83/100
Do you usually enjoy how you spend your time?
This facility83/100
Ohio average87/100
Do you have enough opportunities to go on outings and special events?
This facility83/100
Ohio average73/100
Are you able to do the activities offered here, if you want?
This facility100/100
Ohio average93/100
Scores represent percent of positive resident responses for each item, excluding "don't know" and "not applicable" responses and instances where the question was skipped.
Based on the RCF Resident Satisfaction Survey 2022-23, Final Results
Does the menu change often enough?
This facility83/100
Ohio average77/100
Do you look forward to mealtimes?
This facility83/100
Ohio average80/100
Do you get enough to eat here?
This facility100/100
Ohio average95/100
Do you get enough fresh food options here?
This facility100/100
Ohio average81/100
Do you have input on the food that is served?
This facility100/100
Ohio average68/100
Do you like the food here?
This facility100/100
Ohio average81/100
Scores represent percent of positive resident responses for each item, excluding "don't know" and "not applicable" responses and instances where the question was skipped.
Ohio average 6.7
Last Health inspection on Jan 2025
Ohio average 30.9
Ohio average 4.59
Health citations are formal notices following inspections when they fail to comply with safety and care standards.
7 of 22 citations resulted from standard inspections; 12 of 22 resulted from complaint investigations; and 3 of 22 came from combined inspections (standard and complaint).
Ohio average: 0.3
Ohio average: 0.9
Reporting period: October 1 – December 31, 2025 (Q4 2025). Source: CMS Payroll-Based Journal report.
Manages medical care and health needs.
Assists with medical care and medications.
Helps with daily care and mobility.
Total hours from contractors
8,530 contractor hours this quarter
| Certified Nursing Assistant | 49 | 143 | 192 | 12,893 | 92 | 100% | 8.4 |
| RN Director of Nursing | 20 | 0 | 20 | 5,712 | 92 | 100% | 10.5 |
| Other Dietary Services Staff | 5 | 0 | 5 | 1,859 | 91 | 99% | 7.9 |
| Registered Nurse | 5 | 18 | 23 | 1,681 | 92 | 100% | 10.3 |
| Licensed Practical Nurse | 0 | 41 | 41 | 1,618 | 80 | 87% | 8.2 |
| Respiratory Therapy Technician | 0 | 4 | 4 | 925 | 74 | 80% | 7 |
| Nurse Practitioner | 1 | 0 | 1 | 520 | 65 | 71% | 8 |
| Dietitian | 1 | 0 | 1 | 512 | 64 | 70% | 8 |
| Mental Health Service Worker | 1 | 0 | 1 | 512 | 64 | 70% | 8 |
| Speech Language Pathologist | 0 | 4 | 4 | 471 | 67 | 73% | 6.4 |
| Physical Therapy Aide | 0 | 3 | 3 | 455 | 72 | 78% | 5.9 |
| Physical Therapy Assistant | 0 | 3 | 3 | 455 | 64 | 70% | 7 |
| Qualified Social Worker | 0 | 2 | 2 | 437 | 65 | 71% | 6.7 |
| Occupational Therapy Aide | 1 | 1 | 2 | 392 | 51 | 55% | 6.5 |
| Administrator | 1 | 0 | 1 | 192 | 24 | 26% | 8 |
| Medical Director | 0 | 1 | 1 | 104 | 13 | 14% | 8 |
| Occupational Therapy Assistant | 0 | 1 | 1 | 26 | 13 | 14% | 2 |
| Clinical Nurse Specialist | 1 | 0 | 1 | 16 | 2 | 2% | 8.2 |
Federal penalties imposed by CMS for regulatory violations, including civil money penalties (fines) and denials of payment for new Medicare/Medicaid admissions.
Source: CMS Penalties Database
No penalties in the past 3 years
No civil money penalties or payment denials were reported in the last 3 years.
These measures show how residents usually do over time at this home, based on health outcomes and preventive care.
Ohio average: 5.8
Ohio average: 12.7
Ohio average: 6.8%
Ohio average: 8.9%
Ohio average: 22.0%
Ohio average: 3.4%
Ohio average: 3.9%
Ohio average: 0.5%
Ohio average: 6.2%
Ohio average: 24.0%
Ohio average: 8.4%
Ohio average: 92.4%
Ohio average: 94.5%
Ohio average: 78.0%
Ohio average: 1.3%
Ohio average: 75.6%
Ohio average: 25.1%
Ohio average: 12.5%
Ohio average: 0.8%
Ohio average: 53.7%
Ohio average: 50.6%
Quality measures are calculated from Minimum Data Set (MDS) assessments. For most measures, lower percentages indicate better care quality.
29% of new residents, usually for short-term rehab.
47% of new residents, often for short stays.
24% of new residents, often for long-term daily care.
Source: CMS Long-Term Care Facility Characteristics (Data as of Jan 2026)
Residents meet regularly to discuss policies, care quality, and activities
Organized group of residents that meets regularly to discuss facility policies, quality of life, and activities.
Data sourced from CMS Long-Term Care Facility Characteristics quarterly report. Payer mix reflects the current resident census by primary payment source.
Historical financial and operational data for Saint Margaret Hall from 2011–2022, based on CMS SNF Cost Reports.
Key figures below are for fiscal year ending in 10/2022 — the home's most recent complete cost report, an older period than most facilities report.
Based on the home's most recent complete CMS SNF Cost Report — fiscal year ending in 10/2022. This is an older period than most facilities report, so compare with that in mind.
No pets allowed
Building Type: Mid-rise
This home supports both short-term rehab and long-term care, with residents staying for a wide range of durations.
New residents most often arrive under private pay (47% of admissions), and a typical private pay stay runs around 10 months.
Coverage residents most often arrive under.
Coverage residents most often leave under.
![]() 3.2 miles from city center
3.2 miles from city center
![]() Estimated distance in miles from Cincinnati's city center to Saint Margaret Hall's address, calculated via Google Maps.
— 0.83 miles to nearest hospital (The Timothy Freeman, MD, Center for Developmental Disabilities)
Estimated distance in miles from Cincinnati's city center to Saint Margaret Hall's address, calculated via Google Maps.
— 0.83 miles to nearest hospital (The Timothy Freeman, MD, Center for Developmental Disabilities)
Add your location
Info below is compiled from CMS reports & the OH Dept. of Health, senior community websites & trusted data sources such as Walk Score & BBB.
Communities are listed from highest to lowest based on our ranking methodology.
| Alois Alzheimer Center | NH HOS MC PC RC SNF | Cincinnati (Greenhills) | 93
Facility
93
OH AVG
75
Rank
#92 / 309 |
82.8%
Facility
82.8%
OH AVG
81.7
Rank
#86 / 138 | +1% | 4.12
Facility
4.12
OH AVG
3.54
Rank
#36 / 182 | -31% | +16% | $0
Facility
$0
OH AVG
$74.0k
Rank
#1 / 183 | 7
Facility
7
OH AVG
30.9
Rank
#14 / 183 | 3.5
Facility
3.5
OH AVG
4.6
Rank
#58 / 183 | - | 77 | - |
49
Facility
49
OH AVG
40
Rank
#263 / 704 | Boymel Operations Holdings Co LLC | $7.5MFiscal year ending 12/2023
Facility
$7.5MFiscal year ending 12/2023
OH AVG
$10.1M
Rank
#136 / 183 | $4.6MFiscal year ending 12/2023
Facility
$4.6MFiscal year ending 12/2023
OH AVG
$3.9M
Rank
#111 / 183 | 61.4%Fiscal year ending 12/2023
Facility
61.4%Fiscal year ending 12/2023
OH AVG
40.2%
Rank
#21 / 183 | 366489 | ||||
| Twin Towers | NH AL IL MC SNF | Cincinnati (College Hill) | 231
Facility
231
OH AVG
75
Rank
#1 / 309 |
31.2%
Facility
31.2%
OH AVG
81.7
Rank
#138 / 138 | -62% | 5.44
Facility
5.44
OH AVG
3.54
Rank
#8 / 182 | -14% | +54% | $0
Facility
$0
OH AVG
$74.0k
Rank
#1 / 183 | 13
Facility
13
OH AVG
30.9
Rank
#35 / 183 | 4.3
Facility
4.3
OH AVG
4.6
Rank
#99 / 183 | - | 72 | - |
31
Facility
31
OH AVG
40
Rank
#432 / 704 | Douglas Burgess | $10.7MFiscal year ending 12/2023
Facility
$10.7MFiscal year ending 12/2023
OH AVG
$10.1M
Rank
#38 / 183 | $5.8MFiscal year ending 12/2023
Facility
$5.8MFiscal year ending 12/2023
OH AVG
$3.9M
Rank
#63 / 183 | 54.5%Fiscal year ending 12/2023
Facility
54.5%Fiscal year ending 12/2023
OH AVG
40.2%
Rank
#163 / 183 | 366023 | ||||
| Beechwood Home | NH HOS SNF | Cincinnati (Evanston) | 80
Facility
80
OH AVG
75
Rank
#134 / 309 |
90.3%
Facility
90.3%
OH AVG
81.7
Rank
#41 / 138 | +10% | 4.61
Facility
4.61
OH AVG
3.54
Rank
#14 / 182 | -18% | +30% | $0
Facility
$0
OH AVG
$74.0k
Rank
#1 / 183 | 13
Facility
13
OH AVG
30.9
Rank
#35 / 183 | 3.3
Facility
3.3
OH AVG
4.6
Rank
#51 / 183 | - | 72 | - |
56
Facility
56
OH AVG
40
Rank
#186 / 704 | William Baechtold | $8.1MFiscal year ending 12/2023
Facility
$8.1MFiscal year ending 12/2023
OH AVG
$10.1M
Rank
#32 / 183 | $6.6MFiscal year ending 12/2023
Facility
$6.6MFiscal year ending 12/2023
OH AVG
$3.9M
Rank
#38 / 183 | 81.2%Fiscal year ending 12/2023
Facility
81.2%Fiscal year ending 12/2023
OH AVG
40.2%
Rank
#116 / 183 | 365445 | ||||
| Deupree House | NH AL IL MC | Cincinnati (Hyde Park) | 24
Facility
24
OH AVG
75
Rank
#285 / 309 |
82.9%
Facility
82.9%
OH AVG
81.7
Rank
#85 / 138 | +1% | 7.25
Facility
7.25
OH AVG
3.54
Rank
#1 / 182 | -4% | +105% | $0
Facility
$0
OH AVG
$74.0k
Rank
#1 / 183 | 12
Facility
12
OH AVG
30.9
Rank
#29 / 183 | 4.0
Facility
4.0
OH AVG
4.6
Rank
#81 / 183 | - | 20 | - |
44
Facility
44
OH AVG
40
Rank
#322 / 704 | Emerson Stambaugh | $3.8MFiscal year ending 12/2023
Facility
$3.8MFiscal year ending 12/2023
OH AVG
$10.1M
Rank
#163 / 183 | $2.7MFiscal year ending 12/2023
Facility
$2.7MFiscal year ending 12/2023
OH AVG
$3.9M
Rank
#158 / 183 | 70.7%Fiscal year ending 12/2023
Facility
70.7%Fiscal year ending 12/2023
OH AVG
40.2%
Rank
#40 / 183 | 366386 | ||||
| Saint Margaret Hall | NH AL HOS PC RC SNF | Cincinnati (East Walnut Hills) | 99
Facility
99
OH AVG
75
Rank
#69 / 309 |
73.7%
Facility
73.7%
OH AVG
81.7
Rank
#111 / 138 | -10% | 3.64
Facility
3.64
OH AVG
3.54
Rank
#73 / 182 | -19% | +3% | $0
Facility
$0
OH AVG
$74.0k
Rank
#1 / 183 | 22
Facility
22
OH AVG
30.9
Rank
#69 / 183 | 3.7
Facility
3.7
OH AVG
4.6
Rank
#71 / 183 | - | 73 | A+ |
74
Facility
74
OH AVG
40
Rank
#53 / 704 | Katherine Will | $6.8M*Fiscal year ending 10/2022These figures are from this home's most recent complete cost report — an older period than most facilities report. Compare with that in mind.
Facility
$6.8M*Fiscal year ending 10/2022These figures are from this home's most recent complete cost report — an older period than most facilities report. Compare with that in mind.
OH AVG
$10.1M
Rank
#123 / 183 | $5.3M*Fiscal year ending 10/2022These figures are from this home's most recent complete cost report — an older period than most facilities report. Compare with that in mind.
Facility
$5.3M*Fiscal year ending 10/2022These figures are from this home's most recent complete cost report — an older period than most facilities report. Compare with that in mind.
OH AVG
$3.9M
Rank
#44 / 183 | 79%*Fiscal year ending 10/2022These figures are from this home's most recent complete cost report — an older period than most facilities report. Compare with that in mind.
Facility
79%*Fiscal year ending 10/2022These figures are from this home's most recent complete cost report — an older period than most facilities report. Compare with that in mind.
OH AVG
40.2%
Rank
#4 / 183 | 365733 |
Saint Margaret Hall is located in Cincinnati, Ohio.
Here are the financial assistance programs available to residents in Ohio.
Saint Margaret Hall is in the East Walnut HIlls neighborhood of Cincinnati.
Saint Margaret Hall has a walk score of 74. Very walkable. Most errands can be accomplished on foot, and many essentials are within a short walk.
Saint Margaret Hall's occupancy is 51.7%.
No, Saint Margaret Hall has a no-pet policy.
The team at Saint Margaret Hall can be reached at BBURNS@STMARGARETHALL.COM.
Saint Margaret Hall is registered as a for-profit in OH.
Saint Margaret Hall has had 6 reported citations since 2018 according to records from Ohio Department of Aging (ODA).
Care Cost Calculator: See Prices in Your Area
Nursing Home Data Explorer
Don’t Wait Too Long: 7 Red Flag Signs Your Parent Needs Assisted Living Now
The True Cost of Assisted Living in 2025 – And How Families Are Paying For It
Understanding Senior Living Costs: Pricing Models, Discounts & Financial Assistance


