Salaam Estates II
Nursing Home & Assisted Living · Maryland, MD
CMS overall rating Info The Overall CMS Rating is scored from 1 to 5 stars and combines results from health inspections, staffing levels, and quality measures. Health inspections carry the most weight. Staffing and quality scores can increase or decrease the final rating based on performance compared to state and national standards.

Salaam Estates II

Nursing Home & Assisted Living · Maryland, MD
CMS overall rating Info The Overall CMS Rating is scored from 1 to 5 stars and combines results from health inspections, staffing levels, and quality measures. Health inspections carry the most weight. Staffing and quality scores can increase or decrease the final rating based on performance compared to state and national standards.
Calculator: See prices in your area
Salaam Estates II accepts Medicare, Medicaid, and private pay.

Overview of Salaam Estates Ii

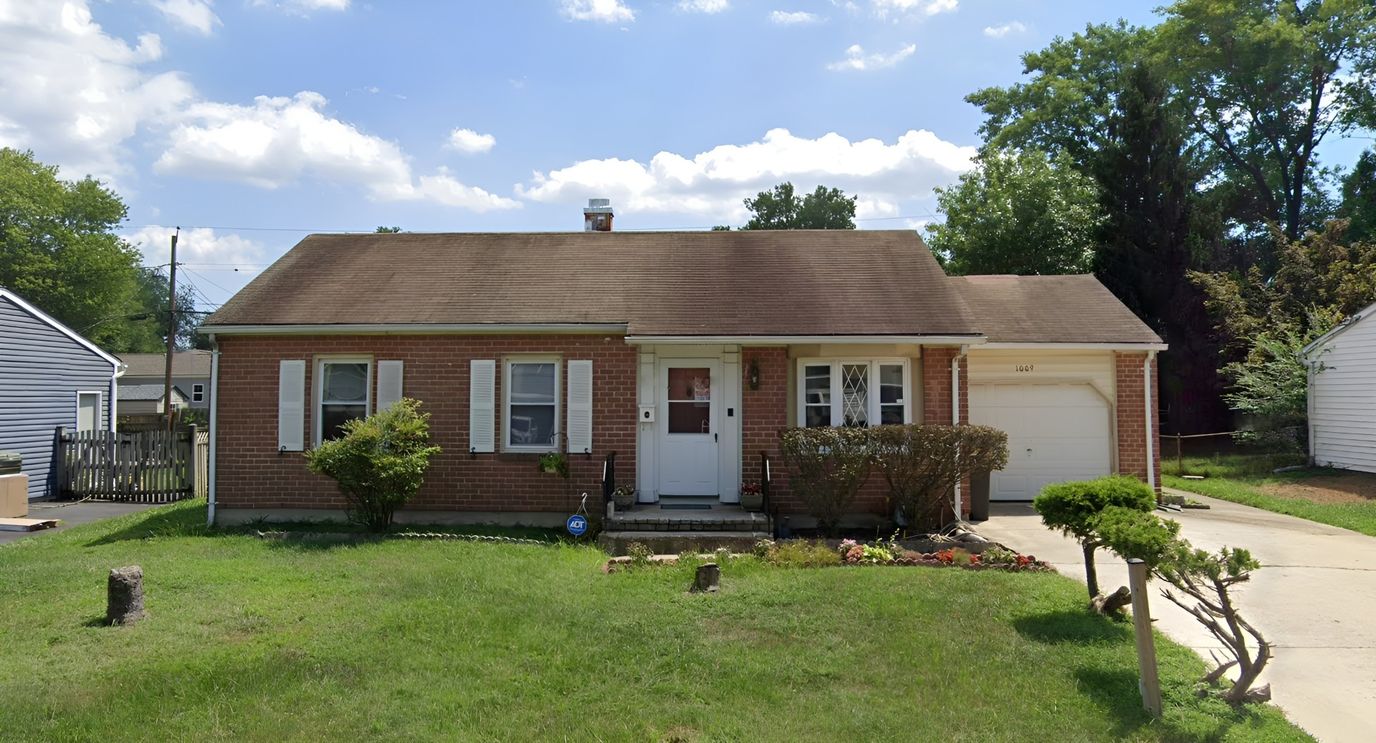
Conveniently located in the thriving setting of Glen Burnie, MD, Salaam Estates Ii is an outstanding community that offers assisted living. With a compassionate and highly trained team available around the clock, residents can receive top-tier care tailored to their daily living activities and personal needs. Purposely built and secure accommodations are also provided, ensuring residents are comfortable and safe.

Residents will not run out of things to do for leisure and wellness with a carefully planned calendar of fun exercises and enriching events. Mealtimes also promote social interactions with a delightful dining experience that caters to their dietary needs and preferences. The community is ideal for those needing assistance to make the most of their best years.

(443) 310-6710

Quality ratings

Measured by Centers for Medicare & Medicaid Services (CMS)

Overall rating Info The Overall CMS Rating combines results from health inspections, staffing levels and quality measures. Health inspections carry the most weight. Staffing and quality scores can increase or decrease the final rating based on performance compared to state and national standards.
At MD avg. At MD avg.Click the badge to see the full State ranking.Click here to see the full State ranking.
Health Inspection Info Based on the results of the facility's three most recent standard inspections and any complaint investigations. CMS reviews the number, scope, and severity of deficiencies, with more recent findings weighted more heavily.
▲ 6.5% Above MD avg. ▲ 6.5% Above MD avg.Click the badge to see the full State ranking.Click here to see the full State ranking.
Staffing Info Measures average nursing staff hours per resident per day, including Registered Nurses (RNs) and total nursing staff. Ratings are adjusted based on the level of care residents require and are compared to state and national benchmarks.
▲ 31.3% Above MD avg. ▲ 31.3% Above MD avg.Click the badge to see the full State ranking.Click here to see the full State ranking.
Quality Measures Info Based on clinical and physical health indicators reported to CMS, such as hospital readmissions, falls, pressure ulcers, and improvements in mobility. These measures reflect how well residents' health needs are being managed.
▼ 18.8% Below MD avg. ▼ 18.8% Below MD avg.Click the badge to see the full State ranking.Click here to see the full State ranking.

Staffing hours breakdown

Info Daily nursing hours per resident by staff type, reported to CMS. Higher is generally better — compare this facility to state and national averages to see where staffing stands.

Hours per resident per day — compared to Maryland state averages

Total nursing care / resident Info This home is ranked 28th out of 144 homes in Maryland. Total adjusted nursing hours per resident per day, combining RN, LPN, and aide time. CMS adjusts this for case-mix so facilities can be fairly compared.
4h 9m per day
Rank #28 / 144Nurse hours — State benchmarkedThis home is ranked 28th out of 144 homes in Maryland. Shows adjusted nurse hours per resident per day benchmarked to the Maryland average, with a ranking across 144 Maryland SNFs. More hours mean more direct care. The national average is about 3.5 hrs; below 3.0 is a red flag.Click the rank badge to see the full State ranking.Click here to see the full State ranking.
This facility Maryland avg (3h 46m per day)
vs Maryland avg
+10%
Staff typeHours / Day / Residentvs state avg
Total Nursing (Weekend) Info Combined nursing hours (RN + LPN + Nurse Aide) per resident per day on weekends. Staffing often drops on weekends — this figure reveals whether the facility maintains adequate coverage outside of weekday hours. 3h 53m per day

Types of Care at Salaam Estates II

Assisted Living

Capacity and availability

This home usually has availability

Occupancy lower than 85% suggests more openings may be available.

Similar occupancy to the Maryland average: 82.4%
Occupancy rate 82.3% Rank #80 / 145Occupancy rate — State benchmarkedThis home is ranked 80th out of 145 homes in Maryland. Shows this facility's occupancy rate versus the Maryland average, with its Statewide rank out of 145. Higher occupancy signals strong local demand and financial stability.Click the rank badge to see the full State ranking.Click here to see the full State ranking.
Avg. Length of Stay 67 days
Occupancy rate
82.3% Rank #80 / 145Occupancy rate — State benchmarkedThis home is ranked 80th out of 145 homes in Maryland. Shows this facility's occupancy rate versus the Maryland average, with its Statewide rank out of 145. Higher occupancy signals strong local demand and financial stability.Click the rank badge to see the full State ranking.Click here to see the full State ranking.
Avg. Length of Stay
67 days
Walk Score
Walk Score: 23 / 100 Rank #109 / 147Walk Score — State benchmarkedThis home is ranked 109th out of 147 homes in Maryland. Shows how walkable this facility's neighborhood is compared to the average Walk Score across Maryland SNFs. Higher scores benefit residents, families, and staff.Click the rank badge to see the full State ranking.Click here to see the full State ranking.
Car-dependent. Most errands require a car, with limited nearby walkable options.

Contact Salaam Estates II

Staffing Data

Reporting period: October 1 – December 31, 2025 (Q4 2025). Source: CMS Payroll-Based Journal report.

Total staff 303
Employees 148
Contractors 155
Staff to resident ratio 2.73:1
51% better than Maryland average
Maryland average ratio: 1.81:1 Maryland average ratio: 1.81:1See full Maryland ranking
Avg staff/day 77
Average shift 7.6 hours
5% worse than Maryland average
Maryland average: 8 hours Maryland average shift: 8 hoursSee full Maryland ranking
Total staff hours (quarter) 53,806

Nursing staff breakdown

Q4 2025 · Oct 1 – Dec 31 More info This data comes from the CMS Payroll-Based Journal report covering October 1 – December 31, 2025.
Registered Nurse

Manages medical care and health needs.

Total count 49
Average shift length Info Average shift length. Calculated as total hours divided by days worked and average staff per day. 7.9 hours

This role is partially covered by contractors.

Licensed Practical Nurse

Assists with medical care and medications.

Total count 45
Average shift length Info Average shift length. Calculated as total hours divided by days worked and average staff per day. 7.5 hours

This role is partially covered by contractors.

Certified Nursing Assistant

Helps with daily care and mobility.

Total count 135
Average shift length Info Average shift length. Calculated as total hours divided by days worked and average staff per day. 7.6 hours

This role is partially covered by contractors.

Contractor staffing

Q4 2025 · Oct 1 – Dec 31 More info This data comes from the CMS Payroll-Based Journal report covering October 1 – December 31, 2025.

Total hours from contractors

20.4%

10,988 contractor hours this quarter

Certified Nursing Assistant: 76 Licensed Practical Nurse: 29 Registered Nurse: 19 Respiratory Therapy Technician: 9 Speech Language Pathologist: 6 Physical Therapy Aide: 5 Physical Therapy Assistant: 4 Qualified Social Worker: 4 Medication Aide/Technician: 1 Occupational Therapy Assistant: 1 Medical Director: 1

Staff by category

Q4 2025 · Oct 1 – Dec 31 More info This data comes from the CMS Payroll-Based Journal report covering October 1 – December 31, 2025.
Certified Nursing Assistant597613519,87892100%7.6
Registered Nurse3019499,23192100%7.9
Licensed Practical Nurse1629456,10892100%7.5
Other Dietary Services Staff9092,90592100%7.2
Medication Aide/Technician8192,53592100%9.1
RN Director of Nursing6062,1718188%7.9
Clinical Nurse Specialist7071,4559098%7.7
Respiratory Therapy Technician0991,3438188%7.3
Speech Language Pathologist0661,2607683%6.4
Physical Therapy Assistant0441,2338087%7.1
Dental Services Staff3039826571%7.9
Physical Therapy Aide0558656874%6.9
Occupational Therapy Aide2028216470%8.1
Nurse Aide in Training4045685257%6.7
Administrator1015046368%8
Dietitian1014916368%7.8
Nurse Practitioner1014896368%7.8
Qualified Social Worker0444707278%4.8
Mental Health Service Worker1014295863%7.4
Medical Director0113833%12.5
Occupational Therapy Assistant0113233%10.5
135 Certified Nursing Assistant
% of Days 100%
49 Registered Nurse
% of Days 100%
45 Licensed Practical Nurse
% of Days 100%
9 Other Dietary Services Staff
% of Days 100%
9 Medication Aide/Technician
% of Days 100%
6 RN Director of Nursing
% of Days 88%
7 Clinical Nurse Specialist
% of Days 98%
9 Respiratory Therapy Technician
% of Days 88%
6 Speech Language Pathologist
% of Days 83%
4 Physical Therapy Assistant
% of Days 87%
3 Dental Services Staff
% of Days 71%
5 Physical Therapy Aide
% of Days 74%
2 Occupational Therapy Aide
% of Days 70%
4 Nurse Aide in Training
% of Days 57%
1 Administrator
% of Days 68%
1 Dietitian
% of Days 68%
1 Nurse Practitioner
% of Days 68%
4 Qualified Social Worker
% of Days 78%
1 Mental Health Service Worker
% of Days 63%
1 Medical Director
% of Days 3%
1 Occupational Therapy Assistant
% of Days 3%

Penalties and fines

Federal penalties imposed by CMS for regulatory violations, including civil money penalties (fines) and denials of payment for new Medicare/Medicaid admissions.

Source: CMS Penalties Database

No penalties in the past 3 years

No civil money penalties or payment denials were reported in the last 3 years.

Quality of care over time

These measures show how residents usually do over time at this home, based on health outcomes and preventive care.

High-risk clinical events score Info A composite score based on pressure ulcers, falls with injury, weight loss, walking ability decline, and activities of daily living decline. 16.7
29% worse than Maryland average

Maryland average: 12.9

Functional decline score Info A composite score based on activities of daily living decline, walking ability decline, and incontinence. 30.7
19% worse than Maryland average

Maryland average: 25.7

Long-stay resident measures
Need for Help with Daily Activities Increased Info Percent of long-stay residents whose need for help with daily activities has increased 26.2%
11% worse than Maryland average

Maryland average: 23.7%

Walking Ability Worsened Info Percent of long-stay residents whose ability to move independently worsened 39.5%
43% worse than Maryland average

Maryland average: 27.7%

Low Risk Residents with Bowel/Bladder Incontinence Info Percent of low risk long-stay residents who lose control of their bowels or bladder 26.2%
In line with Maryland average

Maryland average: 25.9%

Falls with Major Injury Info Percent of long-stay residents experiencing one or more falls with major injury 4.0%
74% worse than Maryland average

Maryland average: 2.3%

High Risk Residents with Pressure Ulcers Info Percent of long-stay high risk residents with pressure ulcers 8.7%
33% worse than Maryland average

Maryland average: 6.5%

Urinary Tract Infection Info Percent of long-stay residents with a urinary tract infection 2.7%
67% worse than Maryland average

Maryland average: 1.6%

Lost Too Much Weight Info Percent of long-stay residents who lose too much weight 4.9%
15% better than Maryland average

Maryland average: 5.8%

Depressive Symptoms Info Percent of long-stay residents who have depressive symptoms 8.3%
59% better than Maryland average

Maryland average: 20.2%

Antipsychotic Use Info Percent of long-stay residents who received an antipsychotic medication 11.9%
8% better than Maryland average

Maryland average: 12.9%

Pneumococcal Vaccine Info Percent of long-stay residents assessed and appropriately given the pneumococcal vaccine 99.3%
8% better than Maryland average

Maryland average: 92.0%

Influenza Vaccine Info Percent of long-stay residents assessed and appropriately given the seasonal influenza vaccine 100.0%
In line with Maryland average

Maryland average: 96.6%

Short-stay resident measures
Pneumococcal Vaccine Info Percent of short-stay residents assessed and appropriately given the pneumococcal vaccine 97.3%
24% better than Maryland average

Maryland average: 78.4%

Antipsychotic medication increase Info Percent of short-stay residents who newly received an antipsychotic medication 1.2%
16% better than Maryland average

Maryland average: 1.4%

Influenza Vaccine Info Percent of short-stay residents assessed and appropriately given the seasonal influenza vaccine 97.9%
21% better than Maryland average

Maryland average: 80.6%

Breakdown by payment type

Medicare

70% of new residents, usually for short-term rehab.

Typical stay 23 days

Private pay

26% of new residents, often for short stays.

Typical stay 7 - 8 months

Medicaid

4% of new residents, often for long-term daily care.

Typical stay 2 years

Facility Characteristics

Source: CMS Long-Term Care Facility Characteristics (Data as of Jan 2026)

Total residents 111
Medicare
27
24.3% of residents
Medicaid
49
44.1% of residents
Private pay or other
35
31.5% of residents
Programs & Services
Residents Group

Residents meet regularly to discuss policies, care quality, and activities

Family Member Group

Family members meet regularly to discuss policies, care quality, and activities

Nurse Aide Training

State-approved Nurse Aide Training and Competency Evaluation Program on-site

Active Family Council

Organized group of family members that meets regularly to discuss facility policies, resident care, and activities.

Active Resident Council

Organized group of residents that meets regularly to discuss facility policies, quality of life, and activities.

Finances and operations

Privately-owned community
Operated by a business corporation.
Home revenue
$28.8M
Operating loss
-$724.7K
Privately-owned community Operated by a business corporation.
Home revenue
$28.8M Rank #30 / 145Revenue — State benchmarkedThis home is ranked 30th out of 145 homes in Maryland. Shows this facility's annual revenue compared to the Maryland SNF average. Higher revenue generally means more resources for staffing and capital — read alongside Payroll %.Click the rank badge to see the full State ranking.Click here to see the full State ranking.
Operating loss
-$724.7K
Payroll costs Info The portion of the home's budget spent on staff, including nurses, caregivers, and other employees who support care and operations. Rank #40 / 145Payroll — State benchmarkedThis home is ranked 40th out of 145 homes in Maryland. Shows total annual staff payroll benchmarked to the Maryland average. Higher payroll investment relative to peers often signals better staffing and less reliance on cheaper contract labor.Click the rank badge to see the full State ranking.Click here to see the full State ranking.
$10.5M
36.4% of revenue Rank #122 / 145Payroll % — State benchmarkedThis home is ranked 122nd out of 145 homes in Maryland. Shows payroll as a percentage of revenue versus the Maryland average. Well-run Maryland SNFs typically land around 49–57% — the top third Statewide. Below 25% may signal understaffing or heavy agency use — read with Staffing ratings.Click the rank badge to see the full State ranking.Click here to see the full State ranking.
Other operating costs Info All remaining costs needed to run the home, such as food, utilities, building maintenance, supplies and administrative expenses.
$19.0M
Total costs $29.5M

What does this home offer?

Building type icon
Building type icon

Building Type: Single-story

Dining services icon

Dining Services

Housekeeping icon
Housekeeping icon

Housekeeping Services

Social and recreational activities icon

Social and Recreational Activities

Who this home usually serves

TYPE OF STAY

Mostly short-term rehab stays

Most residents typically stay for a few weeks or months before returning home or moving on.

Places of interest near Salaam Estates II

Address 2.5 miles from city center Info Estimated distance in miles from Glen Burnie's city center to Salaam Estates II's address, calculated via Google Maps.

Calculate Travel Distance to Salaam Estates II

Add your location

Address

Financial Assistance for
Nursing Home in Maryland

Salaam Estates II is located in Glen Burnie, Maryland.
Here are the financial assistance programs available to residents in Maryland.

Get Financial aid guidance

Community Options Waiver

Maryland Medicaid Community Options Waiver

Age 65+ or disabled
General Maryland resident, Medicaid- eligible, nursing home-level care need.
Income Limits (2025) ~$2,829/month 300% FBR, individual
Asset Limits $2,000 (individual), $3,000 (couple) (excludes home, car).
MD

High urban demand; rural outreach efforts.

Benefits
Personal care (5-7 hours/day, e.g., bathing, dressing) Respite care (up to 240 hours/year) Adult day care ($70/day) Home modifications ($1,500 avg.)

Senior Care Program

Maryland Senior Care

Age 65+
General Maryland resident, at risk of nursing home placement.
Income Limits ~$2,000/month individual, varies by county
Asset Limits $11,000 individual
MD

Limited funding; waitlists common in high-demand areas.

Benefits
In-home care (3-5 hours/week) Respite care (up to 10 days/year) Meals (~$6/meal) Transportation (~5 trips/month) Case management

Maryland Nursing Home Medicaid

Maryland Medical Assistance (Medicaid) Nursing Home Program

Age 65+
General Maryland resident, Medicaid-eligible, requires nursing home-level care.
Income Limits (2025) $943/month (individual); most income applied to care costs.
Asset Limits $2,500 (individual), $3,000 (couple); spousal protections up to $155,356.
MD

Home equity limit $636,000; estate recovery applies post-55.

Benefits
24/7 nursing care Meals Therapy Medications (unlimited per medical need)

Senior Assisted Living Subsidy Program

Maryland Senior Assisted Living Group Home Subsidy

Age 62+
General Maryland resident, in or moving to approved assisted living, low/moderate income.
Income Limits (2025) ~$34,000/year individual, varies by county
Asset Limits Not strict; prioritizes low-income.
MD

Not available statewide; facility must be licensed by MDH.

Benefits
Personal care Meals 24-hour supervision (up to $1,500/month subsidy typical)

Veterans Aid and Attendance (A&A) Benefit

Maryland VA Aid and Attendance

Age
General Wartime veteran/spouse, age 65+ or disabled, needs ADL help, Maryland resident.
Income Limits (2025) Net income minus medical expenses < $1,984/month individual with A&A
Asset Limits $155,356 net worth limit
MD

High veteran population in suburban/rural areas.

Benefits
Cash benefit ($1,478-$2,471/month, varies by status) for care costs

Senior Prescription Drug Assistance Program (SPDAP)

Maryland Senior Prescription Drug Assistance Program

Age 65+
General Maryland resident (6+ months), Medicare Part D enrolled.
Income Limits (2025) $48,560/year individual, 300% FPL
Asset Limits None specified.
MD

Supplements Medicare Part D; annual enrollment required.

Benefits
Up to $40/month premium subsidy Reducing drug costs

Medicare Savings Programs (MSP)

Maryland Medicare Savings Programs

Age 65+
General Maryland resident, Medicare Part A/B enrollee.
Income Limits (2025) $2,014/month (QMB), $2,706/month (SLMB/QI, individual).
Asset Limits $9,090 (individual), $13,630 (couple).
MD

Includes QMB, SLMB, QI categories.

Benefits
Covers premiums (up to $174.70/month Part B) Co-pays Deductibles

Community Personal Assistance Services (CPAS)

Maryland Medicaid Community Personal Assistance Services

Age 65+
General Maryland resident, Medicaid-eligible, needs ADL assistance.
Income Limits (2025) $943/month (individual); spend-down available.
Asset Limits $2,500 (individual), $3,000 (couple).
MD

Consumer-directed option allows hiring family caregivers.

Benefits
Personal care (hours vary, typically 20-30/week) Chores Nurse supervision

Compare Nursing Home around Glen Burnie

The information below is reported by the Maryland Department of Health, Office of Health Care Quality.

2 facilities compared · CMS & MD Dept. of Health data

Filter by care type
A&E HOMECARE II
NH

Nursing Home Licensed facility providing 24/7 skilled nursing care for residents with complex, ongoing medical needs. Staffed by RNs, LPNs, and CNAs. Inspected and star-rated annually by CMS. Accepts Medicare (short-term rehab) and Medicaid (long-term care).

AL

Assisted Living A licensed, long-term care setting for seniors or individuals with disabilities who need help with daily activities — like bathing, dressing, and medication management — but not 24-hour skilled nursing. Offers housing, meals, and around-the-clock support while aiming to maximize resident independence.

MC

Memory Care Secured, specialized care for people living with Alzheimer's or dementia. Staff trained in cognitive impairment, with higher staff-to-resident ratios and an environment designed to reduce confusion and wandering risk.

Glen Burnie5 87.2% +6%3.03 +100%-20%$28.9k489.62179 38 Alvin Power Family, LLC$31.6M$17.7M55.9%215219
Salaam Estates II
NH

Nursing Home Licensed facility providing 24/7 skilled nursing care for residents with complex, ongoing medical needs. Staffed by RNs, LPNs, and CNAs. Inspected and star-rated annually by CMS. Accepts Medicare (short-term rehab) and Medicaid (long-term care).

AL

Assisted Living A licensed, long-term care setting for seniors or individuals with disabilities who need help with daily activities — like bathing, dressing, and medication management — but not 24-hour skilled nursing. Offers housing, meals, and around-the-clock support while aiming to maximize resident independence.

Glen Burnie (Suburbia)222 82.3% 0%4.15 +23%+10%$05911.8-115 23 Mary Mangione$28.8M$10.5M36.4%215341

Frequently Asked Questions about Salaam Estates II

What neighborhood is Salaam Estates II in?

Salaam Estates II is in the Suburbia neighborhood.

Is Salaam Estates II in a walkable area?

Salaam Estates II has a walk score of 23. Car-dependent. Most errands require a car, with limited nearby walkable options.

What is the address of Salaam Estates II?

Salaam Estates II is located at 1009 Dumbarton Road, Glen Burnie, MD 21060.

What is the phone number of Salaam Estates II?

(443) 310-6710 will put you in contact with the team at Salaam Estates II.

Is Salaam Estates II Medicare or Medicaid certified?

Yes — Salaam Estates II is a CMS-certified provider of Medicare and Medicaid.

Guides for Better Senior Living

Care Cost Calculator: See Prices in Your Area

Nursing Home Data Explorer

Don’t Wait Too Long: 7 Red Flag Signs Your Parent Needs Assisted Living Now

The True Cost of Assisted Living in 2025 – And How Families Are Paying For It

Understanding Senior Living Costs: Pricing Models, Discounts & Financial Assistance

Explore Open Rooms
1 Contact details
2 What type of senior care service are you looking for?
3 What budget do you have in mind for senior care?
4 How soon do you need to find care?
5 Additional details

Thank you for your interest!

Our team will be in touch shortly to help with next steps.