Total health inspections
33
California average 12.5
Last Health inspection on Aug 2025

We arrange tours, appointments, and even moving support so you don’t have to
Thank you for your interest!
Our team will be in touch shortly to help with next steps.
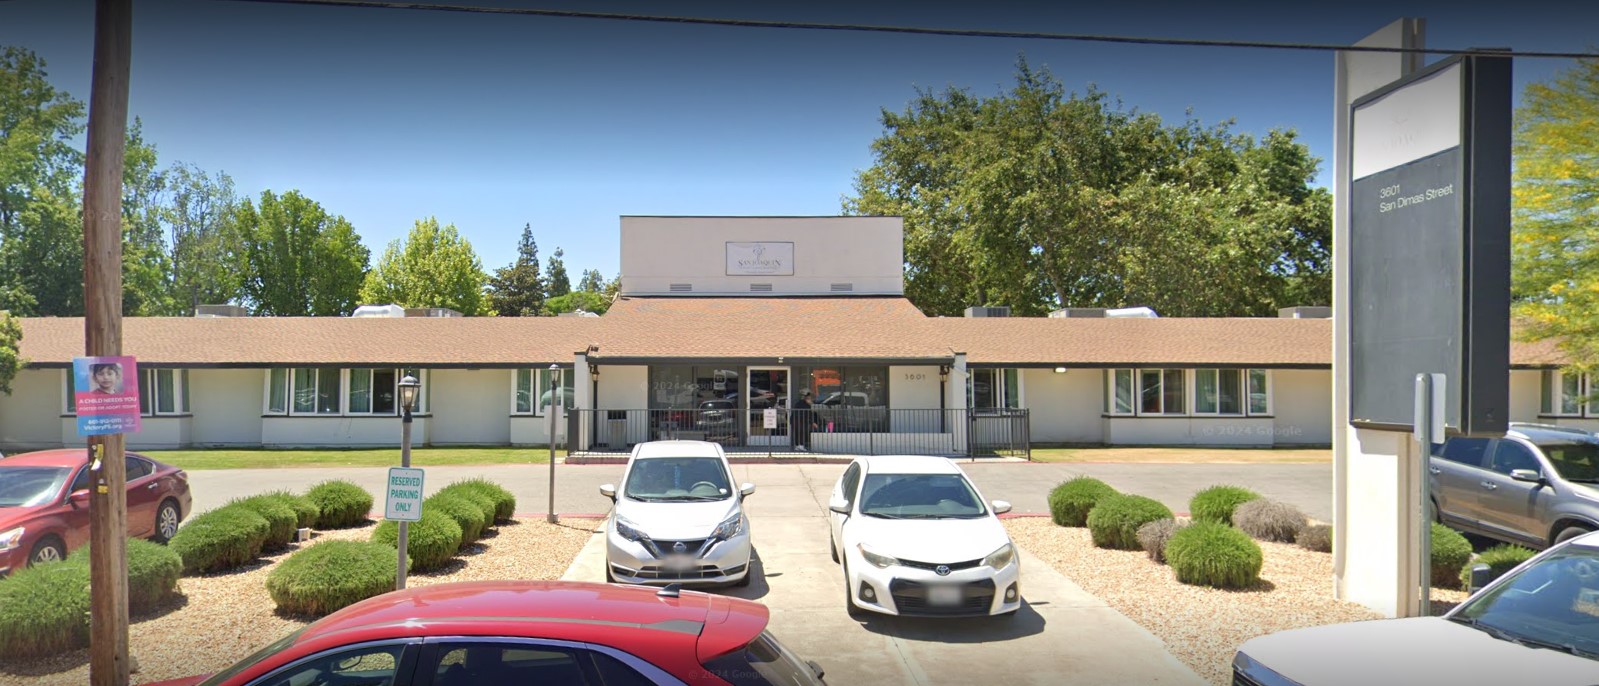
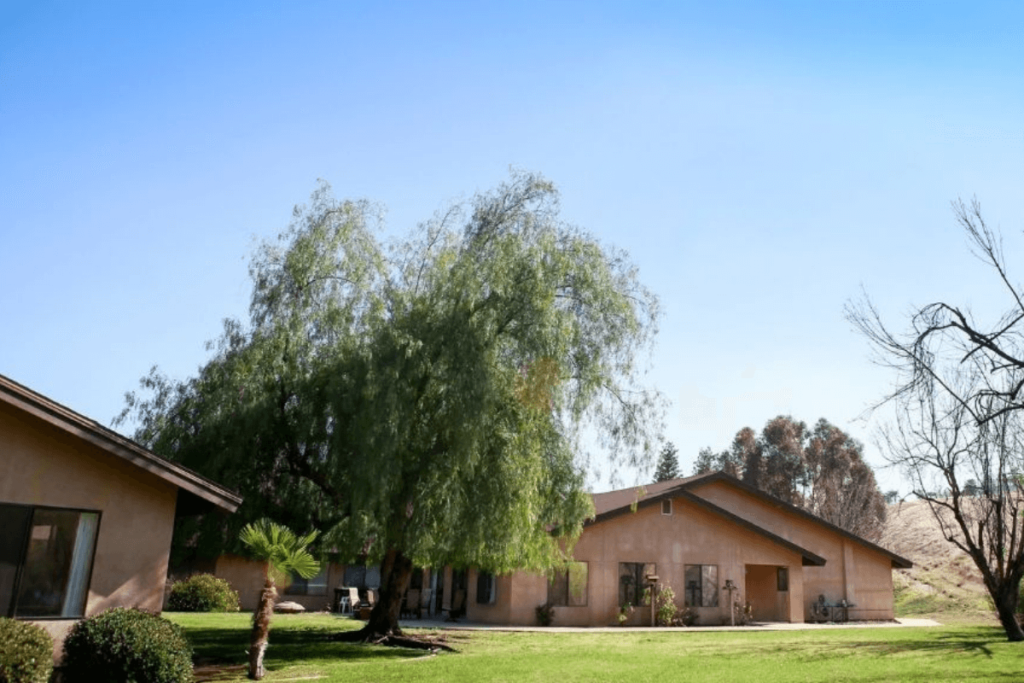
Located in the neighborhood of Bakersfield, CA, San Joaquin Nursing and Rehabilitation Center is a compassionate senior care provider, offering skilled nursing and short-term rehabilitation services. Designed to help residents recover successfully from their conditions or hospitalization, the community provides a reliable and compassionate team of caregivers and nurses that oversee residents’ personalized care plans. Offering access to physical, occupational, speech, and respiratory therapies, the community ensures residents are able to maintain or regain their strength and functionality.
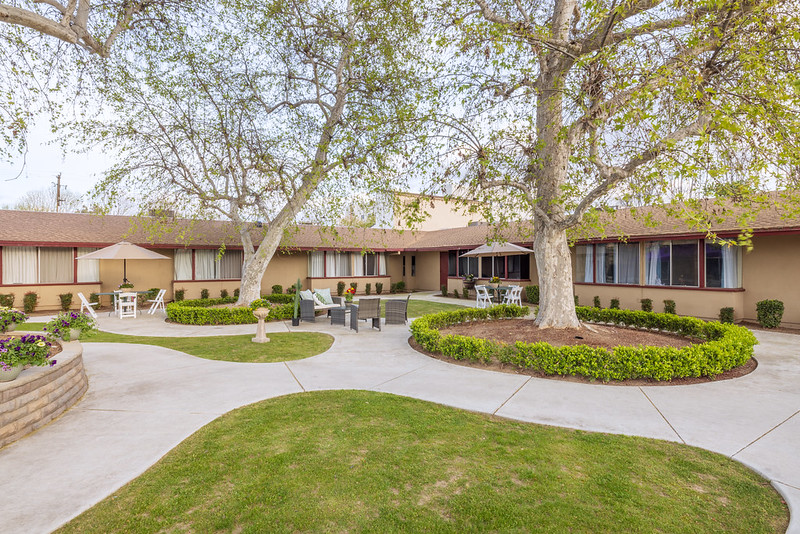
Residents here are also offered an engaging daily schedule of activities to keep them motivated, happy, and entertained as they go through their recovery journey. Spacious common areas and refreshing courtyards are also available to give residents a serene space for connecting with others or enjoying their free time idylling around. The community also offers help and support to residents and families to prepare for life after discharge, making sure they transition back to their usual routines smoothly.
May offer a more intimate, personalized care environment.
Occupancy is moderate, suggesting balanced demand.
Residents typically stay for brief periods, with frequent admissions and discharges throughout the year.
29% of new residents, usually for short-term rehab.
66% of new residents, often for short stays.
5% of new residents, often for long-term daily care.
Accept Medicaid: Yes
Total Residents: 99
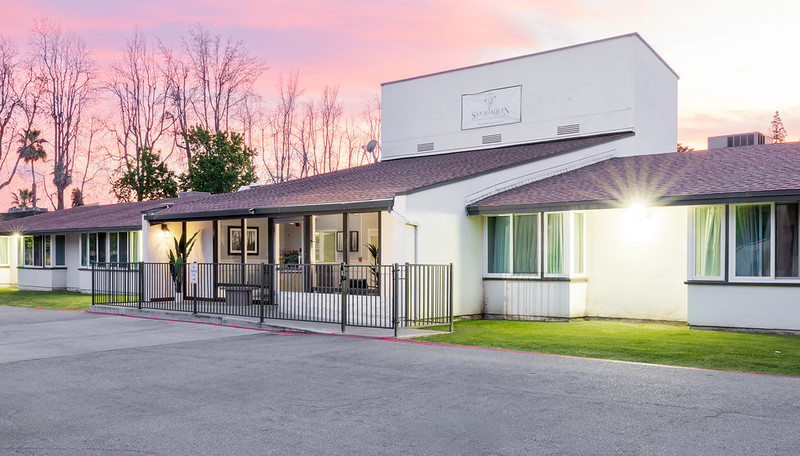
Building Type: Single-story
In California, the Department of Social Services (for assisted living facilities) and the Department of Public Health (for nursing homes) conduct inspections to ensure resident safety and regulatory compliance.
California average 12.5
Last Health inspection on Aug 2025
California average 50.2
California average 4.65
Health citations are formal notices following inspections when they fail to comply with safety and care standards.
45 of 87 citations resulted from standard inspections; and 42 of 87 resulted from complaint investigations.
California average: 0.4
California average: 1
Data sourced from CMS Health Deficiencies reports. Citation severity codes range from A (least serious) to L (most serious). Immediate Jeopardy (J-L) citations indicate situations where the facility's noncompliance has placed residents at risk of death or serious harm.
Assisted Living A licensed, long-term care setting for seniors or individuals with disabilities who need help with daily activities — like bathing, dressing, and medication management — but not 24-hour skilled nursing. Offers housing, meals, and around-the-clock support while aiming to maximize resident independence.
Independent Living Lifestyle-focused communities for older adults offering dining, activities, and transportation with minimal personal care. Best for active, independent seniors who want community without medical support.
Memory Care Secured, specialized care for people living with Alzheimer's or dementia. Staff trained in cognitive impairment, with higher staff-to-resident ratios and an environment designed to reduce confusion and wandering risk.
Nursing Home Licensed facility providing 24/7 skilled nursing care for residents with complex, ongoing medical needs. Staffed by RNs, LPNs, and CNAs. Inspected and star-rated annually by CMS. Accepts Medicare (short-term rehab) and Medicaid (long-term care).
Nursing Home Licensed facility providing 24/7 skilled nursing care for residents with complex, ongoing medical needs. Staffed by RNs, LPNs, and CNAs. Inspected and star-rated annually by CMS. Accepts Medicare (short-term rehab) and Medicaid (long-term care).
Assisted Living A licensed, long-term care setting for seniors or individuals with disabilities who need help with daily activities — like bathing, dressing, and medication management — but not 24-hour skilled nursing. Offers housing, meals, and around-the-clock support while aiming to maximize resident independence.
![]() 2.0 miles from city center
2.0 miles from city center
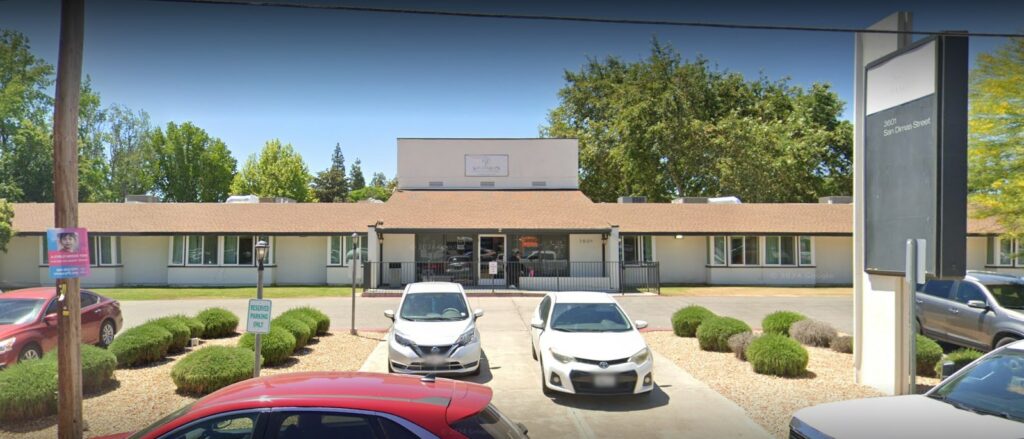
![]() 3601 San Dimas St, Bakersfield, CA 93301
3601 San Dimas St, Bakersfield, CA 93301
Add your location
This data corresponds to Q2 2025 and is based on CMS Payroll-Based Journal.
California average ratio: 0.00:1
California average: 7.7 hours
Manages medical care and health needs.
No contractors work on this role.
Assists with medical care and medications.
No contractors work on this role.
Helps with daily care and mobility.
No contractors work on this role.
Total hours from contractors
0 contractor hours this quarter
No contractor roles were reported this quarter.
| Certified Nursing Assistant | 69 | 0 | 69 | 21,766 | 91 | 100% | 7.3 |
| Licensed Practical Nurse | 29 | 0 | 29 | 9,664 | 91 | 100% | 9.5 |
| Registered Nurse | 7 | 0 | 7 | 1,836 | 91 | 100% | 7.6 |
| Speech Language Pathologist | 7 | 0 | 7 | 1,710 | 89 | 98% | 6 |
| Physical Therapy Assistant | 7 | 0 | 7 | 1,283 | 84 | 92% | 5.7 |
| Physical Therapy Aide | 5 | 0 | 5 | 1,194 | 88 | 97% | 6.4 |
| Other Dietary Services Staff | 3 | 0 | 3 | 1,156 | 91 | 100% | 7.7 |
| RN Director of Nursing | 3 | 0 | 3 | 1,020 | 68 | 75% | 8 |
| Respiratory Therapy Technician | 4 | 0 | 4 | 913 | 78 | 86% | 7.5 |
| Nurse Practitioner | 1 | 0 | 1 | 512 | 64 | 70% | 8 |
| Dental Services Staff | 1 | 0 | 1 | 502 | 65 | 71% | 7.7 |
| Therapeutic Recreation Specialist | 1 | 0 | 1 | 487 | 61 | 67% | 8 |
| Dietitian | 1 | 0 | 1 | 430 | 60 | 66% | 7.2 |
| Qualified Social Worker | 1 | 0 | 1 | 387 | 63 | 69% | 6.1 |
| Administrator | 1 | 0 | 1 | 171 | 64 | 70% | 2.7 |
Source: CMS Long-Term Care Facility Characteristics (Data as of Jan 2026)
Residents meet regularly to discuss policies, care quality, and activities
Part of a Continuing Care Retirement Community offering multiple care levels
Organized group of residents that meets regularly to discuss facility policies, quality of life, and activities.
Data sourced from CMS Long-Term Care Facility Characteristics quarterly report. Payer mix reflects the current resident census by primary payment source.
These measures show how residents usually do over time at this home, based on health outcomes and preventive care.
California average: 6.6
California average: 11.3
California average: 11.1%
California average: 12.0%
California average: 11.3%
California average: 1.7%
California average: 5.0%
California average: 1.2%
California average: 4.2%
California average: 6.7%
California average: 10.1%
California average: 98.5%
California average: 98.2%
California average: 2.25
California average: 1.59
California average: 94.0%
California average: 1.5%
California average: 93.2%
California average: 23.2%
California average: 11.2%
California average: 0.8%
California average: 53.7%
California average: 50.6%
Quality measures are calculated from Minimum Data Set (MDS) assessments. For most measures, lower percentages indicate better care quality.
Federal penalties imposed by CMS for regulatory violations, including civil money penalties (fines) and denials of payment for new Medicare/Medicaid admissions.
Source: CMS Penalties Database (Data as of Jan 2026)
California average: $55K
California average: 2.4
California average: 0.5
Penalties are imposed by CMS for violations of federal nursing home regulations.
Last updated: Jan 2026
Historical financial and operational data for San Joaquin Nursing and Rehabilitation Center based on CMS SNF Cost Reports.
Loading trend charts...
Care Cost Calculator: See Prices in Your Area
Nursing Home Data Explorer
Don’t Wait Too Long: 7 Red Flag Signs Your Parent Needs Assisted Living Now
The True Cost of Assisted Living in 2025 – And How Families Are Paying For It
Understanding Senior Living Costs: Pricing Models, Discounts & Financial Assistance

Touring a community? Use this expert-backed checklist to stay organized, ask the right questions, and find the perfect fit.
We'll send you a PDF version of the touring checklist.