Sandy Springs Center for Nursing and Healing

Nursing Home

Sandy Springs Center for Nursing and Healing

1500 S Johnson Ferry Rd NE, Sandy Springs, GA 30319 View Map
Nursing Home
icon
Care Cost Calculator: See Prices in Your Area Care Cost Calculator: See Prices in Your Area icon
Overview of Sandy Springs Center for Nursing and Healing

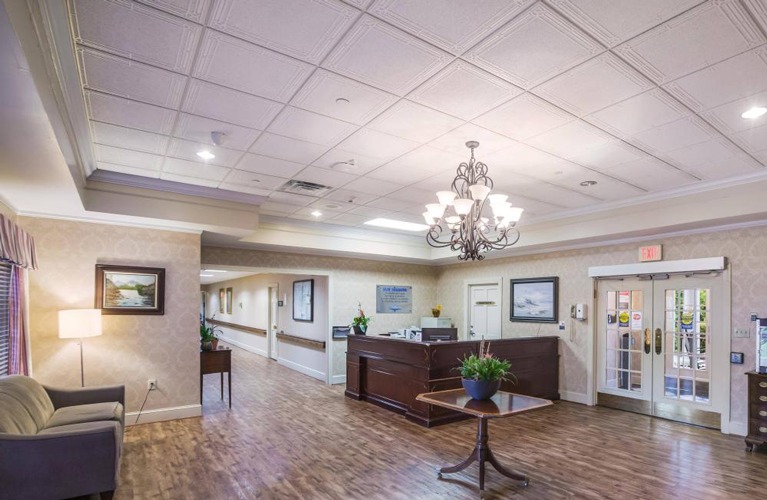
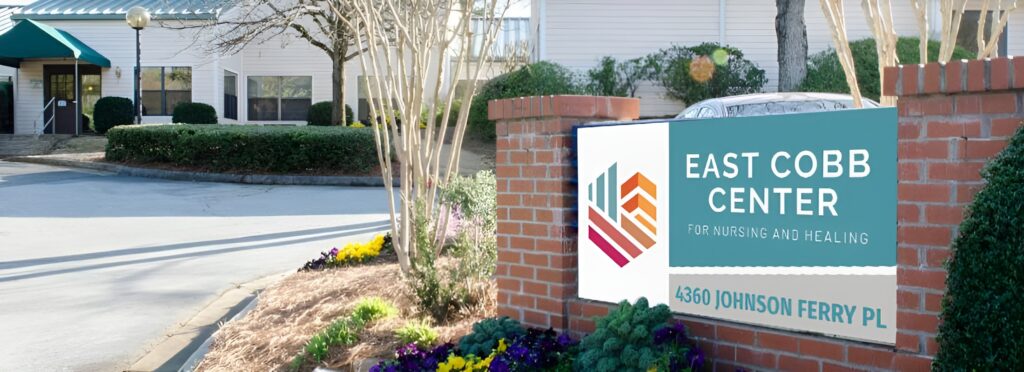
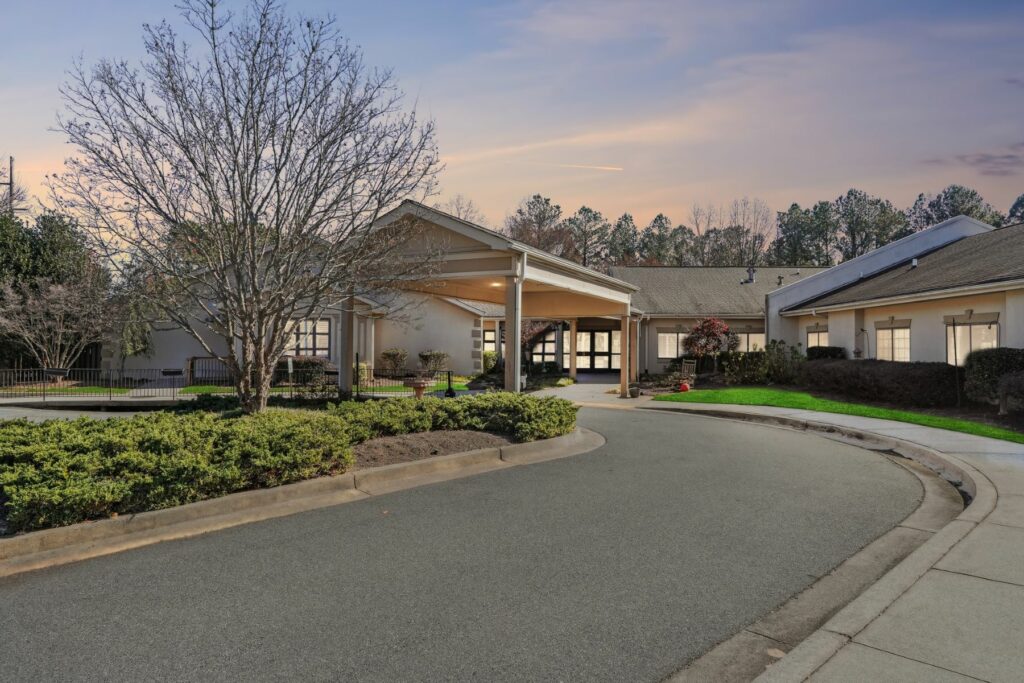
Located near medical providers in Atlanta, GA, Sandy Springs Center for Nursing and Healing is a distinguished community that offers skilled nursing and rehabilitation. The community offers comprehensive care, including diabetic care, wound care, memory care, restorative care, bariatric care, respite care, hospice, and palliative care, ensuring residents can find the care they need to live comfortably in their golden years. With a nurturing and inviting environment, residents feel a sense of belonging in their golden years.

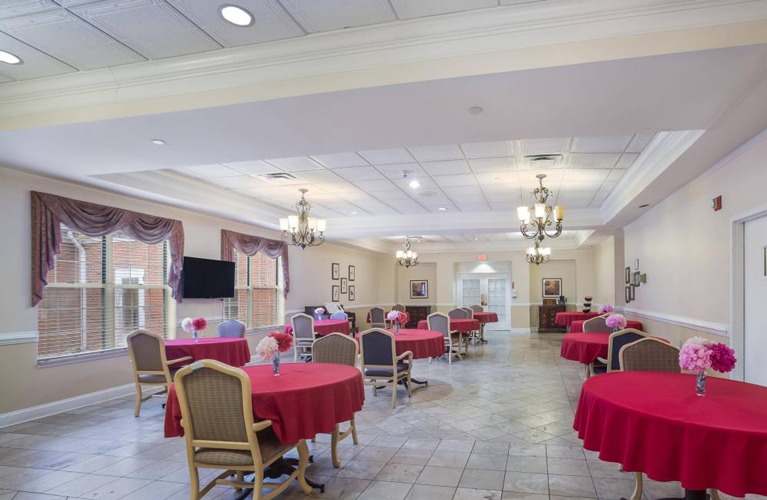
Aside from their healthcare needs, enriching activities and engaging programs are also conducted for residents to remain active and socially engaged. Healthy meals are also necessary for residents’ well-being, so the community serves delightful dining options tailored to their dietary needs and preferences. Enjoy a worry-free retirement with the community’s specially designed amenities and spacious accommodations.

(404) 252-2002

Quality ratings

Measured by Centers for Medicare & Medicaid Services (CMS)

Overall rating Info Official CMS rating based on health inspections, staffing and quality measures.
1/5
Georgia average: 2.6/5
Health Inspection Info Official CMS rating based on deficiencies found during state health inspections.
1/5
Georgia average: 2.8/5
Staffing Info Official CMS rating based on nurse staffing hours per resident per day.
1/5
Georgia average: 2.3/5
Quality Measures Info Official CMS rating based on clinical outcomes for residents.
4/5
Georgia average: 2.8/5

Nursing care per resident

Info Average daily nursing hours per resident (adjusted for acuity). Higher values indicate more nursing time per resident.
3h 3m per day

This home provides 14% less nursing time per resident than the state average.

Georgia average: 3h 33m per day

Staffing hours breakdown

Info Hours of care per resident per day, broken down by staff type. Data from CMS Medicare.
Staff type Facility State avg National avg
Registered Nurse (RN) Info Registered nurse hours per resident per day. 19m per day 30m per day 41m per day
LPN / LVN Info Licensed Practical Nurse / Licensed Vocational Nurse hours per resident per day. 1h 6m per day 56m per day 52m per day
Nurse Aide Info Nurse aide hours per resident per day. 1h 41m per day 2h 9m per day 2h 21m per day
Total Nursing (Weekend) Info Total number of nurse staff hours per resident per day on weekends. 2h 46m per day 3h 6m per day 3h 26m per day
Physical Therapist Info Physical therapist staff hours per resident per day. 7m per day 3m per day 4m per day
RN (Weekend) Info Registered nurse hours per resident per day on weekends. 12m per day 20m per day 29m per day

Capacity and availability

Medium-capacity home

Offers a balance of services and community atmosphere.

Total beds 165

This home usually has limited availability

Occupancy is moderate, suggesting balanced demand.

Similar demand to the Georgia average
Occupancy rate 87.1%
Residents per day (avg) 140
Occupancy rate
87.1%
Residents per day (avg)
140

Who this home usually serves

TYPE OF STAY

Mix of rehab and long-term care

This home supports both short-term rehab and long-term care, with residents staying for a wide range of durations.

Breakdown by payment type

Medicare

39% of new residents, usually for short-term rehab.

Typical stay 1 months

Private pay

46% of new residents, often for short stays.

Typical stay 1 - 2 months

Medicaid

15% of new residents, often for long-term daily care.

Typical stay 10 - 11 months

Finances and operations

Proprietary home
Corporation
Home revenue
$20.8M
Profit
$3.4M
Proprietary home Corporation
Home revenue
$20,785,013.00
Profit
$3,449,451.00
Payroll costs Info The portion of the home's budget spent on staff, including nurses, caregivers, and other employees who support care and operations.
$6.5M
31.5% of revenue
Other operating costs Info All remaining costs needed to run the home, such as food, utilities, building maintenance, supplies and administrative expenses.
$10.8M
Total costs $17.3M
Bed community size
165-bed community
A large-scale community that may provide a wide range of amenities, services, and structured programs.
Years in operation
4 years in operation
An established community with some operational experience and growing routines.
Walk Score
Walk Score: 29 / 100
Somewhat walkable. A few nearby services may be reachable on foot, but most trips require transportation.

About this community

Occupancy Rate
85%
Occupied Beds
141 of 165
Percentage of available beds currently in use by residents.
Facility Type
NURSING HOME
License Date
January 5, 2022

Additional licensing details

CMS Certification Number: 115504
County: DEKALB

What does this home offer?

Accepts Medicaid icon

Accept Medicaid: Yes

Housing options icon

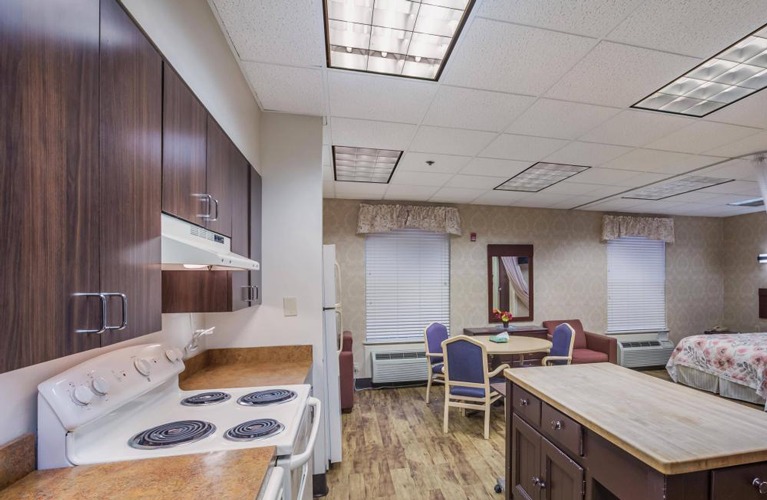
Housing Options: Private / Semi-Private Rooms

Building type icon
Building type icon

Building Type: Single-story

Dining services icon

Dining Services

Beauty services icon

Beauty Services

Housekeeping icon
Housekeeping icon

Housekeeping Services

Recreational activities icon

Recreational Activities

Exercise program icon

Exercise Programs

Types of Care at Sandy Springs Center for Nursing and Healing

Nursing Home
Contact Sandy Springs Center for Nursing and Healing

Inspection History

In Georgia, the Department of Community Health, Healthcare Facility Regulation Division conducts unannounced inspections to ensure facilities adhere to state health and safety requirements.

19 visits/inspections

Latest inspection

Date:June 3, 2025
Type:Plan Of Correction

47 deficiencies

Deficiencies indicate regulatory issues. A higher number implies the facility had several areas requiring improvement.

Compare Nursing Homes around Alpharetta

The information below is reported by the Georgia Department of Community Health, Healthcare Facility Regulation Division.
East Cobb Center for Nursing and Healing
SNF

Nursing Homes 24/7 care needed

Marietta
117
No
63
KARLING LOTT, LINDA
92.0%
$18,393,027.00
$7,071,648.00
38.4%
110.60
4/5
3.3578
4/5
2/5
3/5
-
11
-
+24%
-6%
+18%
Private / Shared Rooms
Cumming Health and Rehab
AL

Assisted Living For seniors needing help with daily tasks but not full-time nursing.

HC

Home Care

HC

Hospice Care

SNF

Nursing Homes 24/7 care needed

Cumming
52
Yes
32
-
17.9%
$3,746,113.00
$1,736,487.00
46.4%
81.60
4/5
4.6976
3/5
3/5
5/5
-
7
-
+130%
+32%
-77%
Private / Semi-Private Rooms
Sandy Springs Center for Nursing and Healing
SNF

Nursing Homes 24/7 care needed

Sandy Springs (North Brookhaven)
165
No
29
PATIL, SHAMA
87.1%
$20,770,652.00
$6,542,977.00
31.5%
139.70
1/5
3.0466
1/5
1/5
4/5
3
32
3
-60%
-14%
+11%
Private / Semi-Private Rooms
Bonterra Transitional Care and Rehabilitation
SNF

Nursing Homes 24/7 care needed

Atlanta (River Park)
118
No
56
WELLINGTON HEALTHCARE SERVICES III, LP
94.7%
$13,935,951.00
$5,313,215.00
38.1%
112.30
1/5
2.9183
1/5
1/5
2/5
5
41
7
-64%
-18%
+21%
Private / Semi-Private Rooms
Buckhead Center for Nursing and Healing
SNF

Nursing Homes 24/7 care needed

Atlanta (Buckhead)
179
No
83
-
-
-
-
-
-
-
-
-
-
-
-
-
-
-
-
-
Private / Semi-Private Rooms

Places of interest near Sandy Springs Center for Nursing and Healing

Address 3.2 miles from city center

Address 1500 S Johnson Ferry Rd NE, Sandy Springs, GA 30319

Calculate Travel Distance to Sandy Springs Center for Nursing and Healing

Add your location

Address

Staffing Data

Source: CMS Payroll-Based Journal (Q2 2025)

307
Total Staff
202
Employees
105
Contractors
54,480
Total Hours (Quarter)
76
Avg Staff/Day
7.9
Avg Shift (hrs)
Nursing Staff Breakdown
Role Count Avg Shift (hrs) Uses Contractors?
Registered Nurse107.4 No
Licensed Practical Nurse1389.4 Yes
Certified Nursing Assistant847.4 No
Staff by Category
Administration
1 staff
7.8hs shift avg
Nursing Staff
237 staff
8.1hs shift avg
Physicians & Practitioners
8 staff
7.9hs shift avg
Therapy Services
44 staff
7.5hs shift avg
Activities & Recreation
2 staff
8hs shift avg
Social Services
7 staff
6.9hs shift avg
Dietary Services
3 staff
7.9hs shift avg
Other Services
5 staff
7.3hs shift avg
Contractor Analysis
7.6%
of total hours from contractors
4,129 contractor hours this quarter
Licensed Practical Nurse: 105
Role Employees Contractors Total Staff Total Hours Days Worked % of Days Avg Shift (hrs)
Certified Nursing Assistant8408421,73891100%7.4
Licensed Practical Nurse3310513814,74991100%9.4
Physical Therapist220226,56891100%7.6
Registered Nurse100101,5478391%7.4
Clinical Nurse Specialist7071,5086976%7.9
Respiratory Therapy Technician6061,4468088%7.3
Physical Therapy Assistant5051,0707077%7.3
Physical Therapy Aide7078967886%7.3
Speech Language Pathologist4048357380%7.3
Other Dietary Services Staff2028047987%7.8
Qualified Social Worker7077696976%6.9
Mental Health Service Worker3036366774%6.8
Dietitian1014966268%8
Dental Services Staff2024964954%8
Administrator1014676066%7.8
Nurse Practitioner1012403033%8
RN Director of Nursing5051143235%3.3
Qualified Activities Professional2021041314%8

Health Inspection History

Inspections
Total health inspections 3

Georgia average 3.4


Last Health inspection on Apr 2025

Total health citations 32
Citations per inspection
10.67

Health citations are formal notices following inspections when they fail to comply with safety and care standards.

6 of 32 citations resulted from standard inspections; and 26 of 32 came from combined inspections (standard and complaint).

Breakdown of citation severity (last 3 years)
Critical Health citations More info 3
329% worse than Georgia average

Georgia average: 0.7


Serious Health citations More info 0
100% better than Georgia average

Georgia average: 0.5

3 critical citations More info Georgia average: 0.7

0 serious citations More info Georgia average: 0.5

28 moderate citations More info Georgia average: 15.2

1 minor citation More info Georgia average: 0.2
Citations history (last 3 years)
Infection Control moderate citation Apr 10, 2025
Corrected

Nutrition moderate citation Apr 10, 2025
Corrected

Quality of Care moderate citation Apr 10, 2025
Corrected

Quality of Care moderate citation Apr 10, 2025
Corrected

Facility Characteristics

Source: CMS Long-Term Care Facility Characteristics (Data as of Jan 2026)

Ownership: For-Profit LLC
Part of: Empire Care Centers
Resident Census by Payment Source
146 Total Residents
Medicare 24 (16.4%)
Medicaid 92 (63%)
Private Pay/Other 30 (20.5%)
Programs & Services
Residents' Group
Family Engagement

Active councils help families stay involved in care decisions and facility operations.

Quality of care over time

These measures show how residents usually do over time at this home, based on health outcomes and preventive care.

High-risk clinical events score Info A composite score based on pressure ulcers, falls with injury, weight loss, walking ability decline, and activities of daily living decline. 10.5
In line with Georgia average

Georgia average: 10.3

Functional decline score Info A composite score based on activities of daily living decline, walking ability decline, and incontinence. 20.8
20% worse than Georgia average

Georgia average: 17.4

Long-stay resident measures
Need for Help with Daily Activities Increased Info Percent of long-stay residents whose need for help with daily activities has increased 19.2%
14% worse than Georgia average

Georgia average: 16.8%

Walking Ability Worsened Info Percent of long-stay residents whose ability to move independently worsened 17.1%
12% better than Georgia average

Georgia average: 19.4%

Low Risk Residents with Bowel/Bladder Incontinence Info Percent of low risk long-stay residents who lose control of their bowels or bladder 26.2%
63% worse than Georgia average

Georgia average: 16.1%

Falls with Major Injury Info Percent of long-stay residents experiencing one or more falls with major injury 1.7%
47% better than Georgia average

Georgia average: 3.2%

High Risk Residents with Pressure Ulcers Info Percent of long-stay high risk residents with pressure ulcers 7.8%
23% worse than Georgia average

Georgia average: 6.3%

Urinary Tract Infection Info Percent of long-stay residents with a urinary tract infection 0.5%
82% better than Georgia average

Georgia average: 2.5%

Lost Too Much Weight Info Percent of long-stay residents who lose too much weight 6.7%
12% worse than Georgia average

Georgia average: 6.0%

Depressive Symptoms Info Percent of long-stay residents who have depressive symptoms 3.8%
56% better than Georgia average

Georgia average: 8.7%

Antipsychotic Use Info Percent of long-stay residents who received an antipsychotic medication 13.8%
28% better than Georgia average

Georgia average: 19.1%

Pneumococcal Vaccine Info Percent of long-stay residents assessed and appropriately given the pneumococcal vaccine 90.2%
In line with Georgia average

Georgia average: 91.5%

Influenza Vaccine Info Percent of long-stay residents assessed and appropriately given the seasonal influenza vaccine 96.0%
In line with Georgia average

Georgia average: 95.0%

Hospitalizations per 1,000 days Info Number of hospitalizations per 1,000 long-stay resident days. 2.35
8% worse than Georgia average

Georgia average: 2.18

ED visits per 1,000 days Info Number of outpatient emergency department visits per 1,000 long-stay resident days. 2.18
11% worse than Georgia average

Georgia average: 1.97

Short-stay resident measures
Pneumococcal Vaccine Info Percent of short-stay residents assessed and appropriately given the pneumococcal vaccine 87.3%
8% better than Georgia average

Georgia average: 80.6%

Antipsychotic medication increase Info Percent of short-stay residents who newly received an antipsychotic medication 0.9%
58% better than Georgia average

Georgia average: 2.2%

Influenza Vaccine Info Percent of short-stay residents assessed and appropriately given the seasonal influenza vaccine 77.4%
In line with Georgia average

Georgia average: 78.2%

Re-hospitalized after SNF stay Info Percentage of short-stay residents who were re-hospitalized after their nursing home admission. 28.1%
16% worse than Georgia average

Georgia average: 24.2%

Emergency department visits Info Percentage of short-stay residents who had an outpatient emergency department visit. 10.4%
15% better than Georgia average

Georgia average: 12.2%

Falls with major injury Info Percentage of SNF residents who experience falls with major injury during their stay. 1.0%
31% worse than Georgia average

Georgia average: 0.8%

Ability to care for self at discharge Info Percentage of residents at or above expected ability to care for themselves at discharge. 80.2%
49% better than Georgia average

Georgia average: 53.7%

Successful return to home or community Info Rate of successful return to home or community from a skilled nursing facility. 57.6%
14% better than Georgia average

Georgia average: 50.6%

Penalties and fines

Federal penalties imposed by CMS for regulatory violations, including civil money penalties (fines) and denials of payment for new Medicare/Medicaid admissions.

Source: CMS Penalties Database (Data as of Jan 2026)

Total fines amount $24K
40% lower than Georgia average

Georgia average: $40K

Number of fines 3
46% more fines than Georgia average

Georgia average: 2.1

Payment Denials Info Serious action where Medicare and/or Medicaid temporarily stops payments for new residents until issues are fixed. 1
252% more payment denials than Georgia average

Georgia average: 0.3

Fines amount comparison
This facility $24K
Georgia average $40K
Penalty History

Penalties are imposed by CMS for violations of federal nursing home regulations.

Civil Money Penalty Info Fines imposed for noncompliance, which can be assessed per day or per instance of violation. May 7, 2023
$6K
Civil Money Penalty Info Fines imposed for noncompliance, which can be assessed per day or per instance of violation. May 7, 2023
$6K
Civil Money Penalty Info Fines imposed for noncompliance, which can be assessed per day or per instance of violation. May 7, 2023
$11K
Payment Denial Info Serious action where Medicare and/or Medicaid temporarily stops payments for new residents until issues are fixed. May 7, 2023
11 days

Last updated: Jan 2026

Guides for Better Senior Living

Care Cost Calculator: See Prices in Your Area

Nursing Home Data Explorer

Don’t Wait Too Long: 7 Red Flag Signs Your Parent Needs Assisted Living Now

The True Cost of Assisted Living in 2025 – And How Families Are Paying For It

Understanding Senior Living Costs: Pricing Models, Discounts & Financial Assistance

Financial Aid for Georgia Seniors

Get financial aid guidance

Community Care Services Program

Georgia Medicaid CCSP

Age 65+ or disabled, Georgia resident, Medicaid-eligible, nursing home-level care need.

~$2,829/month (300% FBR, individual).

$2,000 (individual), $3,000 (couple).

High rural demand; waitlists possible.

Respite Care Program

Georgia NFCSP Respite

Caregiver of someone 60+ (or with dementia), Georgia resident.

No strict limit; prioritizes low-income.

Not applicable.

Focus on metro and rural balance.

Home and Community Services (HCS)

Georgia Home and Community Services (Non-Medicaid)

Age 60+, Georgia resident, functionally impaired, at risk of nursing home placement.

No strict limit; prioritizes ~$41,000/year; cost-sharing for higher incomes.

Not specified; need-based.

Non-Medicaid; AAA-managed.

Medicare Savings Program (MSP)

Georgia Medicare Savings Program

Age 65+ or disabled, Georgia resident, Medicare Part A/B.

~$2,510/month (QMB), ~$3,380/month (SLMB), ~$3,598/month (QI).

$9,430 (individual), $14,130 (couple).

Three tiers; entitlement benefit.

Program of All-Inclusive Care for the Elderly (PACE)

Georgia Medicaid PACE

Age 55+, Georgia resident, nursing home-level care need, safe with PACE support.

~$2,829/month (300% FBR).

$2,000 (individual), $3,000 (couple).

Limited areas (e.g., Macon, Augusta).

Senior Community Service Employment Program (SCSEP)

Georgia SCSEP (Federally Funded, State-Administered)

Age 55+, unemployed, low-income, Georgia resident.

~$1,983/month (125% FPL).

Not specified; income-focused.

~1,200 slots; prioritizes veterans, rural residents.

SOURCE (Service Options Using Resources in a Community Environment)

Georgia Medicaid SOURCE Program

Age 65+ or disabled, Georgia resident, Medicaid-eligible, frail but not necessarily nursing home-level.

~$914/month (SSI level); QIT allowed.

$2,000 (individual), $3,000 (couple).

Enhanced primary care model; statewide via 12 sites.

Optional State Supplementation (OSS)

Georgia Optional State Supplementation

Age 65+ or disabled, Georgia resident, in approved facility, low-income/SSI recipient.

~$1,004/month (including SSI).

$2,000 (individual), $3,000 (couple).

~$20-$489/month based on facility type.

Who we are

Your Senior Care Partner, Every Step of the Way

We help families find affordable senior communities and unlock same day discounts, Medicaid, and Medicare options tailored to your needs.

Contact us Today