

Total health inspections
33
California average 12.5
Last Health inspection on Sep 2025

We arrange tours, appointments, and even moving support so you don’t have to

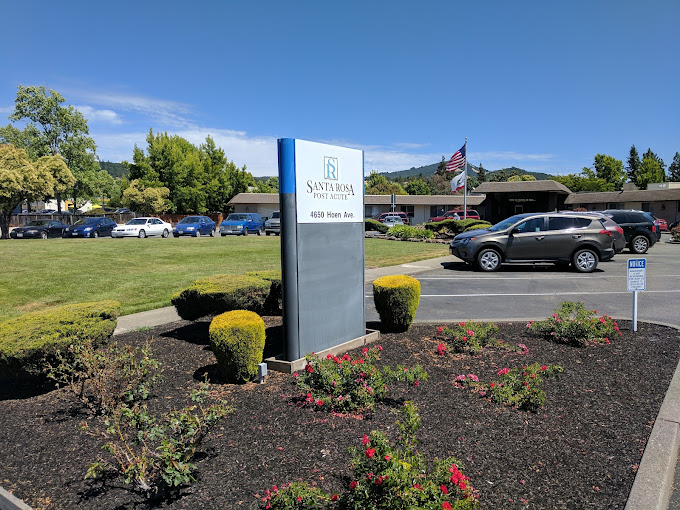
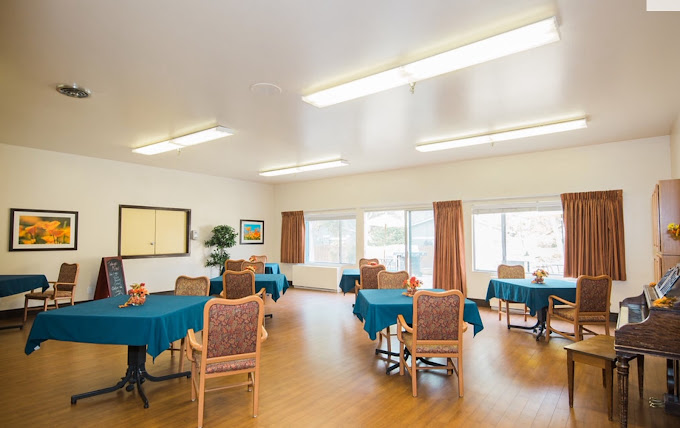
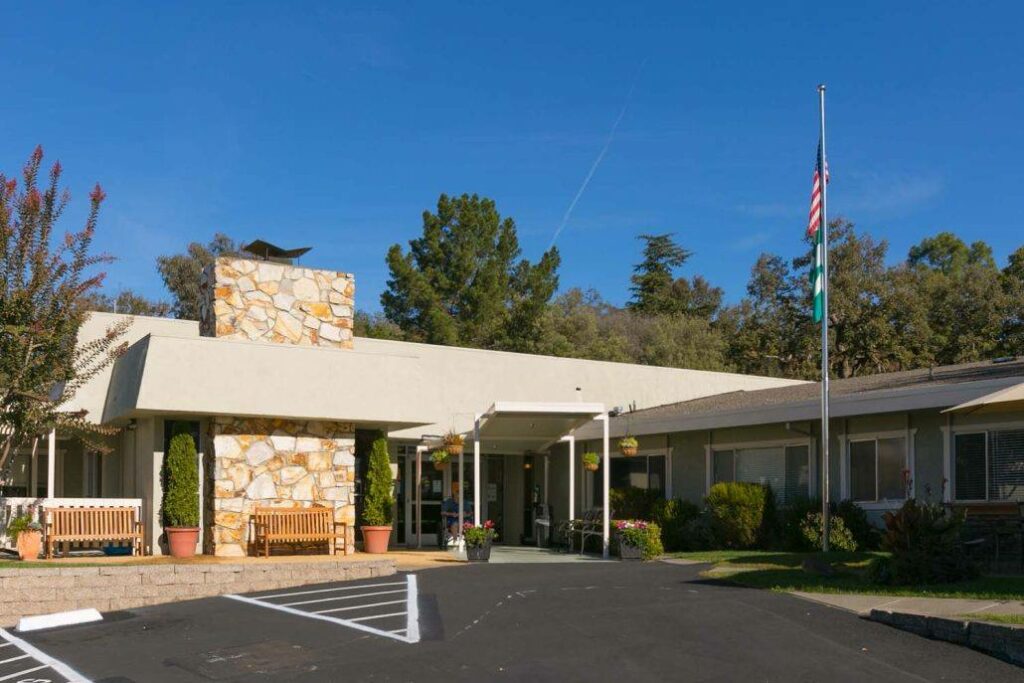
Located in Santa Rosa, California, Santa Rosa Post-Acute is a comprehensive healthcare facility offering a range of services, including nursing care, rehabilitation, and wound care. In addition to providing respite stays and hospice care, the facility distinguishes itself through a variety of social activities that contribute to a vibrant senior living experience.
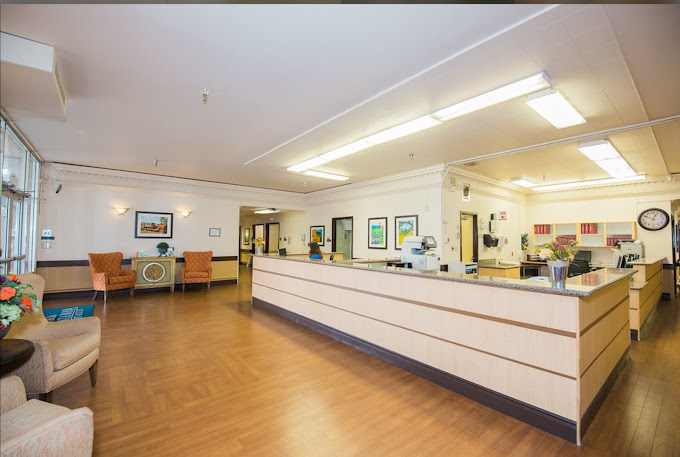
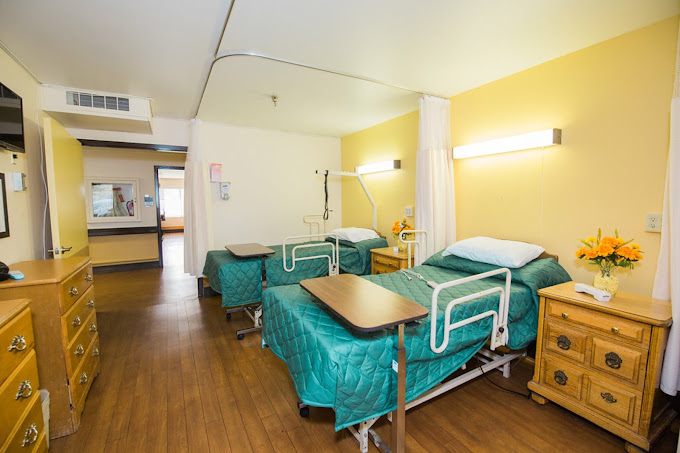
Santa Rosa Post-Acute is backed by an exceptional team of professionals dedicated to bringing the comforts of home to its residents. With an on-site medical director overseeing and enhancing medical services, the facility prioritizes individualized resident care plans and treatments. The comprehensive offerings extend to laboratory testing, x-rays, a registered dietitian on staff, and available transportation services. Specialized care includes Alzheimer’s care, complemented by a robust restorative nursing program. This capable team ensures a wide range of healthcare services for seniors, aligning with nursing home requirements and fostering a supportive and enriching senior living environment.
 Official CMS rating based on health inspections, staffing and quality measures.
Official CMS rating based on deficiencies found during state health inspections.
Official CMS rating based on nurse staffing hours per resident per day.
Official CMS rating based on clinical outcomes for residents.
Average daily nursing hours per resident (adjusted for acuity). Higher values indicate more nursing time per resident.
Hours of care per resident per day, broken down by staff type. Data from CMS Medicare.
Registered nurse hours per resident per day.
Licensed Practical Nurse / Licensed Vocational Nurse hours per resident per day.
Nurse aide hours per resident per day.
Total number of nurse staff hours per resident per day on weekends.
Physical therapist staff hours per resident per day.
Registered nurse hours per resident per day on weekends.
Official CMS rating based on health inspections, staffing and quality measures.
Official CMS rating based on deficiencies found during state health inspections.
Official CMS rating based on nurse staffing hours per resident per day.
Official CMS rating based on clinical outcomes for residents.
Average daily nursing hours per resident (adjusted for acuity). Higher values indicate more nursing time per resident.
Hours of care per resident per day, broken down by staff type. Data from CMS Medicare.
Registered nurse hours per resident per day.
Licensed Practical Nurse / Licensed Vocational Nurse hours per resident per day.
Nurse aide hours per resident per day.
Total number of nurse staff hours per resident per day on weekends.
Physical therapist staff hours per resident per day.
Registered nurse hours per resident per day on weekends.
May offer a more intimate, personalized care environment.
That suggests steady demand, but availability may be limited.
This home supports both short-term rehab and long-term care, with residents staying for a wide range of durations.
49% of new residents, usually for short-term rehab.
51% of new residents, often for short stays.
The portion of the home's budget spent on staff, including nurses, caregivers, and other employees who support care and operations.
All remaining costs needed to run the home, such as food, utilities, building maintenance, supplies and administrative expenses.
Nursing Homes 24/7 care needed
Hospice Care
Nursing Homes 24/7 care needed
Respite Care
Nursing Homes 24/7 care needed
Assisted Living For seniors needing help with daily tasks but not full-time nursing.
Memory Care Specialized care for those with Memory Loss, Alzheimer's, or dementia, ensuring safety and support.
Nursing Homes 24/7 care needed
 Summerfield Healthcare Center
 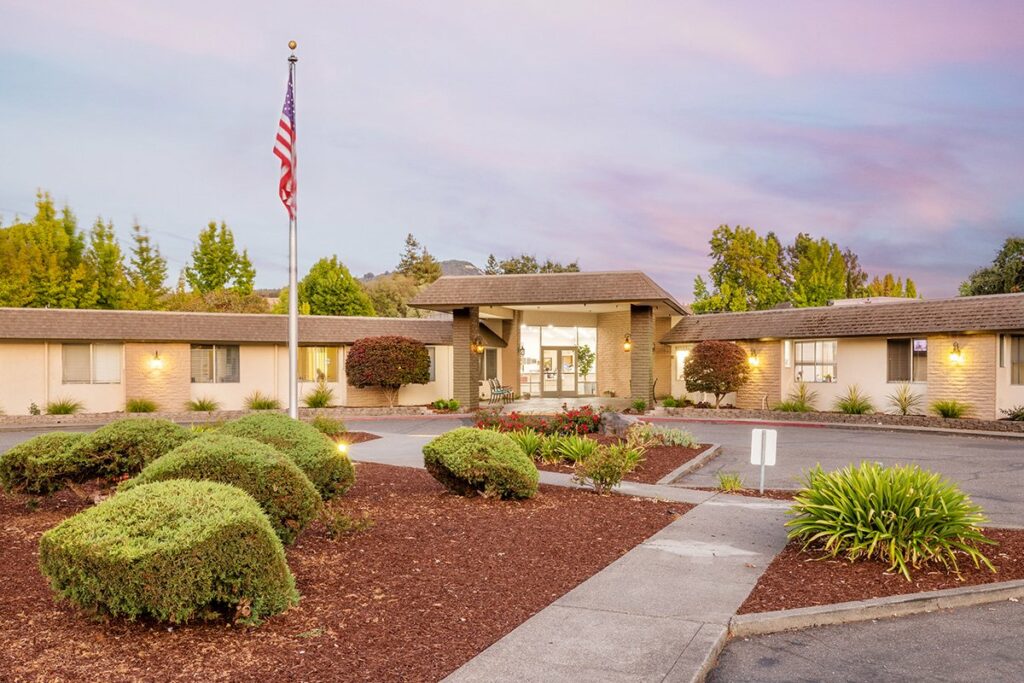 Santa Rosa Post-Acute
  Park View Post Acute
  Arbol Residences in Santa Rosa
![]() 3.3 miles from city center — 0.12 miles to nearest hospital (Rheumatology: Sutter Pacific Medical Foundation: 4725A Hoen Ave)
3.3 miles from city center — 0.12 miles to nearest hospital (Rheumatology: Sutter Pacific Medical Foundation: 4725A Hoen Ave)
![]() 4650 Hoen Ave, Santa Rosa, CA 95405
4650 Hoen Ave, Santa Rosa, CA 95405
Add your location
Source: CMS Payroll-Based Journal (Q2 2025)
| Role ⓘ | Count ⓘ | Avg Shift (hrs) ⓘ | Uses Contractors? ⓘ |
|---|---|---|---|
| Registered Nurse | 18 | 8.1 | Yes |
| Licensed Practical Nurse | 19 | 7.9 | No |
| Certified Nursing Assistant | 63 | 7.5 | Yes |
| Role ⓘ | Employees ⓘ | Contractors ⓘ | Total Staff ⓘ | Total Hours ⓘ | Days Worked ⓘ | % of Days ⓘ | Avg Shift (hrs) ⓘ |
|---|---|---|---|---|---|---|---|
| Certified Nursing Assistant | 61 | 2 | 63 | 20,621 | 91 | 100% | 7.5 |
| Licensed Practical Nurse | 19 | 0 | 19 | 6,870 | 91 | 100% | 7.9 |
| Registered Nurse | 12 | 6 | 18 | 4,756 | 91 | 100% | 8.1 |
| Other Dietary Services Staff | 3 | 0 | 3 | 1,373 | 91 | 100% | 7.5 |
| RN Director of Nursing | 2 | 0 | 2 | 1,024 | 64 | 70% | 8 |
| Physical Therapy Assistant | 3 | 0 | 3 | 828 | 69 | 76% | 6 |
| Administrator | 1 | 0 | 1 | 512 | 64 | 70% | 8 |
| Nurse Practitioner | 1 | 0 | 1 | 512 | 64 | 70% | 8 |
| Clinical Nurse Specialist | 1 | 0 | 1 | 512 | 64 | 70% | 8 |
| Physical Therapy Aide | 1 | 0 | 1 | 512 | 64 | 70% | 8 |
| Mental Health Service Worker | 1 | 0 | 1 | 512 | 64 | 70% | 8 |
| Qualified Social Worker | 2 | 0 | 2 | 501 | 70 | 77% | 5 |
| Respiratory Therapy Technician | 3 | 0 | 3 | 475 | 68 | 75% | 5.3 |
| Dental Services Staff | 1 | 0 | 1 | 437 | 60 | 66% | 7.3 |
| Therapeutic Recreation Specialist | 1 | 0 | 1 | 307 | 58 | 64% | 5.3 |
| Speech Language Pathologist | 1 | 0 | 1 | 296 | 56 | 62% | 5.3 |
California average 12.5
Last Health inspection on Sep 2025
Health citations are formal notices following inspections when they fail to comply with safety and care standards.
19 of 67 citations resulted from standard inspections; and 48 of 67 resulted from complaint investigations.
California average: 0.4
California average: 1
Data sourced from CMS Health Deficiencies reports. Citation severity codes range from A (least serious) to L (most serious). Immediate Jeopardy (J-L) citations indicate situations where the facility's noncompliance has placed residents at risk of death or serious harm.
Source: CMS Long-Term Care Facility Characteristics (Data as of Jan 2026)
Active councils help families stay involved in care decisions and facility operations.
These measures show how residents usually do over time at this home, based on health outcomes and preventive care.
California average: 6.6
California average: 11.3
California average: 11.1%
California average: 12.0%
California average: 11.3%
California average: 1.7%
California average: 5.0%
California average: 1.2%
California average: 4.2%
California average: 6.7%
California average: 10.1%
California average: 98.5%
California average: 98.2%
California average: 2.25
California average: 1.59
California average: 94.0%
California average: 1.5%
California average: 93.2%
California average: 23.2%
California average: 11.2%
California average: 0.8%
California average: 53.7%
California average: 50.6%
Quality measures are calculated from Minimum Data Set (MDS) assessments. For most measures, lower percentages indicate better care quality.
Federal penalties imposed by CMS for regulatory violations, including civil money penalties (fines) and denials of payment for new Medicare/Medicaid admissions.
Source: CMS Penalties Database (Data as of Jan 2026)
California average: $55K
California average: 2.4
California average: 0.5
Penalties are imposed by CMS for violations of federal nursing home regulations.
Last updated: Jan 2026
Historical financial and operational data for Santa Rosa Post-Acute based on CMS SNF Cost Reports.
Loading trend charts...
Care Cost Calculator: See Prices in Your Area
Nursing Home Data Explorer
Don’t Wait Too Long: 7 Red Flag Signs Your Parent Needs Assisted Living Now
The True Cost of Assisted Living in 2025 – And How Families Are Paying For It
Understanding Senior Living Costs: Pricing Models, Discounts & Financial Assistance

We help families find affordable senior communities and unlock same day discounts, Medicaid, and Medicare options tailored to your needs.
Contact us Today
Touring a community? Use this expert-backed checklist to stay organized, ask the right questions, and find the perfect fit.
We'll send you a PDF version of the touring checklist.


