Explore Open Rooms

1 Contact details
2 What type of senior care service are you looking for?
3 What budget do you have in mind for senior care?
4 How soon do you need to find care?
5 Additional details

Thank you for your interest!

Our team will be in touch shortly to help with next steps.

Senior Living Home

Seneca Place Village

Senior Living Home

Seneca Place Village

5360 Saltsburg Rd, Verona, PA 15147 View map
Overview of Seneca Place Village

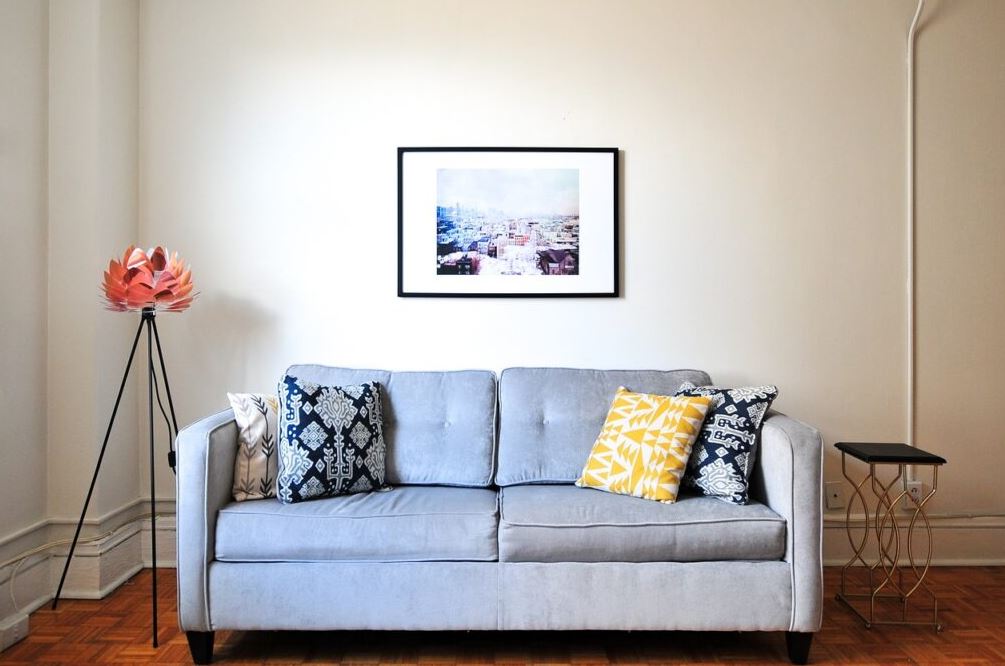
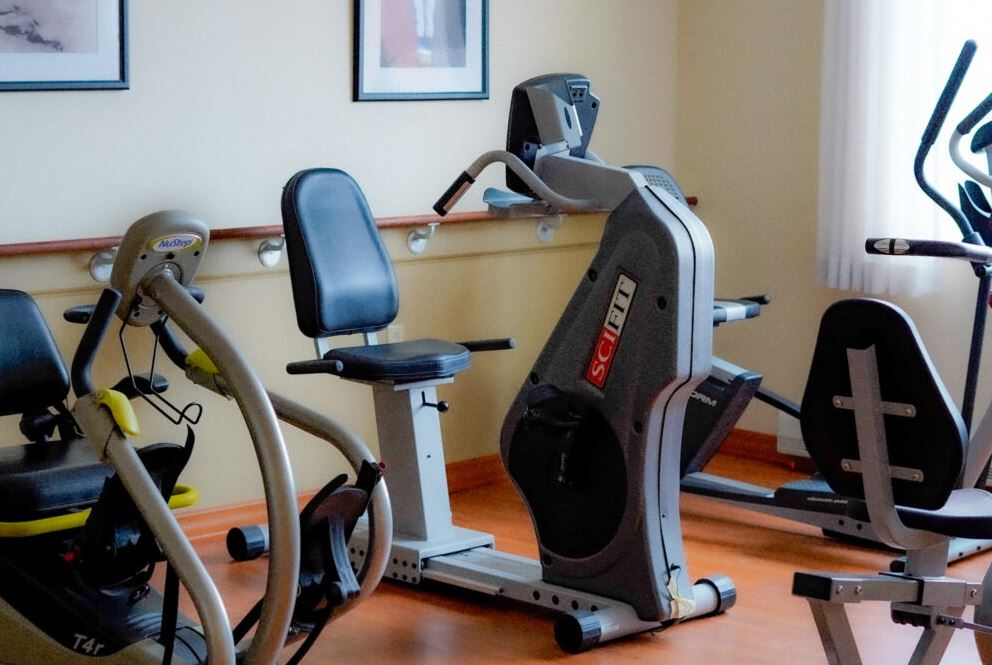
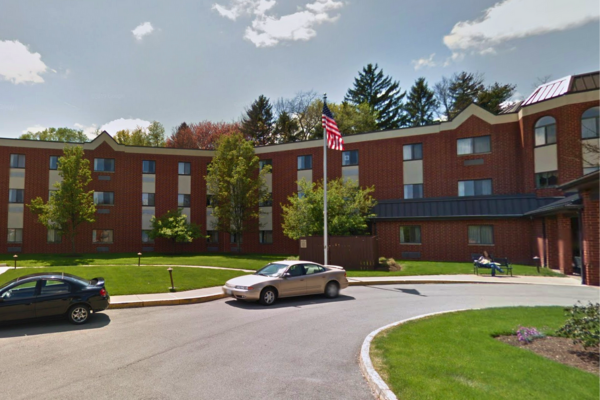
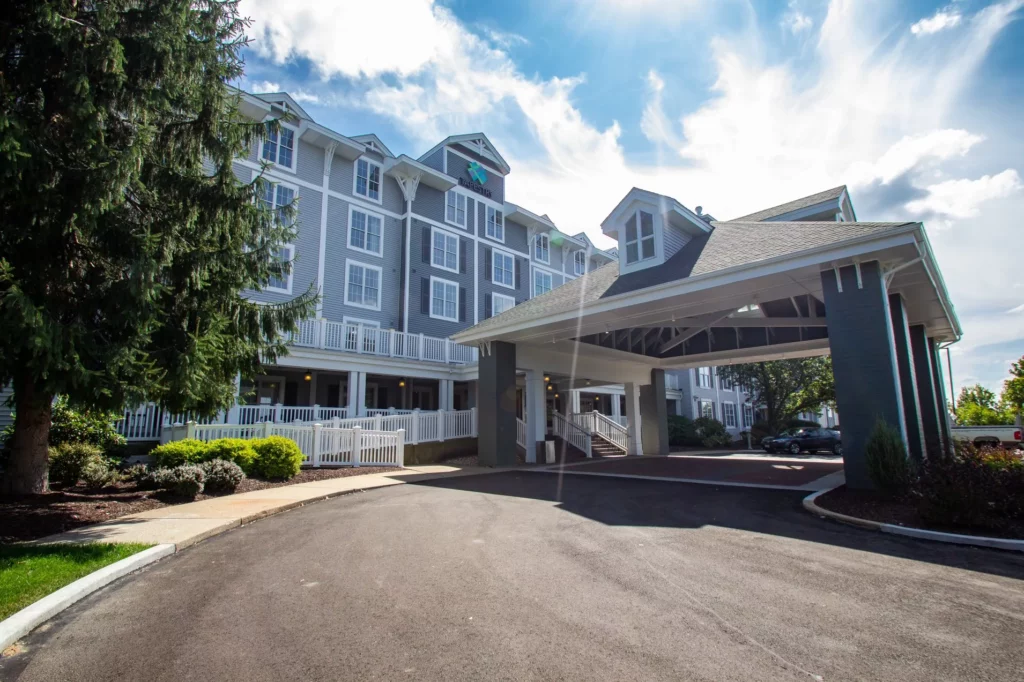
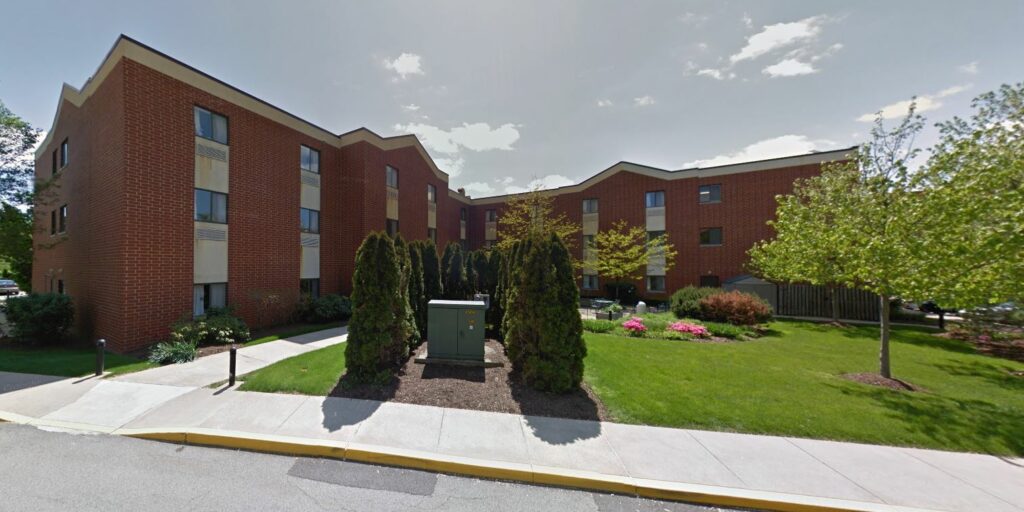
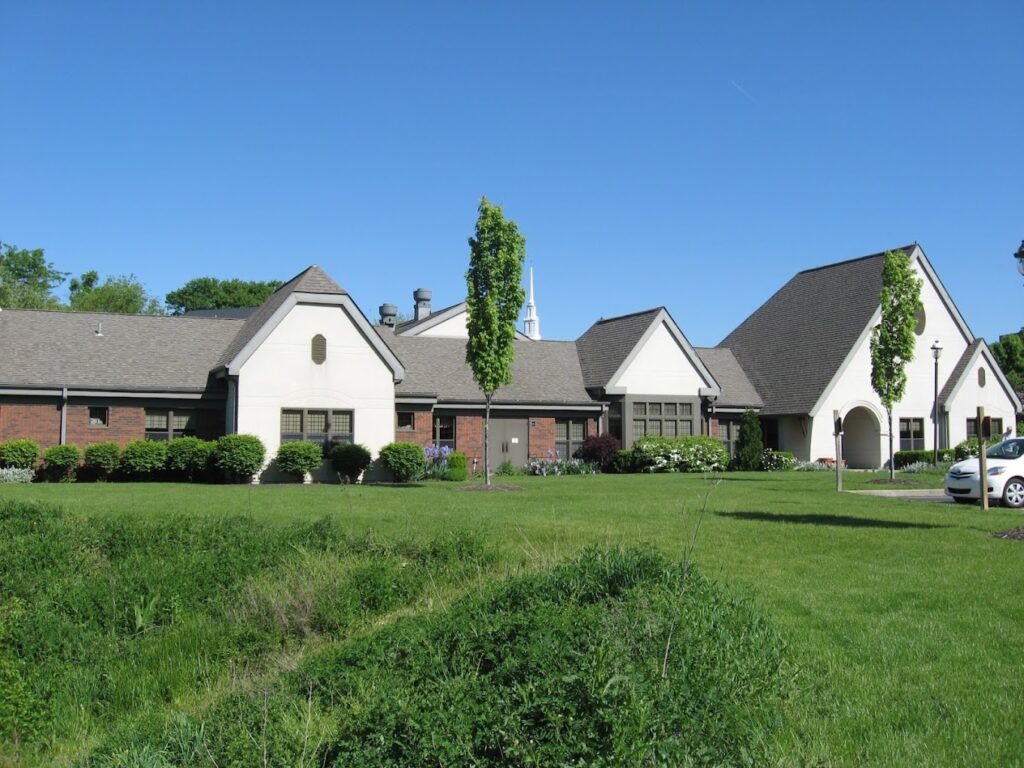
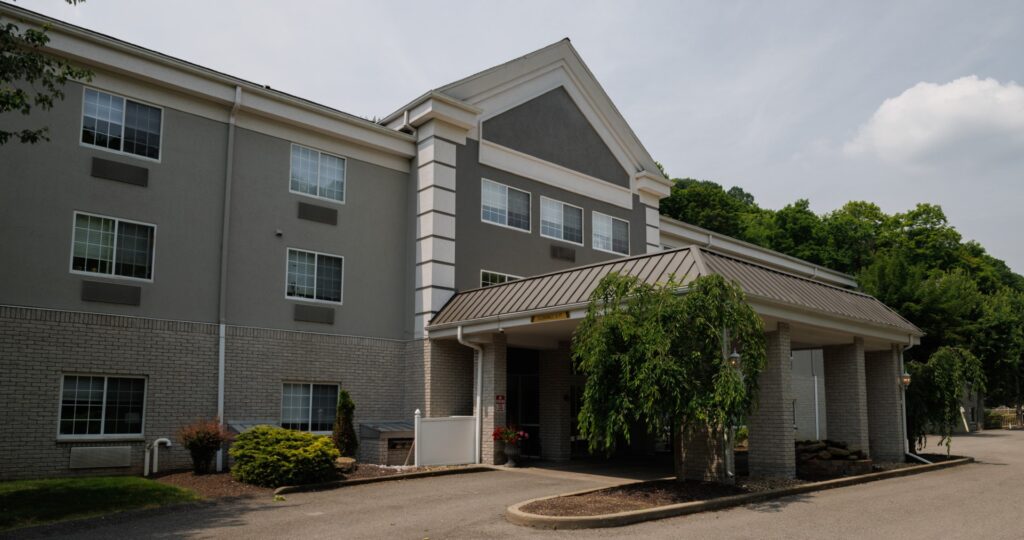
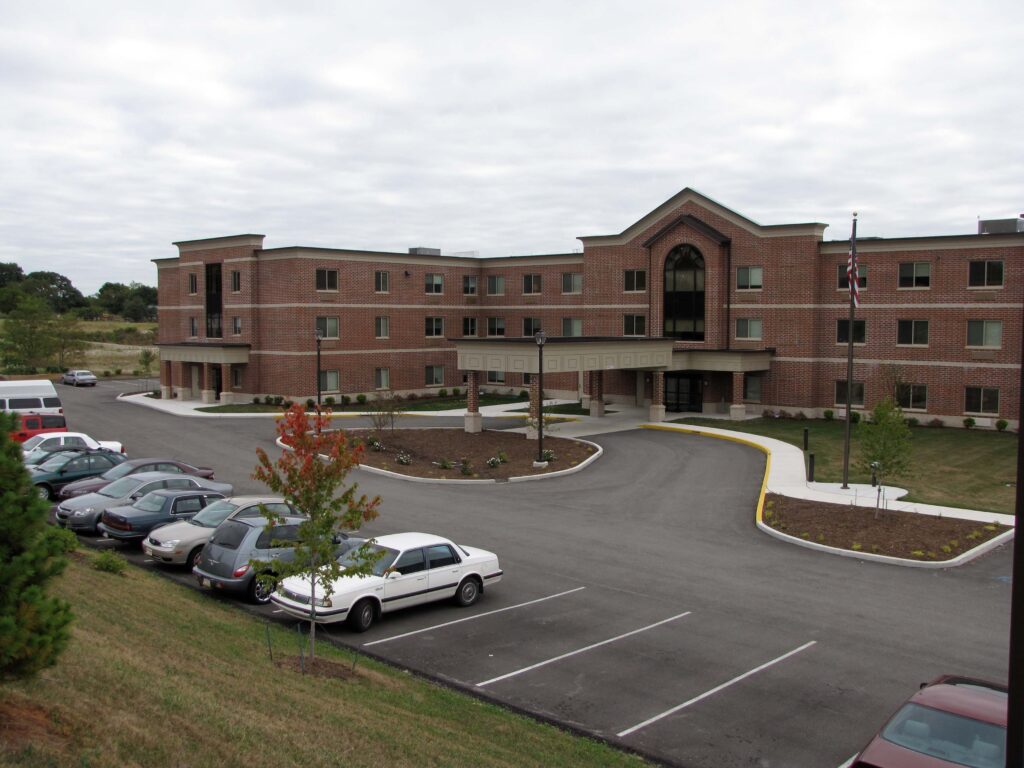
Tucked away within the scenic neighborhood of Verona, PA, Seneca Place Village is a one-of-a-kind senior living community that strives to provide seniors with a fulfilling retirement lifestyle through comprehensive care. This includes independent living, assisted living, and skilled nursing. Residents enjoy a comfortable and worry-free lifestyle in spacious apartments equipped with various modern amenities. With a full calendar of activities and programs, residents maintain an active and engaging lifestyle. The community also provides a broad range of amenities that ensures residents’ wellness, comfort, and enjoyment, including freshly-made meals, transportation to outings and appointments, and housekeeping, all complemented with 24-hour nursing care and personal care services tailored to residents’ unique needs. With Seneca Place Village’s dedicated care and service, residents have the freedom to focus on doing things that really matter to them.

(412) 798-8000

Quality ratings

Measured by Centers for Medicare & Medicaid Services (CMS)

Overall rating Info The Overall CMS Rating combines results from health inspections, staffing levels and quality measures. Health inspections carry the most weight. Staffing and quality scores can increase or decrease the final rating based on performance compared to state and national standards.
1/5
Pennsylvania average: 3.9/5
Health Inspection Info Based on the results of the facility's three most recent standard inspections and any complaint investigations. CMS reviews the number, scope, and severity of deficiencies, with more recent findings weighted more heavily.
1/5
Pennsylvania average: 3.5/5
Staffing Info Measures average nursing staff hours per resident per day, including Registered Nurses (RNs) and total nursing staff. Ratings are adjusted based on the level of care residents require and are compared to state and national benchmarks.
3/5
Pennsylvania average: 4.1/5
Quality Measures Info Based on clinical and physical health indicators reported to CMS, such as hospital readmissions, falls, pressure ulcers, and improvements in mobility. These measures reflect how well residents' health needs are being managed.
1/5
Pennsylvania average: 3.8/5

Nursing care per resident

Info This shows how many total hours of nursing staff time are available per resident each day. Higher numbers usually mean more staff support.
3h 57m per day

This home provides 14% less nursing time per resident than the Pennsylvania average.

Pennsylvania average: 4h 35m per day

Capacity and availability

Medium-capacity home

Offers a balance of services and community atmosphere.

Total beds 100

This home usually has availability

Lower occupancy suggests more openings may be available.

Lower demand than the Pennsylvania average
Occupancy rate 71%
Residents per day 71
Occupancy rate
71%
Residents per day
71

Who this home usually serves

TYPE OF STAY

Primarily short stays

Residents typically stay for brief periods, with frequent admissions and discharges throughout the year.

Might be optimal for
Post-acute recovery Temporary care Transitional stays

Breakdown by payment type

Medicare

13% of new residents, usually for short-term rehab.

Typical stay 1 - 2 months

Private pay

85% of new residents, often for short stays.

Typical stay 1 - 2 months

Medicaid

2% of new residents, often for long-term daily care.

Typical stay 11 - 12 years

Finances and operations

Voluntary non-profit community
Home revenue
$19.9M
Operating deficit
-$3.8M
Voluntary non-profit community
Home revenue
$19,895,362.00
Operating deficit
$-3,849,258.00
Payroll costs Info The portion of the home's budget spent on staff, including nurses, caregivers, and other employees who support care and operations.
$4.3M
21.5% of revenue
Other operating costs Info All remaining costs needed to run the home, such as food, utilities, building maintenance, supplies and administrative expenses.
$19.5M
Total costs $23.7M
Bed community size
100-bed community
A larger shared setting that may offer more common spaces and organized community services.
Walk Score
Walk Score: 20 / 100
Car-dependent. Most errands require a car, with limited nearby walkable options.

About this community

Occupancy

Occupancy rate
71%
In line with Pennsylvania average
Occupied beds
71 / 100
Average residents 103 per day

License details

Facility type
Assisted Living
Status Licensed
Issuance April 1, 2025
Expiration April 1, 2026
County: ALLEGHENY

Additional licensing details

License number: 455490

Ownership & operating entity

Seneca Place Village is legally operated by SENECA MANOR, LLC.

Profit status: NON-PROFIT

State Inspection Report (October 28, 2025)

109 Total Daily Staff
82 Waking Staff
0 Resident Support Staff
79 Residents Served

Resident Conditions

Age 60+ 79 (100%)
Mobility Need 30 (38%)
Physical Disability 2 (3%)

Types of Care at Seneca Place Village

Assisted Living Independent Living Nursing Home

Inspection History

In Pennsylvania, the Department of Human Services (for assisted living facilities) and the Department of Health (for nursing homes) conduct unannounced inspections to verify adherence to state regulations.

5 visits/inspections

1 visits/inspections triggered by complaints

Results

5 with citations

0 without citations

Pennsylvania average: 4 complaint visits

Pennsylvania average: 8 inspections with citations

1 complaint

Formal expressions of dissatisfaction or concern made by residents, or their families regarding various aspects of the care, services, and environment provided.

Pennsylvania average: 4 complaints

Latest inspection

Date:June 3, 2025
Type:Complaint Investigation

22 total citations

Citations indicate regulatory violations. A higher number implies the facility had several areas requiring improvement.

Pennsylvania average: 66 citations

21 deficiencies

Deficiencies indicate regulatory issues. A higher number implies the facility had several areas requiring improvement.

1 enforcement action

Penalties or interventions imposed by state regulators when facilities do not comply with quality, safety or regulatory standards.

Waivers: 0

Health Inspection History

Inspections
Total health inspections 10

Pennsylvania average 6.7


Last Health inspection on Jun 2025

Total health citations 65

Pennsylvania average 31.3

Citations per inspection
6.5

Pennsylvania average 4.4


Health citations are formal notices following inspections when they fail to comply with safety and care standards.

52 of 65 citations resulted from standard inspections; 11 of 65 resulted from complaint investigations; and 2 of 65 came from combined inspections (standard and complaint).

Breakdown of citation severity (last 3 years)
Critical Health citations More info 0
100% better than Pennsylvania average

Pennsylvania average: 0.3


Serious Health citations More info 1
67% worse than Pennsylvania average

Pennsylvania average: 0.6

0 critical citations More info Pennsylvania average: 0.3

1 serious citation More info Pennsylvania average: 0.6

64 moderate citations More info Pennsylvania average: 29.5

0 minor citations More info Pennsylvania average: 0.8
Citations history (last 3 years)
Abuse/Neglect moderate citation Info Issues related to protecting resident's from harm, including abuse, neglect, or mistreatment. Jun 13, 2025
Corrected

Abuse/Neglect moderate citation Info Issues related to protecting resident's from harm, including abuse, neglect, or mistreatment. Jun 13, 2025
Corrected

Abuse/Neglect moderate citation Info Issues related to protecting resident's from harm, including abuse, neglect, or mistreatment. Jun 13, 2025
Corrected

Administration moderate citation Info Issues related to how the facility is managed, including policies, procedures, and compliance with regulations. Jun 13, 2025
Corrected

Compare Senior Living around Pittsburgh The information below is reported by the Pennsylvania Department of Human Services and Department of Health.

Tapestry Senior Living – Moon Township
AL

Assisted Living A licensed, long-term care setting for seniors or individuals with disabilities who need help with daily activities — like bathing, dressing, and medication management — but not 24-hour skilled nursing. Offers housing, meals, and around-the-clock support while aiming to maximize resident independence.

Coraopolis
210
No
-
15
Seneca Place Village
AL

Assisted Living A licensed, long-term care setting for seniors or individuals with disabilities who need help with daily activities — like bathing, dressing, and medication management — but not 24-hour skilled nursing. Offers housing, meals, and around-the-clock support while aiming to maximize resident independence.

IL

Independent Living Lifestyle-focused communities for older adults offering dining, activities, and transportation with minimal personal care. Best for active, independent seniors who want community without medical support.

NH

Nursing Home Licensed facility providing 24/7 skilled nursing care for residents with complex, ongoing medical needs. Staffed by RNs, LPNs, and CNAs. Inspected and star-rated annually by CMS. Accepts Medicare (short-term rehab) and Medicaid (long-term care).

Verona
174
No
-
20
Asbury Heights
NH

Nursing Home Licensed facility providing 24/7 skilled nursing care for residents with complex, ongoing medical needs. Staffed by RNs, LPNs, and CNAs. Inspected and star-rated annually by CMS. Accepts Medicare (short-term rehab) and Medicaid (long-term care).

AL

Assisted Living A licensed, long-term care setting for seniors or individuals with disabilities who need help with daily activities — like bathing, dressing, and medication management — but not 24-hour skilled nursing. Offers housing, meals, and around-the-clock support while aiming to maximize resident independence.

Pittsburgh
139
No
-
47
The Haven at North Hills Senior Residence
AL

Assisted Living A licensed, long-term care setting for seniors or individuals with disabilities who need help with daily activities — like bathing, dressing, and medication management — but not 24-hour skilled nursing. Offers housing, meals, and around-the-clock support while aiming to maximize resident independence.

Pittsburgh
90
No
A+
34
Point Pleasant
AL

Assisted Living A licensed, long-term care setting for seniors or individuals with disabilities who need help with daily activities — like bathing, dressing, and medication management — but not 24-hour skilled nursing. Offers housing, meals, and around-the-clock support while aiming to maximize resident independence.

North Versailles
-
Yes
C+
32

Places of interest near Seneca Place Village

Address 13.1 miles from city center — 5 miles to nearest hospital (UPMC East)

Address 5360 Saltsburg Rd, Verona, PA 15147

Calculate Travel Distance to Seneca Place Village

Add your location

Address

Staffing Data (Q2 2025)

This data corresponds to Q2 2025 and is based on CMS Payroll-Based Journal.

Total staff 195
Employees 157
Contractors 38
Staff to resident ratio 1.46:1
25% worse than Pennsylvania average

Pennsylvania average ratio: 1.94:1

Avg staff/day 86
Average shift 7.7 hours
0% compared with Pennsylvania average

Pennsylvania average: 7.8 hours

Total staff hours (quarter) 60,145
Nursing staff breakdown
Registered Nurse

Manages medical care and health needs.

Total count 25
Average shift length Info Average shift length. Calculated as total hours divided by days worked and average staff per day. 8.2 hours

No contractors work on this role.

Licensed Practical Nurse

Assists with medical care and medications.

Total count 24
Average shift length Info Average shift length. Calculated as total hours divided by days worked and average staff per day. 8.2 hours

No contractors work on this role.

Certified Nursing Assistant

Helps with daily care and mobility.

Total count 86
Average shift length Info Average shift length. Calculated as total hours divided by days worked and average staff per day. 7.6 hours

No contractors work on this role.

Contractor staffing

Total hours from contractors

8.8%

5,275 contractor hours this quarter

Respiratory Therapy Technician: 14 Speech Language Pathologist: 7 Physical Therapy Aide: 6 Physical Therapy Assistant: 5 Feeding Assistant: 2 Qualified Social Worker: 2 Medical Director: 1 Occupational Therapy Assistant: 1
Staff by category
Certified Nursing Assistant8608628,78491100%7.6
Licensed Practical Nurse2402410,13591100%8.2
Registered Nurse250257,08891100%8.2
Clinical Nurse Specialist9093,7936470%7.9
Other Dietary Services Staff6062,24891100%7.5
Physical Therapy Aide0661,5766673%7.5
Speech Language Pathologist0771,3907684%6.8
Mental Health Service Worker2029506470%7.9
Physical Therapy Assistant0559456976%7.1
Administrator2025926470%8
Dietitian1015046369%8
Respiratory Therapy Technician014144747178%6.2
Qualified Social Worker0224656571%7.1
Nurse Practitioner1014565763%8
Occupational Therapy Aide1013204246%7.6
Feeding Assistant0222316470%3.6
Occupational Therapy Assistant0111502325%6.5
Medical Director011453538%1.3
86 Certified Nursing Assistant
% of Days 100%
24 Licensed Practical Nurse
% of Days 100%
25 Registered Nurse
% of Days 100%
9 Clinical Nurse Specialist
% of Days 70%
6 Other Dietary Services Staff
% of Days 100%
6 Physical Therapy Aide
% of Days 73%
7 Speech Language Pathologist
% of Days 84%
2 Mental Health Service Worker
% of Days 70%
5 Physical Therapy Assistant
% of Days 76%
2 Administrator
% of Days 70%
1 Dietitian
% of Days 69%
14 Respiratory Therapy Technician
% of Days 78%
2 Qualified Social Worker
% of Days 71%
1 Nurse Practitioner
% of Days 63%
1 Occupational Therapy Aide
% of Days 46%
2 Feeding Assistant
% of Days 70%
1 Occupational Therapy Assistant
% of Days 25%
1 Medical Director
% of Days 38%

Facility Characteristics

Source: CMS Long-Term Care Facility Characteristics (Data as of Jan 2026)

Total census
134 residents
Residents by payment source
Medicare
21 residents (15.7%)
Medicaid
101 residents (75.4%)
Private pay or other
12 residents (9%)
Programs & Services
Residents' Group

Residents meet regularly to discuss policies, care quality, and activities

CCRC

Part of a Continuing Care Retirement Community offering multiple care levels

Active Resident Council

Organized group of residents that meets regularly to discuss facility policies, quality of life, and activities.

Quality of care over time

These measures show how residents usually do over time at this home, based on health outcomes and preventive care.

High-risk clinical events score Info A composite score based on pressure ulcers, falls with injury, weight loss, walking ability decline, and activities of daily living decline. 14.7
34% worse than Pennsylvania average

Pennsylvania average: 11.0

Functional decline score Info A composite score based on activities of daily living decline, walking ability decline, and incontinence. 28.4
28% worse than Pennsylvania average

Pennsylvania average: 22.2

Long-stay resident measures
Need for Help with Daily Activities Increased Info Percent of long-stay residents whose need for help with daily activities has increased 25.0%
32% worse than Pennsylvania average

Pennsylvania average: 19.0%

Walking Ability Worsened Info Percent of long-stay residents whose ability to move independently worsened 30.1%
43% worse than Pennsylvania average

Pennsylvania average: 21.1%

Low Risk Residents with Bowel/Bladder Incontinence Info Percent of low risk long-stay residents who lose control of their bowels or bladder 30.0%
12% worse than Pennsylvania average

Pennsylvania average: 26.7%

Falls with Major Injury Info Percent of long-stay residents experiencing one or more falls with major injury 5.7%
78% worse than Pennsylvania average

Pennsylvania average: 3.2%

High Risk Residents with Pressure Ulcers Info Percent of long-stay high risk residents with pressure ulcers 6.3%
14% worse than Pennsylvania average

Pennsylvania average: 5.5%

Urinary Tract Infection Info Percent of long-stay residents with a urinary tract infection 1.5%
12% better than Pennsylvania average

Pennsylvania average: 1.8%

Lost Too Much Weight Info Percent of long-stay residents who lose too much weight 6.4%
In line with Pennsylvania average

Pennsylvania average: 6.6%

Depressive Symptoms Info Percent of long-stay residents who have depressive symptoms 0.5%
91% better than Pennsylvania average

Pennsylvania average: 5.5%

Antipsychotic Use Info Percent of long-stay residents who received an antipsychotic medication 20.5%
19% worse than Pennsylvania average

Pennsylvania average: 17.1%

Pneumococcal Vaccine Info Percent of long-stay residents assessed and appropriately given the pneumococcal vaccine 91.5%
5% better than Pennsylvania average

Pennsylvania average: 86.9%

Influenza Vaccine Info Percent of long-stay residents assessed and appropriately given the seasonal influenza vaccine 96.0%
In line with Pennsylvania average

Pennsylvania average: 93.5%

Short-stay resident measures
Pneumococcal Vaccine Info Percent of short-stay residents assessed and appropriately given the pneumococcal vaccine 70.5%
In line with Pennsylvania average

Pennsylvania average: 68.8%

Antipsychotic medication increase Info Percent of short-stay residents who newly received an antipsychotic medication 0.8%
50% better than Pennsylvania average

Pennsylvania average: 1.5%

Influenza Vaccine Info Percent of short-stay residents assessed and appropriately given the seasonal influenza vaccine 58.5%
15% worse than Pennsylvania average

Pennsylvania average: 68.7%

Penalties and fines

Federal penalties imposed by CMS for regulatory violations, including civil money penalties (fines) and denials of payment for new Medicare/Medicaid admissions.

Source: CMS Penalties Database (Data as of Jan 2026)

Total fines amount $7K
87% lower than Pennsylvania average

Pennsylvania average: $59K

Number of fines 1
52% fewer fines than Pennsylvania average

Pennsylvania average: 2.1

Payment Denials Info Serious action where Medicare and/or Medicaid temporarily stops payments for new residents until issues are fixed. 0
100% fewer payment denials than Pennsylvania average

Pennsylvania average: 0.2

Fines amount comparison
This facility $7K
Pennsylvania average $59K
Penalty History

Penalties are imposed by CMS for violations of federal nursing home regulations.

Civil Money Penalty Info Fines imposed for noncompliance, which can be assessed per day or per instance of violation. Jan 12, 2023
$7K

Last updated: Jan 2026

Guides for Better Senior Living

Care Cost Calculator: See Prices in Your Area

Nursing Home Data Explorer

Don’t Wait Too Long: 7 Red Flag Signs Your Parent Needs Assisted Living Now

The True Cost of Assisted Living in 2025 – And How Families Are Paying For It

Understanding Senior Living Costs: Pricing Models, Discounts & Financial Assistance

Financial Aid for Pennsylvania Seniors

Get financial aid guidance

Community HealthChoices (CHC)

PA Medicaid CHC

Age 65+ or disabled, Pennsylvania resident, Medicaid-eligible, nursing home-level care need.

~$2,829/month (300% FBR, individual).

$2,000 (individual), $3,000 (couple) (excludes home, car).

Managed care model; high urban demand (e.g., Philadelphia, Pittsburgh).

Pennsylvania OPTIONS Program

PA OPTIONS

Age 60+, Pennsylvania resident, at risk of nursing home placement.

~$2,000/month (individual, varies by region).

$8,000 (individual).

Cost-sharing required above certain income; rural/urban balance.

Living Independence for the Elderly (LIFE)

Pennsylvania LIFE (PACE)

Age 55+, PA resident (specific counties), NFLOC, safe with LIFE support.

~$2,829/month (Medicaid-eligible); private pay option available.

$2,000 (individual), $3,000 (couple) for Medicaid enrollees.

16 providers in 25 counties (e.g., Allegheny, Luzerne); LIFE branding unique to PA.

Medicare Savings Program (MSP)

Pennsylvania Medicare Savings Program

Age 65+ or disabled, PA resident, Medicare Part A/B.

~$2,510/month (QMB), ~$3,380/month (SLMB), ~$3,598/month (QI)—individual.

$9,430 (individual), $14,130 (couple).

Three tiers; includes Extra Help for Part D; no waitlist.

Low-Income Home Energy Assistance Program (LIHEAP)

Pennsylvania LIHEAP

Age 60+ prioritized, PA resident, low-income household.

~$3,970/month (individual, 185% FPL).

Not assessed; income-focused.

Cash grants and crisis aid; serves ~600,000 households annually.

Family Caregiver Support Program (FCSP)

Pennsylvania Family Caregiver Support Program

Caregivers of 60+ needing care or 55+ caregivers of others; PA resident; functional needs (2+ ADLs).

No strict cap; reimbursements up to $600/month if care recipient income < ~$2,322/month (185% FPL).

Not assessed; need-based.

High demand; includes grandparent caregivers.

Senior Community Service Employment Program (SCSEP)

Pennsylvania SCSEP

Age 55+, unemployed, low-income, PA resident.

~$1,983/month (125% FPL).

Not specified; income-focused.

Priority for veterans, rural residents; AARP partnership.

VA Aid and Attendance (A&A) and Housebound Benefits

Pennsylvania VA Aid and Attendance/Housebound

Age 65+ or disabled veteran/spouse, PA resident, wartime service, need for ADL help (A&A) or homebound.

Net income < ~$1,984/month (veteran with dependent, A&A); pension offsets income.

~$155,356 (net worth limit).

High veteran population; supports rural/urban care needs.

Property Tax/Rent Rebate Program (PTRR)

Pennsylvania Property Tax/Rent Rebate Program

Age 65+, PA resident, homeowner/renter (or widow/er 50+, disabled 18+).

~$45,000/year (individual or couple, excludes half of Social Security).

Not assessed; income-focused.

Rebates up to $1,000; ~600,000 eligible annually.

Senior Farmers’ Market Nutrition Program (SFMNP)

Pennsylvania SFMNP

Age 60+, PA resident, low-income.

~$2,322/month (individual, 185% FPL).

Not assessed.

Vouchers (~$50/season) via 52 AAAs; serves ~200,000 annually.

Tour Icon
Planning a tour? Check our touring checklist.
Chat Icon
Thinking of living here? We can help you speak to a current resident