Serenity Estates of Lincolnshire
Nursing Home, Memory Care & Hospice Care · Vernon Hills, IL
CMS overall rating Info The Overall CMS Rating is scored from 1 to 5 stars and combines results from health inspections, staffing levels, and quality measures. Health inspections carry the most weight. Staffing and quality scores can increase or decrease the final rating based on performance compared to state and national standards.

Serenity Estates of Lincolnshire

Nursing Home, Memory Care & Hospice Care · Vernon Hills, IL
CMS overall rating Info The Overall CMS Rating is scored from 1 to 5 stars and combines results from health inspections, staffing levels, and quality measures. Health inspections carry the most weight. Staffing and quality scores can increase or decrease the final rating based on performance compared to state and national standards.
Calculator: See prices in your area
Serenity Estates of Lincolnshire accepts Medicare, Medicaid, and private pay.

Overview of Serenity Estates of Lincolnshire

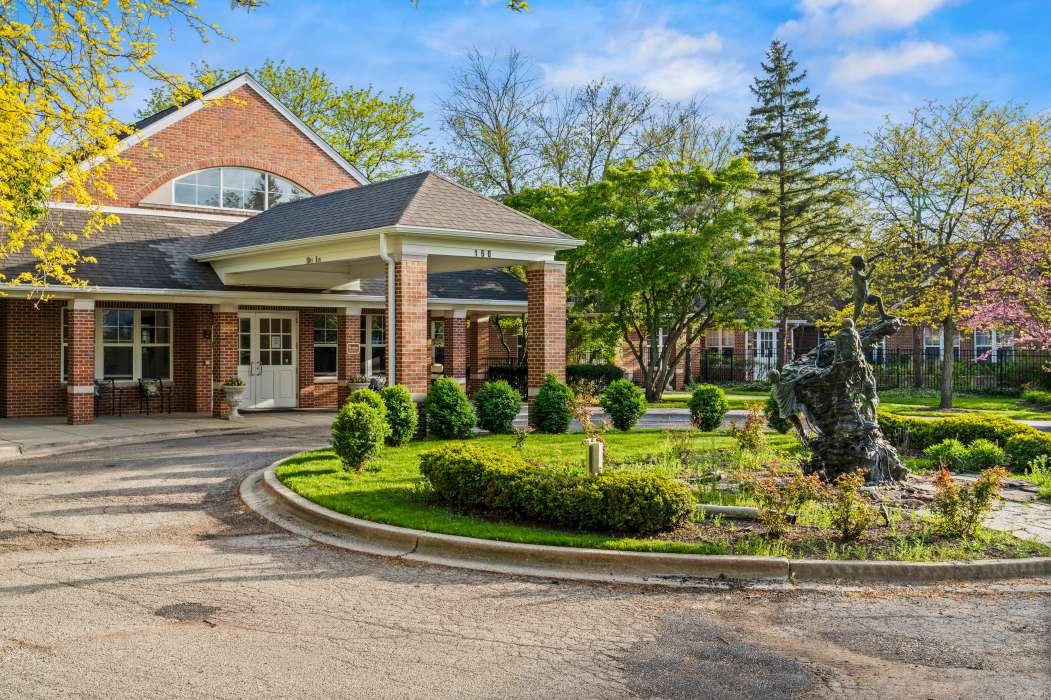
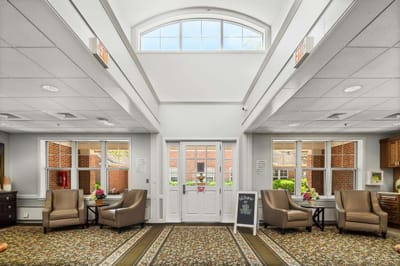
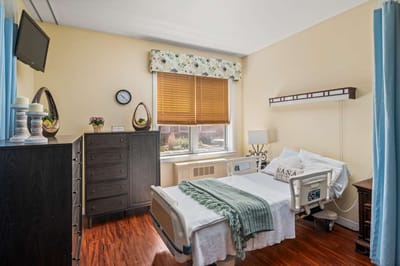
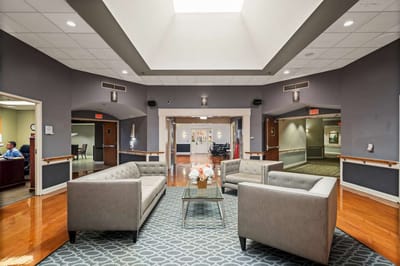
Serenity Estates of Lincolnshire is a nursing home in Lincolnshire, IL, offering rehabilitation, skilled nursing, and end-of-life care. Featuring spacious, private rooms in a supportive and welcoming setting, the community ensures older adults can feel at home. Restaurant-style dining, 24-hour care, and transportation are among the excellent services dedicated to improving residents’ quality of life. Along with evidence-based medical practices, personalized care plans are also provided to meet residents’ unique needs and preferences.

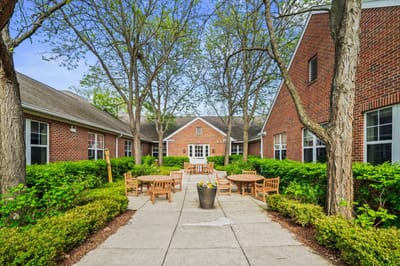
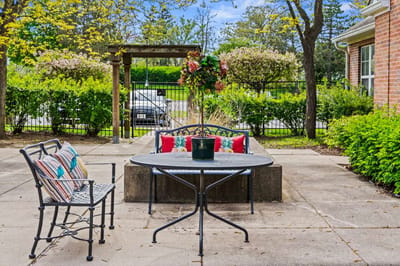
Tai chi, arts and crafts, and education programs ensure residents continue learning and gain meaningful experiences. A library, accessible gardens, and secured courtyards also ensure residents’ relaxation and wellness. Situated near the Des Plaines River Trail, restaurants, shops, and bus stops in Lincolnshire, the community guarantees accessibility and convenience. This nursing home has exceptional standards of care and well-maintained amenities, making it one of the trusted choices for senior living in Illinois.

(224) 543-7100

Quality ratings

Measured by Centers for Medicare & Medicaid Services (CMS)

Overall rating Info The Overall CMS Rating combines results from health inspections, staffing levels and quality measures. Health inspections carry the most weight. Staffing and quality scores can increase or decrease the final rating based on performance compared to state and national standards.
▼ 60.3% Below IL avg. ▼ 60.3% Below IL avg.Click the badge to see the full State ranking.Click here to see the full State ranking.
Health Inspection Info Based on the results of the facility's three most recent standard inspections and any complaint investigations. CMS reviews the number, scope, and severity of deficiencies, with more recent findings weighted more heavily.
▼ 64.0% Below IL avg. ▼ 64.0% Below IL avg.Click the badge to see the full State ranking.Click here to see the full State ranking.
Staffing Info Measures average nursing staff hours per resident per day, including Registered Nurses (RNs) and total nursing staff. Ratings are adjusted based on the level of care residents require and are compared to state and national benchmarks.
▼ 53.2% Below IL avg. ▼ 53.2% Below IL avg.Click the badge to see the full State ranking.Click here to see the full State ranking.
Quality Measures Info Based on clinical and physical health indicators reported to CMS, such as hospital readmissions, falls, pressure ulcers, and improvements in mobility. These measures reflect how well residents' health needs are being managed.
▼ 64.5% Below IL avg. ▼ 64.5% Below IL avg.Click the badge to see the full State ranking.Click here to see the full State ranking.

Staffing hours breakdown

Info Daily nursing hours per resident by staff type, reported to CMS. Higher is generally better — compare this facility to state and national averages to see where staffing stands.

Hours per resident per day — compared to Illinois state averages

Total nursing care / resident Info This home is ranked 110th out of 167 homes in Illinois. Total adjusted nursing hours per resident per day, combining RN, LPN, and aide time. CMS adjusts this for case-mix so facilities can be fairly compared.
2h 37m per day
Rank #110 / 167Nurse hours — State benchmarkedThis home is ranked 110th out of 167 homes in Illinois. Shows adjusted nurse hours per resident per day benchmarked to the Illinois average, with a ranking across 167 Illinois SNFs. More hours mean more direct care. The national average is about 3.5 hrs; below 3.0 is a red flag.Click the rank badge to see the full State ranking.Click here to see the full State ranking.
This facility Illinois avg (3h 6m per day)
vs Illinois avg
-16%
Staff typeHours / Day / Residentvs state avg
Weekend Total Nursing Info Combined nursing hours (RN + LPN + Nurse Aide) per resident per day on weekends. Staffing often drops on weekends — this figure reveals whether the facility maintains adequate coverage outside of weekday hours. 2h 56m per day

Types of Care at Serenity Estates of Lincolnshire

Nursing Home Memory Care Hospice Care

Capacity and availability

This home usually has availability

Occupancy lower than 85% suggests more openings may be available.

Lower occupancy than the Illinois average: 69.3%
Occupancy rate 46.5% Rank #180 / 199Occupancy rate — State benchmarkedThis home is ranked 180th out of 199 homes in Illinois. Shows this facility's occupancy rate versus the Illinois average, with its Statewide rank out of 199. Higher occupancy signals strong local demand and financial stability.Click the rank badge to see the full State ranking.Click here to see the full State ranking.
Avg. Length of Stay 77 days
Occupancy rate
46.5% Rank #180 / 199Occupancy rate — State benchmarkedThis home is ranked 180th out of 199 homes in Illinois. Shows this facility's occupancy rate versus the Illinois average, with its Statewide rank out of 199. Higher occupancy signals strong local demand and financial stability.Click the rank badge to see the full State ranking.Click here to see the full State ranking.
Avg. Length of Stay
77 days
Walk Score
Walk Score: 56 / 100 Rank #272 / 647Walk Score — State benchmarkedThis home is ranked 272nd out of 647 homes in Illinois. Shows how walkable this facility's neighborhood is compared to the average Walk Score across Illinois SNFs. Higher scores benefit residents, families, and staff.Click the rank badge to see the full State ranking.Click here to see the full State ranking.
Moderately walkable. Some errands can be accomplished on foot, with a mix of nearby amenities.

Contact Serenity Estates of Lincolnshire

Staffing Data

Reporting period: October 1 – December 31, 2025 (Q4 2025). Source: CMS Payroll-Based Journal report.

Total staff 145
Employees 124
Contractors 21
Staff to resident ratio 1.42:1
21% worse than Illinois average
Illinois average ratio: 1.80:1 Illinois average ratio: 1.80:1See full Illinois ranking
Avg staff/day 51
Average shift 7.5 hours
0% compared with Illinois average
Illinois average: 7.6 hours Illinois average shift: 7.6 hoursSee full Illinois ranking
Total staff hours (quarter) 35,303

Nursing staff breakdown

Q4 2025 · Oct 1 – Dec 31 More info This data comes from the CMS Payroll-Based Journal report covering October 1 – December 31, 2025.
Registered Nurse

Manages medical care and health needs.

RN Staff 17
Average shift length Info Average shift length. Calculated as total hours divided by days worked and average staff per day. 7.6 hours

No contractors work on this role.

Licensed Practical Nurse

Assists with medical care and medications.

LPN Staff 30
Average shift length Info Average shift length. Calculated as total hours divided by days worked and average staff per day. 8.6 hours

This role is partially covered by contractors.

Certified Nursing Assistant

Helps with daily care and mobility.

CNA Staff 57
Average shift length Info Average shift length. Calculated as total hours divided by days worked and average staff per day. 7.5 hours

This role is partially covered by contractors.

Contractor staffing

Q4 2025 · Oct 1 – Dec 31 More info This data comes from the CMS Payroll-Based Journal report covering October 1 – December 31, 2025.

Total hours from contractors

3.3%

1,168 contractor hours this quarter

Feeding Assistant: 7 Certified Nursing Assistant: 4 Licensed Practical Nurse: 3 Other Physician: 2 Occupational Therapy Aide: 1 Mental Health Service Worker: 1 Physician Assistant: 1 Medical Director: 1 Occupational Therapy Assistant: 1

Staff by category

Q4 2025 · Oct 1 – Dec 31 More info This data comes from the CMS Payroll-Based Journal report covering October 1 – December 31, 2025.
Certified Nursing Assistant5345715,15092100%7.5
Licensed Practical Nurse273307,22192100%8.6
Registered Nurse170173,17992100%7.6
Other Dietary Services Staff5051,66192100%7.4
Physical Therapist4041,59392100%6.3
RN Director of Nursing2029416672%7.8
Feeding Assistant0776826975%6.9
Respiratory Therapy Technician4045846874%7
Physical Therapy Assistant2025596571%7.5
Administrator1015206571%8
Physical Therapy Aide2025206874%6.1
Nurse Practitioner1014966267%8
Clinical Nurse Specialist1014966267%8
Speech Language Pathologist2024636065%6.5
Mental Health Service Worker1124285257%7.9
Qualified Social Worker1013405257%6.5
Dental Services Staff1012783538%7.9
Other Physician022591112%5.4
Occupational Therapy Aide011541314%4.2
Medical Director011301112%2.7
Occupational Therapy Assistant0112644%6.5
Physician Assistant0112433%8
57 Certified Nursing Assistant
% of Days 100%
30 Licensed Practical Nurse
% of Days 100%
17 Registered Nurse
% of Days 100%
5 Other Dietary Services Staff
% of Days 100%
4 Physical Therapist
% of Days 100%
2 RN Director of Nursing
% of Days 72%
7 Feeding Assistant
% of Days 75%
4 Respiratory Therapy Technician
% of Days 74%
2 Physical Therapy Assistant
% of Days 71%
1 Administrator
% of Days 71%
2 Physical Therapy Aide
% of Days 74%
1 Nurse Practitioner
% of Days 67%
1 Clinical Nurse Specialist
% of Days 67%
2 Speech Language Pathologist
% of Days 65%
2 Mental Health Service Worker
% of Days 57%
1 Qualified Social Worker
% of Days 57%
1 Dental Services Staff
% of Days 38%
2 Other Physician
% of Days 12%
1 Occupational Therapy Aide
% of Days 14%
1 Medical Director
% of Days 12%
1 Occupational Therapy Assistant
% of Days 4%
1 Physician Assistant
% of Days 3%

Penalties and fines

Includes penalties issued in 2023-2025

Federal penalties imposed by CMS for regulatory violations, including civil money penalties (fines) and denials of payment for new Medicare/Medicaid admissions.

Source: CMS Penalties Database (Data as of Jan 2026)

Total fines amount $364K Rank #166 / 168Federal fines — State benchmarkedThis home is ranked 166th out of 168 homes in Illinois. Shows this facility's cumulative CMS federal fine dollars versus the Illinois average among facilities with fines, and where it ranks among 168 skilled nursing facilities in the pool. Lower total dollars mean a better rank.Click the rank badge to see the full State ranking.Click here to see the full State ranking.
155% higher than Illinois average

Illinois average: $143K

Number of fines 11
271% more fines than Illinois average

Illinois average: 3.0

Payment Denials Info Serious action where Medicare and/or Medicaid temporarily stops payments for new residents until issues are fixed. 3
183% more payment denials than Illinois average

Illinois average: 1.1

Fines amount comparison
This facility $364K
Illinois average $143K
Penalty History

Penalties are imposed by CMS for violations of federal nursing home regulations.

10 penalties in the past 3 years

Multiple penalties were reported in the last 3 years.

Civil Money Penalty Info Fines imposed for noncompliance, which can be assessed per day or per instance of violation. Apr 17, 2025
$22K
Civil Money Penalty Info Fines imposed for noncompliance, which can be assessed per day or per instance of violation. Jan 22, 2025
$38K
Payment Denial Info Serious action where Medicare and/or Medicaid temporarily stops payments for new residents until issues are fixed. Jan 22, 2025
14 days
Civil Money Penalty Info Fines imposed for noncompliance, which can be assessed per day or per instance of violation. Dec 2, 2024
$22K

Last updated: Jan 2026

Quality of care over time

These measures show how residents usually do over time at this home, based on health outcomes and preventive care.

High-risk clinical events score Info A composite score based on pressure ulcers, falls with injury, weight loss, walking ability decline, and activities of daily living decline. 9.6
In line with Illinois average

Illinois average: 9.7

Functional decline score Info A composite score based on activities of daily living decline, walking ability decline, and incontinence. 10.1
46% better than Illinois average

Illinois average: 18.6

Long-stay resident measures
Need for Help with Daily Activities Increased Info Percent of long-stay residents whose need for help with daily activities has increased 6.1%
61% better than Illinois average

Illinois average: 15.5%

Walking Ability Worsened Info Percent of long-stay residents whose ability to move independently worsened 12.4%
33% better than Illinois average

Illinois average: 18.4%

Low Risk Residents with Bowel/Bladder Incontinence Info Percent of low risk long-stay residents who lose control of their bowels or bladder 11.8%
46% better than Illinois average

Illinois average: 21.6%

Falls with Major Injury Info Percent of long-stay residents experiencing one or more falls with major injury 4.8%
43% worse than Illinois average

Illinois average: 3.4%

High Risk Residents with Pressure Ulcers Info Percent of long-stay high risk residents with pressure ulcers 6.2%
17% worse than Illinois average

Illinois average: 5.3%

Urinary Tract Infection Info Percent of long-stay residents with a urinary tract infection 5.1%
181% worse than Illinois average

Illinois average: 1.8%

Lost Too Much Weight Info Percent of long-stay residents who lose too much weight 18.5%
184% worse than Illinois average

Illinois average: 6.5%

Depressive Symptoms Info Percent of long-stay residents who have depressive symptoms 33.3%
31% better than Illinois average

Illinois average: 48.1%

Antipsychotic Use Info Percent of long-stay residents who received an antipsychotic medication 21.8%
8% worse than Illinois average

Illinois average: 20.2%

Pneumococcal Vaccine Info Percent of long-stay residents assessed and appropriately given the pneumococcal vaccine 98.8%
11% better than Illinois average

Illinois average: 89.2%

Influenza Vaccine Info Percent of long-stay residents assessed and appropriately given the seasonal influenza vaccine 96.8%
6% better than Illinois average

Illinois average: 91.6%

Short-stay resident measures
Pneumococcal Vaccine Info Percent of short-stay residents assessed and appropriately given the pneumococcal vaccine 75.6%
11% better than Illinois average

Illinois average: 68.3%

Antipsychotic medication increase Info Percent of short-stay residents who newly received an antipsychotic medication 1.0%
58% better than Illinois average

Illinois average: 2.3%

Influenza Vaccine Info Percent of short-stay residents assessed and appropriately given the seasonal influenza vaccine 56.9%
10% worse than Illinois average

Illinois average: 63.0%

Breakdown by payment type

Medicare

40% of new residents, usually for short-term rehab.

Typical stay 16 days

Private pay

25% of new residents, often for short stays.

Typical stay 1 - 2 months

Medicaid

36% of new residents, often for long-term daily care.

Typical stay 5 - 6 months

Facility Characteristics

Source: CMS Long-Term Care Facility Characteristics (Data as of Jan 2026)

Total residents 102
Medicare
12
11.8% of residents
Medicaid
81
79.4% of residents
Private pay or other
9
8.8% of residents
Programs & Services
Residents Group

Residents meet regularly to discuss policies, care quality, and activities

Active Resident Council

Organized group of residents that meets regularly to discuss facility policies, quality of life, and activities.

Finances and operations

Privately-owned community
Home revenue
$5.8M
Operating loss
-$3.5M
Privately-owned community
Home revenue
$5.8M Rank #157 / 166Revenue — State benchmarkedThis home is ranked 157th out of 166 homes in Illinois. Shows this facility's annual revenue compared to the Illinois SNF average. Higher revenue generally means more resources for staffing and capital — read alongside Payroll %.Click the rank badge to see the full State ranking.Click here to see the full State ranking.
Operating loss
-$3.5M
Payroll costs Info The portion of the home's budget spent on staff, including nurses, caregivers, and other employees who support care and operations. Rank #130 / 166Payroll — State benchmarkedThis home is ranked 130th out of 166 homes in Illinois. Shows total annual staff payroll benchmarked to the Illinois average. Higher payroll investment relative to peers often signals better staffing and less reliance on cheaper contract labor.Click the rank badge to see the full State ranking.Click here to see the full State ranking.
$5.1M
88.5% of revenue Rank #2 / 166Payroll % — State benchmarkedThis home is ranked 2nd out of 166 homes in Illinois. Shows payroll as a percentage of revenue versus the Illinois average. Well-run Illinois SNFs typically land around 54–67% — the top third Statewide. Below 25% may signal understaffing or heavy agency use — read with Staffing ratings.Click the rank badge to see the full State ranking.Click here to see the full State ranking.
Other operating costs Info All remaining costs needed to run the home, such as food, utilities, building maintenance, supplies and administrative expenses.
$4.2M
Total costs $9.3M

What does this home offer?

Housing options icon

Housing Options: Private Rooms

Building type icon
Building type icon

Building Type: Single-story

On-site medical care and health services icon

On-site Medical Care and Health Services

Rehabilitative support icon

Rehabilitative Support

Dining services icon

Dining Services

Social and recreational activities icon

Social and Recreational Activities

Transportation services icon

Transportation Services

Who this home usually serves

TYPE OF STAY

Mostly short-term rehab stays

Most residents typically stay for a few weeks or months before returning home or moving on.

Places of interest near Serenity Estates of Lincolnshire

Address 0.6 miles from city center Info Estimated distance in miles from Lincolnshire's city center to Serenity Estates of Lincolnshire's address, calculated via Google Maps.

Calculate Travel Distance to Serenity Estates of Lincolnshire

Add your location

Address

Financial Assistance for
Nursing Home in Illinois

Serenity Estates of Lincolnshire is located in Lincolnshire, Illinois.
Here are the financial assistance programs available to residents in Illinois.

Get Financial aid guidance

Community Care Program

Illinois CCP

Age 60+
General Illinois resident, at risk of nursing home placement.
Income Limits (2025) ~$1,215/month individual
Asset Limits $17,500 individual, excludes home, car
IL

High demand in urban areas; waitlists possible.

Benefits
In-home care (3-5 hours/day) Adult day services ($65/day) Emergency home response systems ($30/month)

Illinois Respite Program

IL Respite (via NFCSP)

Age Caregiver of someone 60+ (or with dementia)
General Illinois resident.
Income Limits No strict limit; prioritizes low-income.
Asset Limits Not applicable.
IL

Limited slots; urban/rural balance.

Benefits
In-home respite (4-6 hours/day) Adult day care (~$65/day) Short-term facility care (up to 5 days)

Supportive Living Program (SLP)

Illinois Medicaid Supportive Living Program

Age 65+ or 22-64 with disability
General Illinois resident, Medicaid-eligible, needs moderate assistance (not nursing home-level).
Income Limits (2025) ~$2,829/month (300% FBR, individual); QIT allowed.
Asset Limits $2,000 (individual), $3,000 (couple) (excludes home, car).
IL

~200 SLP sites statewide; room/board not covered.

Benefits
Personal care (5-7 hours/day, e.g., bathing, mobility) Meals Housekeeping Medication management Respite (~240 hours/year)

Persons Who Are Elderly Waiver

Illinois Medicaid Elderly Waiver

Age 65+
General Illinois resident, Medicaid-eligible, nursing home-level care need.
Income Limits (2025) ~$2,829/month 300% FBR, individual
Asset Limits $2,000 (individual), $3,000 (couple).
IL

Part of HealthChoice Illinois; consumer-directed options available.

Benefits
Personal care (5-7 hours/day, e.g., dressing, eating) Homemaker Adult day care (~$60/day) Respite (240 hours/year) Home mods ($1,000 avg.)

Medicare Savings Program (MSP)

Illinois Medicare Savings Program

Age 65+ or disabled
General Illinois resident, Medicare Part A/B.
Income Limits (2025) ~$2,510/month (QMB), ~$3,380/month (SLMB), ~$3,598/month (QI)—individual.
Asset Limits $9,430 (individual), $14,130 (couple).
IL

Three tiers; no waitlist.

Benefits
Covers Part B premiums ($174.70/month) Deductibles ($240/year) Copays (~20%)

Optional State Supplementation (OSS)

Illinois Optional State Supplementation

Age 65+ or disabled
General Illinois resident, in approved facility, SSI recipient or low-income.
Income Limits (2025) ~$1,004/month including SSI
Asset Limits $2,000 (individual), $3,000 (couple).
IL

~$50-$500/month based on facility type.

Benefits
Cash (~$50-$500/month) for room/board in personal care homes or SLFs

VA Aid and Attendance (A&A) and Housebound Benefits

Illinois VA Aid and Attendance/Housebound

Age 65+ or disabled veteran/spouse
General Illinois resident, wartime service, need for ADL help (A&A) or homebound.
Income Limits (2025) Net income < ~$1,984/month (veteran with dependent, A&A); pension offsets income.
Asset Limits ~$155,356 net worth limit
IL

High veteran demand in urban/rural areas.

Benefits
Cash (~$1,433-$2,642/month veteran, ~$951-$1,318 spouse) for care costs (e.g., in-home, assisted living)

Compare Nursing Home around Vernon Hills

The information below is reported by the Illinois Department of Public Health, Office of Health Care Regulation.

3 facilities compared · CMS & IL Dept. of Health data

Filter by care type
Avantara Libertyville
NH

Nursing Home Licensed facility providing 24/7 skilled nursing care for residents with complex, ongoing medical needs. Staffed by RNs, LPNs, and CNAs. Inspected and star-rated annually by CMS. Accepts Medicare (short-term rehab) and Medicaid (long-term care).

MC

Memory Care Secured, specialized care for people living with Alzheimer's or dementia. Staff trained in cognitive impairment, with higher staff-to-resident ratios and an environment designed to reduce confusion and wandering risk.

Libertyville150 61.8% -11%2.98 +65%-4%$139.0k273.02104 54 Karil Skinner$10.6M$5.1M48.2%145593
Thrive of Lake County
NH

Nursing Home Licensed facility providing 24/7 skilled nursing care for residents with complex, ongoing medical needs. Staffed by RNs, LPNs, and CNAs. Inspected and star-rated annually by CMS. Accepts Medicare (short-term rehab) and Medicaid (long-term care).

MC

Memory Care Secured, specialized care for people living with Alzheimer's or dementia. Staff trained in cognitive impairment, with higher staff-to-resident ratios and an environment designed to reduce confusion and wandering risk.

Mundelein185 82.9% +20%2.11 +61%-32%$65.5k803.55158 46 Ihop Jv Opco LLC$31.1M$11.1M35.6%145460
Serenity Estates of Lincolnshire
NH

Nursing Home Licensed facility providing 24/7 skilled nursing care for residents with complex, ongoing medical needs. Staffed by RNs, LPNs, and CNAs. Inspected and star-rated annually by CMS. Accepts Medicare (short-term rehab) and Medicaid (long-term care).

HC

Home Care Professional care delivered in the person's own home — from companionship and errands to skilled nursing and therapy. Allows seniors to age in place. Medicare covers skilled home health when medically necessary.

MC

Memory Care Secured, specialized care for people living with Alzheimer's or dementia. Staff trained in cognitive impairment, with higher staff-to-resident ratios and an environment designed to reduce confusion and wandering risk.

Lincolnshire144 46.5% -33%2.61 -18%-16%$360.3k582.311105 56 Arnold Goldberg$5.8M$5.1M88.5%146028

Frequently Asked Questions about Serenity Estates of Lincolnshire

Is Serenity Estates of Lincolnshire in a walkable area?

Serenity Estates of Lincolnshire has a walk score of 56. Moderately walkable. Some errands can be accomplished on foot, with a mix of nearby amenities.

What is the address of Serenity Estates of Lincolnshire?

Serenity Estates of Lincolnshire is located at 150 Jamestown Ln, Lincolnshire, IL 60069.

What is the phone number of Serenity Estates of Lincolnshire?

(224) 543-7100 will put you in contact with the team at Serenity Estates of Lincolnshire.

Is Serenity Estates of Lincolnshire Medicare or Medicaid certified?

Yes — Serenity Estates of Lincolnshire is a CMS-certified provider of Medicare and Medicaid.

Guides for Better Senior Living

Care Cost Calculator: See Prices in Your Area

Nursing Home Data Explorer

Don’t Wait Too Long: 7 Red Flag Signs Your Parent Needs Assisted Living Now

The True Cost of Assisted Living in 2025 – And How Families Are Paying For It

Understanding Senior Living Costs: Pricing Models, Discounts & Financial Assistance

Explore Open Rooms
1 Contact details
2 What type of senior care service are you looking for?
3 What budget do you have in mind for senior care?
4 How soon do you need to find care?
5 Additional details

Thank you for your interest!

Our team will be in touch shortly to help with next steps.