Signature HealthCARE of Chapel Hill
Nursing Home, Hospice Care, Nursing Care & Palliative Care · Chapel Hill, NC
CMS overall rating Info CMS (the Centers for Medicare & Medicaid Services) is the federal agency that rates nursing home quality. Its Overall Rating runs from 1 to 5 stars, combining health inspections, staffing, and quality measures, with inspections weighted most heavily.

Signature HealthCARE of Chapel Hill

Nursing Home, Hospice Care, Nursing Care & Palliative Care · Chapel Hill, NC
CMS overall rating Info CMS (the Centers for Medicare & Medicaid Services) is the federal agency that rates nursing home quality. Its Overall Rating runs from 1 to 5 stars, combining health inspections, staffing, and quality measures, with inspections weighted most heavily.
Calculator: See prices in your area
Signature HealthCARE of Chapel Hill accepts Medicare, Medicaid, and private pay.

Overview of Signature Healthcare of Chapel Hill

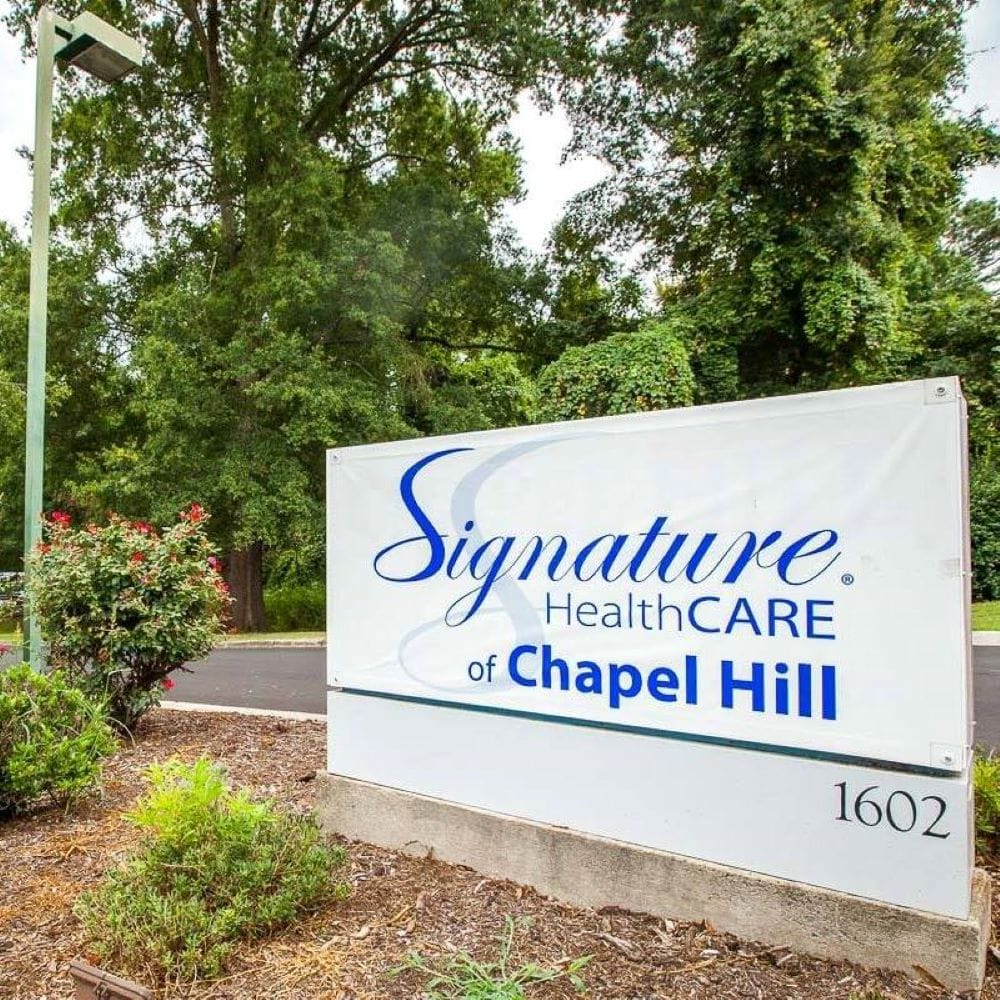
Located at the core of Chapel Hill, NC, Signature Healthcare of Chapel Hill is a respected senior living community, offering an array of clinical services to help residents recover from their conditions or hospitalization. The community features excellent rehabilitation services and skilled nursing care tailored to residents’ needs and goals, making sure they are given the services that best work for them. Snug and stunning accommodations are also offered to give residents the space they need to comfortably relax and rest.

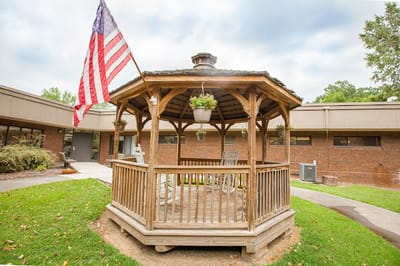
Committed to helping residents continue living their lives to the fullest, the community offers a wide array of activities, including regular outings, hobby clubs, and their annual Signature Olympics events and resident art shows. Residents also benefit from having access to additional amenities, such as an on-site chaplain, transportation, and volunteer opportunities for a fulfilling living experience. Here, residents are empowered to enjoy their golden years vibrantly and comfortably.

(919) 967-1418

Quality ratings

Measured by Centers for Medicare & Medicaid Services (CMS)

Overall rating Info The Overall CMS Rating combines results from health inspections, staffing levels and quality measures. Health inspections carry the most weight. Staffing and quality scores can increase or decrease the final rating based on performance compared to state and national standards.
▲ 7.3% Above NC avg. ▲ 7.3% Above NC avg.NC average: 2.8Click the badge to see the full State ranking.Click here to see the full State ranking.
Health Inspection Info Based on the results of the facility's three most recent standard inspections and any complaint investigations. CMS reviews the number, scope, and severity of deficiencies, with more recent findings weighted more heavily.
▲ 6.2% Above NC avg. ▲ 6.2% Above NC avg.NC average: 2.8Click the badge to see the full State ranking.Click here to see the full State ranking.
Staffing Info Measures average nursing staff hours per resident per day, including Registered Nurses (RNs) and total nursing staff. Ratings are adjusted based on the level of care residents require and are compared to state and national benchmarks.
▲ 12.8% Above NC avg. ▲ 12.8% Above NC avg.NC average: 2.7Click the badge to see the full State ranking.Click here to see the full State ranking.
Quality Measures Info Based on clinical and physical health indicators reported to CMS, such as hospital readmissions, falls, pressure ulcers, and improvements in mobility. These measures reflect how well residents' health needs are being managed.
▼ 37.0% Below NC avg. ▼ 37.0% Below NC avg.NC average: 3.2Click the badge to see the full State ranking.Click here to see the full State ranking.

Staffing hours breakdown

Info Daily nursing hours per resident by staff type, reported to CMS. Higher is generally better — compare this facility to state and national averages to see where staffing stands.

Hours per resident per day — compared to North Carolina state averages

Total nursing care / resident Info This home is ranked 43rd out of 97 homes in North Carolina for nurse hours. Total adjusted nursing hours per resident per day, combining RN, LPN, and aide time. CMS adjusts this for case-mix so facilities can be fairly compared.
3h 58m per day
Rank #43 / 97Nurse hours — State benchmarkedThis home is ranked 43rd out of 97 homes in North Carolina. Shows adjusted nurse hours per resident per day benchmarked to the North Carolina average, with a ranking across 97 North Carolina facilities. More hours mean more direct care. The national average is about 3.5 hrs; below 3.0 is a red flag.Rankings are based only on facilities in North Carolina that report data for that category. Facilities without available data are excluded from the ranking.Click the rank badge to see the full State ranking.Click here to see the full State ranking.
This facility North Carolina avg (3h 59m per day)
vs North Carolina avg
+0%

3 of 6 metrics below state avg

Standout metric Physical Therapist is +55% above state avg
Staff typeHours / Day / Residentvs state avg
Registered Nurse (RN) Info RNs hold the highest nursing license and can assess residents, interpret test results, and direct care plans. More RN hours per day often signals stronger clinical oversight and faster response to health changes. 54m per day ▲ 54% State avg: 35m per day · National avg: 41m per day
LPN / LVN Info Licensed Practical Nurses (LPNs) or Licensed Vocational Nurses (LVNs) deliver routine hands-on care — medication administration, wound dressing, and monitoring vital signs. They work under RN supervision and make up a large share of daily bedside care. 32m per day ▼ 39% State avg: 52m per day · National avg: 52m per day
Nurse Aide Info Certified Nurse Aides (CNAs) provide the most direct day-to-day assistance: bathing, dressing, feeding, and mobility. Nurse aide hours are typically the largest staffing category and directly affect residents' quality of life. 1h 59m per day ▼ 14% State avg: 2h 19m per day · National avg: 2h 21m per day
Weekend Total Nursing Info Combined nursing hours (RN + LPN + Nurse Aide) per resident per day on weekends. Staffing often drops on weekends — this figure reveals whether the facility maintains adequate coverage outside of weekday hours. 2h 52m per day ▼ 14% State avg: 3h 20m per day · National avg: 3h 26m per day
Physical Therapist Info Hours per resident per day provided by licensed Physical Therapists (PTs) or PT Assistants. PT services help residents recover mobility after injury or illness and are especially important for post-acute (short-stay) rehabilitation. 8m per day ▲ 55% State avg: 5m per day · National avg: 4m per day
Weekend RN Info Registered nurse hours specifically on weekends. Facilities sometimes reduce RN presence on Saturdays and Sundays — a low weekend RN figure compared to weekday hours can indicate reduced clinical oversight when most administrative staff are absent. 35m per day ▲ 53% State avg: 23m per day · National avg: 29m per day

Capacity and availability

This home usually has availability

Higher occupancy than the North Carolina average: 76.4%
Occupancy rate
82.8% Rank #90 / 271Occupancy rate — State benchmarkedThis home is ranked 90th out of 271 homes in North Carolina. Shows this facility's occupancy rate versus the North Carolina average, with its Statewide rank out of 271. Higher occupancy signals strong local demand and financial stability.Rankings are based only on facilities in North Carolina that report data for that category. Facilities without available data are excluded from the ranking.Click the rank badge to see the full State ranking.Click here to see the full State ranking.
Avg. Length of Stay
71 days
Bed community size
108-bed community Rank #65 / 390Bed count — State benchmarkedThis home is ranked 65th out of 390 homes in North Carolina. Shows this facility's certified or reported bed count compared to other North Carolina facilities. Larger communities may offer more amenities, programs, and on-site services for residents and families.Rankings are based only on facilities in North Carolina that report data for that category. Facilities without available data are excluded from the ranking.Click the rank badge to see the full State ranking.Click here to see the full State ranking.
A larger shared setting that may offer more common spaces and organized community services.
Walk Score
Walk Score: 74 / 100 Rank #14 / 572Walk Score — State benchmarkedThis home is ranked 14th out of 572 homes in North Carolina. Shows how walkable this facility's neighborhood is compared to the average Walk Score across North Carolina facilities. Higher scores benefit residents, families, and staff.Rankings are based only on facilities in North Carolina that report data for that category. Facilities without available data are excluded from the ranking.Click the rank badge to see the full State ranking.Click here to see the full State ranking.
Very walkable. Most errands can be accomplished on foot, and many essentials are within a short walk.

Contact Signature HealthCARE of Chapel Hill

Staffing Data

Reporting period: October 1 – December 31, 2025 (Q4 2025). Source: CMS Payroll-Based Journal report.

Total staff 142
Employees 137
Contractors 5
Staff to resident ratio 1.49 : 1
17% fewer staff per resident than North Carolina average
North Carolina average ratio: 1.80 : 1 North Carolina average ratio: 1.80 : 1See full North Carolina ranking
Avg staff/day 49
Average shift 8.2 hours
0% compared with North Carolina average
North Carolina average: 8 hours North Carolina average shift: 8 hoursSee full North Carolina ranking
Total staff hours (quarter) 37,029

Nursing staff breakdown

Q4 2025 · Oct 1 – Dec 31 More info This data comes from the CMS Payroll-Based Journal report covering October 1 – December 31, 2025.
Registered Nurse

Manages medical care and health needs.

RN Staff Info All 21 RN Staff are full-time employees. No contractors work on this role. 21
Average shift length Info Average shift length. Calculated as total hours divided by days worked and average staff per day. 9.6 hours
Licensed Practical Nurse

Assists with medical care and medications.

LPN Staff Info All 9 LPN Staff are full-time employees. No contractors work on this role. 9
Average shift length Info Average shift length. Calculated as total hours divided by days worked and average staff per day. 10.3 hours
Certified Nursing Assistant

Helps with daily care and mobility.

CNA Staff Info All 63 CNA Staff are full-time employees. No contractors work on this role. 63
Average shift length Info Average shift length. Calculated as total hours divided by days worked and average staff per day. 8 hours

Contractor staffing

Q4 2025 · Oct 1 – Dec 31 More info This data comes from the CMS Payroll-Based Journal report covering October 1 – December 31, 2025.

Total hours from contractors

0.3%

129 contractor hours this quarter

Occupational Therapy Assistant: 4 Medical Director: 1

Staff by category

Q4 2025 · Oct 1 – Dec 31 More info This data comes from the CMS Payroll-Based Journal report covering October 1 – December 31, 2025.
Certified Nursing Assistant6306316,88292100%8
Registered Nurse210216,43292100%9.6
Licensed Practical Nurse9093,1069199%10.3
RN Director of Nursing7071,6368087%8.3
Clinical Nurse Specialist9091,3246571%7.5
Respiratory Therapy Technician5051,1698289%7.7
Medication Aide/Technician4041,0757582%8.9
Speech Language Pathologist3039167076%7.7
Physical Therapy Assistant2028726571%8.1
Physical Therapy Aide2025937986%5.6
Other Dietary Services Staff1015826267%9.4
Administrator2025686470%8
Mental Health Service Worker1014886166%8
Qualified Social Worker3034246571%6.2
Dental Services Staff2023915358%7.4
Nurse Practitioner2023554650%7.7
Occupational Therapy Assistant044931718%5.5
Dietitian101901213%7.5
Medical Director011361820%2
63 Certified Nursing Assistant
% of Days 100%
21 Registered Nurse
% of Days 100%
9 Licensed Practical Nurse
% of Days 99%
7 RN Director of Nursing
% of Days 87%
9 Clinical Nurse Specialist
% of Days 71%
5 Respiratory Therapy Technician
% of Days 89%
4 Medication Aide/Technician
% of Days 82%
3 Speech Language Pathologist
% of Days 76%
2 Physical Therapy Assistant
% of Days 71%
2 Physical Therapy Aide
% of Days 86%
1 Other Dietary Services Staff
% of Days 67%
2 Administrator
% of Days 70%
1 Mental Health Service Worker
% of Days 66%
3 Qualified Social Worker
% of Days 71%
2 Dental Services Staff
% of Days 58%
2 Nurse Practitioner
% of Days 50%
4 Occupational Therapy Assistant
% of Days 18%
1 Dietitian
% of Days 13%
1 Medical Director
% of Days 20%

Penalties and fines

Federal penalties imposed by CMS for regulatory violations, including civil money penalties (fines) and denials of payment for new Medicare/Medicaid admissions.

Source: CMS Penalties Database

No penalties in the past 3 years

No civil money penalties or payment denials were reported in the last 3 years.

Quality of care over time

These measures show how residents usually do over time at this home, based on health outcomes and preventive care.

High-risk clinical events score Info A composite score based on pressure ulcers, falls with injury, weight loss, walking ability decline, and activities of daily living decline. 12.7
11% worse than North Carolina average

North Carolina average: 11.5

Functional decline score Info A composite score based on activities of daily living decline, walking ability decline, and incontinence. 24.3
18% worse than North Carolina average

North Carolina average: 20.6

Long-stay resident measures
Below average North Carolina avg: 2.9 Info CMS star rating based on long-stay quality measure performance. 5 stars = significantly above average, 1 star = significantly below average.
Need for Help with Daily Activities Increased Info Percent of long-stay residents whose need for help with daily activities has increased 18.1%
In line with North Carolina average

North Carolina average: 17.5%

Walking Ability Worsened Info Percent of long-stay residents whose ability to move independently worsened 29.5%
27% worse than North Carolina average

North Carolina average: 23.3%

Low Risk Residents with Bowel/Bladder Incontinence Info Percent of low risk long-stay residents who lose control of their bowels or bladder 25.4%
19% worse than North Carolina average

North Carolina average: 21.4%

Falls with Major Injury Info Percent of long-stay residents experiencing one or more falls with major injury 3.4%
7% better than North Carolina average

North Carolina average: 3.6%

High Risk Residents with Pressure Ulcers Info Percent of long-stay high risk residents with pressure ulcers 5.2%
18% better than North Carolina average

North Carolina average: 6.3%

Urinary Tract Infection Info Percent of long-stay residents with a urinary tract infection 0.0%
100% better than North Carolina average

North Carolina average: 2.6%

Lost Too Much Weight Info Percent of long-stay residents who lose too much weight 7.4%
In line with North Carolina average

North Carolina average: 7.4%

Depressive Symptoms Info Percent of long-stay residents who have depressive symptoms 7.3%
66% worse than North Carolina average

North Carolina average: 4.4%

Antipsychotic Use Info Percent of long-stay residents who received an antipsychotic medication 14.6%
9% worse than North Carolina average

North Carolina average: 13.4%

Pneumococcal Vaccine Info Percent of long-stay residents assessed and appropriately given the pneumococcal vaccine 99.3%
8% better than North Carolina average

North Carolina average: 91.6%

Influenza Vaccine Info Percent of long-stay residents assessed and appropriately given the seasonal influenza vaccine 97.4%
In line with North Carolina average

North Carolina average: 94.1%

Hospitalizations per 1,000 days Info Number of hospitalizations per 1,000 long-stay resident days. 2.52
42% worse than North Carolina average

North Carolina average: 1.77

ED visits per 1,000 days Info Number of outpatient emergency department visits per 1,000 long-stay resident days. 2.31
27% worse than North Carolina average

North Carolina average: 1.82

Short-stay resident measures
Average North Carolina avg: 2.9 Info CMS star rating based on short-stay quality measure performance. 5 stars = much above average, 1 star = much below average.
Pneumococcal Vaccine Info Percent of short-stay residents assessed and appropriately given the pneumococcal vaccine 89.0%
11% better than North Carolina average

North Carolina average: 79.9%

Antipsychotic medication increase Info Percent of short-stay residents who newly received an antipsychotic medication 0.9%
39% better than North Carolina average

North Carolina average: 1.5%

Influenza Vaccine Info Percent of short-stay residents assessed and appropriately given the seasonal influenza vaccine 87.3%
12% better than North Carolina average

North Carolina average: 78.1%

Re-hospitalized after SNF stay Info Percentage of short-stay residents who were re-hospitalized after their nursing home admission. 24.1%
5% worse than North Carolina average

North Carolina average: 22.9%

Emergency department visits Info Percentage of short-stay residents who had an outpatient emergency department visit. 17.1%
30% worse than North Carolina average

North Carolina average: 13.2%

Falls with major injury Info Percentage of SNF residents who experience falls with major injury during their stay. 0.8%
6% worse than North Carolina average

North Carolina average: 0.8%

Ability to care for self at discharge Info Percentage of residents at or above expected ability to care for themselves at discharge. 60.0%
12% better than North Carolina average

North Carolina average: 53.7%

Successful return to home or community Info Rate of successful return to home or community from a skilled nursing facility. 54.3%
7% better than North Carolina average

North Carolina average: 50.6%

Breakdown by payment type

Medicare

26% of new residents, usually for short-term rehab.

Typical stay 28 days

Private pay

59% of new residents, often for short stays.

Typical stay 29 days

Medicaid

15% of new residents, often for long-term daily care.

Typical stay 10 - 11 months

Facility Characteristics

Source: CMS Long-Term Care Facility Characteristics (Data as of Jan 2026)

Total residents 95
Medicare
15
15.8% of residents
Medicaid
55
57.9% of residents
Private pay or other
25
26.3% of residents
Programs & Services
Residents Group

Residents meet regularly to discuss policies, care quality, and activities

Active Resident Council

Organized group of residents that meets regularly to discuss facility policies, quality of life, and activities.

Finances and operations

Based on CMS SNF Cost Report for fiscal year ending in 12/2023.

Voluntary non-profit community
Operated by a church.
Net patient revenue Info Net patient revenue — what the home actually collects for resident care, after contractual allowances, bad debt and discounts are subtracted from its gross charges (CMS cost report, Worksheet G-3). It covers resident care only; money the home earns from other sources is shown separately as "Other income."
$11.3M
Net patient income Info Net patient income: net patient revenue minus the home's total operating expenses. A positive figure means it earns more from resident care than it spends to deliver it; a negative figure means the opposite. It excludes non-operating "other income."
-$84.1K
Voluntary non-profit community Operated by a church.
Net patient revenue Info Net patient revenue — what the home actually collects for resident care, after contractual allowances, bad debt and discounts are subtracted from its gross charges (CMS cost report, Worksheet G-3). It covers resident care only; money the home earns from other sources is shown separately as "Other income."
$11.3M Rank #67 / 104Revenue — State benchmarkedThis home is ranked 67th out of 104 homes in North Carolina. Shows this facility's annual revenue compared to the North Carolina average. Higher revenue generally means more resources for staffing and capital — read alongside Payroll %.Rankings are based only on facilities in North Carolina that report data for that category. Facilities without available data are excluded from the ranking.Click the rank badge to see the full State ranking.Click here to see the full State ranking.
Net patient income Info Net patient income: net patient revenue minus the home's total operating expenses. A positive figure means it earns more from resident care than it spends to deliver it; a negative figure means the opposite. It excludes non-operating "other income."
-$84.1K
Other income Info Money the home earns outside of resident care — such as investments, grants, rentals and other non-operating sources (CMS cost report, Worksheet G-3). It is tracked separately from net patient revenue: it is not part of that figure, and it is not included in net patient income.
$384.4K
Payroll costs Info Staff salaries plus wage-related costs — benefits such as payroll taxes, health insurance and retirement — from the home's own accounting records (CMS cost report, Worksheet A). Contract or agency labor is counted separately, under other operating costs. Rank #76 / 104Payroll — State benchmarkedThis home is ranked 76th out of 104 homes in North Carolina. Shows total annual staff payroll benchmarked to the North Carolina average. Higher payroll investment relative to peers often signals better staffing and less reliance on cheaper contract labor.Rankings are based only on facilities in North Carolina that report data for that category. Facilities without available data are excluded from the ranking.Click the rank badge to see the full State ranking.Click here to see the full State ranking.
$4.4M 39.1% of net patient revenue Info Payroll as a share of revenue: staff salaries and wage-related benefits divided by net patient revenue. A higher figure means more of each revenue dollar goes to staff pay. Rank #53 / 104Payroll % — State benchmarkedThis home is ranked 53rd out of 104 homes in North Carolina. Shows payroll as a percentage of revenue versus the North Carolina average. Well-run North Carolina facilities typically land around 49–62% — the top third Statewide. Below 25% may signal understaffing or heavy agency use — read with Staffing ratings.Rankings are based only on facilities in North Carolina that report data for that category. Facilities without available data are excluded from the ranking.Click the rank badge to see the full State ranking.Click here to see the full State ranking.
Other operating costs Info Everything it costs to run the home apart from payroll — food, utilities, supplies, maintenance, contract labor and administration. Calculated as total operating expense minus payroll (staff salaries and wage-related benefits).
$6.9M
Total costs Info The home's total operating expense for the year — all the costs of running it, salaries included (CMS cost report, Worksheet G-3).
$11.4M

What does this home offer?

Building type icon
Building type icon

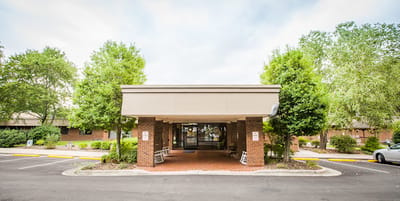
Building Type: Single-story

Who this home usually serves

TYPE OF STAY

Mix of rehab and long-term care

This home supports both short-term rehab and long-term care, with residents staying for a wide range of durations.

Most new residents arrive under private pay (59% of admissions), and a typical private pay stay runs around 29 days.

Admissions
464 total

Coverage residents most often arrive under.

Medicare 26%
Private pay 59%
Medicaid 15%
Discharges
462 total

Coverage residents most often leave under.

Medicare 18%
Private pay 59%
Medicaid 23%

Signature HealthCARE of Chapel Hill Reviews

Susan T
Was a little uncertain about the facility given other reviews, but found it to be a great place with very competent, friendly, and caring staff. Staff work well together, the place is very clean, and the food is great. PT/OT staff are the best—workouts are fun and productive! Management staff are very helpful and clearly operate on the philosophy that the patient comes first! This place is better than some of the 5 star facilities in Durham. Give them a try! You won’t be disappointed!What do you like most about living here? Answer: Staff are friendly and caring Are there enough caregivers to handle the residents' needs, especially during emergencies? Answer: Yes 
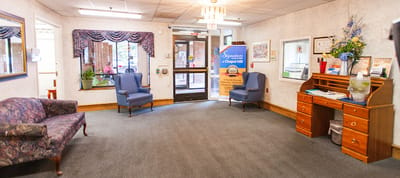
Are the common areas pleasant and comfortable for socializing or relaxing? Answer: Yes How would you rate the quality and variety of the meals? (1-5) Answer: 4 Are special diets handled well? Answer: Yes Is the dining schedule flexible enough to meet your preferences? Answer: Yes How do you feel about the level of social interaction available with other residents? Answer: It’s variable How was the units offered in this community? Answer: Do you feel safe living in this community? Answer: Yes How well do you think the community handles emergencies or unexpected events? Answer: Are there any hidden fees or unexpected charges? Answer: Would you recommend this community to others looking for senior living options? Answer: Yes

Places of interest near Signature HealthCARE of Chapel Hill

Address 2.4 miles from city center Info Estimated distance in miles from Chapel Hill's city center to Signature HealthCARE of Chapel Hill's address, calculated via Google Maps.

Calculate Travel Distance to Signature HealthCARE of Chapel Hill

Add your location

Address

Compare Nursing Homes around Chapel Hill

The information below is reported by the North Carolina Department of Health and Human Services, Division of Health Service Regulation.

2 facilities compared · CMS & NC Dept. of Health data

Carol Woods
NH
AL
IL
NC
Chapel Hill (Carol Woods)
30
Facility 30
NC AVG 72
Rank #329 / 390
76.7%
Facility 76.7%
NC AVG 76.4%
Rank #125 / 271
0%
5.94
Facility 5.94
NC AVG 3.98
Rank #11 / 97
+239%+49%
$0
Facility $0
NC AVG $74.6k
Rank #1 / 105
7
Facility 7
NC AVG 20.9
Rank #27 / 101
3.5
Facility 3.5
NC AVG 5.0
Rank #41 / 101
-22-
13
Facility 13
NC AVG 33
Rank #432 / 572
The Chapel Hill Residential Retirement Center, Inc
$29.1M
Facility $29.1M
NC AVG $13.2M
Rank #8 / 104
$18.0M
Facility $18.0M
NC AVG $4.9M
Rank #8 / 104
61.7%
Facility 61.7%
NC AVG 39.8%
Rank #83 / 104
345199
Signature HealthCARE of Chapel Hill
NH
HC
NC
PC
Chapel Hill (East Franklin Street)
108
Facility 108
NC AVG 72
Rank #65 / 390
82.8%
Facility 82.8%
NC AVG 76.4%
Rank #90 / 271
+8%
3.96
Facility 3.96
NC AVG 3.98
Rank #43 / 97
+62%0%
$0
Facility $0
NC AVG $74.6k
Rank #1 / 105
20
Facility 20
NC AVG 20.9
Rank #67 / 101
5.0
Facility 5.0
NC AVG 5.0
Rank #67 / 101
-98-
74
Facility 74
NC AVG 33
Rank #14 / 572
Moses Muhairwe
$11.3M
Facility $11.3M
NC AVG $13.2M
Rank #67 / 104
$4.4M
Facility $4.4M
NC AVG $4.9M
Rank #76 / 104
39.1%
Facility 39.1%
NC AVG 39.8%
Rank #53 / 104
345225

Financial Assistance for
Nursing Home in North Carolina

Signature HealthCARE of Chapel Hill is located in Chapel Hill, North Carolina.
Here are the financial assistance programs available to residents in North Carolina.

Get Financial aid guidance

Community Alternatives Program for Disabled Adults

NC Medicaid CAP/DA

Age 65+ or disabled
General North Carolina resident, Medicaid- eligible, nursing home-level care need.
Income Limits (2025) ~$2,829/month 300% FBR, individual
Asset Limits $2,000 (individual), $3,000 (couple).
NC

High demand; waitlists common in urban areas.

Benefits
Personal care (5-7 hours/day) Respite (240 hours/year) Adult day care ($60/day) Home modifications ($1,500 avg.)

North Carolina Senior Care Options

NC SCO (via NFCSP)

Age Caregiver of someone 60+ (or with dementia)
General North Carolina resident.
Income Limits No strict limit; prioritizes low-income.
Asset Limits Not applicable.
NC

Limited slots; rural/urban balance.

Benefits
In-home respite (4-6 hours/day) Adult day care (~$60/day) Short-term facility care (up to 5 days)

Program of All-Inclusive Care for the Elderly (PACE)

North Carolina PACE (e.g., PACE of the Triad)

Age 55+
General NC resident (specific counties), NFLOC, safe with PACE support.
Income Limits (2025) ~$2,829/month (Medicaid-eligible); private pay option available.
Asset Limits $2,000 (individual), $3,000 (couple) for Medicaid enrollees.
NC

Available in 10+ counties (e.g., Guilford, Wake); multiple providers (e.g., PACE of the Southern Piedmont).

Benefits
Personal care (5-7 hours/day) Medical care Meals Transportation Respite Therapies

In-Home Aide Services

North Carolina In-Home Aide Services

Age 60+
General NC resident, unable to perform 1+ ADL, at risk of nursing home placement.
Income Limits (2025) No strict cap; prioritizes low-income ~$24,980/year
Asset Limits Not assessed; need-based.
NC

Family can be aides; varies by county funding.

Benefits
Personal care (5-20 hours/week) Meal prep Respite (~5 days/year) Errands

Medicare Savings Program (MSP)

North Carolina Medicare Savings Program

Age 65+ or disabled
General NC resident, Medicare Part A/B.
Income Limits (2025) ~$2,510/month (QMB), ~$3,380/month (SLMB), ~$3,598/month (QI)—individual.
Asset Limits $9,430 (individual), $14,130 (couple).
NC

Three tiers; no waitlist; includes Extra Help for Part D.

Benefits
Covers Part B premiums ($174.70/month) Deductibles ($240/year) Copays (~20%)

VA Aid and Attendance (A&A) and Housebound Benefits

North Carolina VA Aid and Attendance/Housebound

Age 65+ or disabled veteran/spouse
General NC resident, wartime service, need for ADL help (A&A) or homebound.
Income Limits (2025) Net income < ~$1,984/month (veteran with dependent, A&A); pension offsets income.
Asset Limits ~$155,356 net worth limit
NC

High veteran demand in rural/urban areas.

Benefits
Cash (~$1,433-$2,642/month veteran, ~$951-$1,318 spouse) for care costs (e.g., in-home, assisted living)

Urgent Repair Program (URP)

North Carolina Urgent Repair Program

Age 60+ prioritized
General NC resident, homeowner, low-income.
Income Limits (2025) ~$30,258/year 50% AMI, varies by county
Asset Limits Not strictly assessed; home value considered.
NC

Forgivable at $2,000/year; statewide via local partners.

Benefits
Repairs (~$8,000-$12,000 avg.) for safety (e.g., roofs, heating, accessibility)

State/County Special Assistance (SA)

North Carolina Special Assistance

Age 65+ (or disabled)
General NC resident, in licensed adult care home, low-income.
Income Limits (2025) ~$1,255/month (individual, 100% FPL); varies by facility rate.
Asset Limits $2,000 individual
NC

Covers assisted living; counties supplement state funds.

Benefits
Cash (~$1,200-$1,500/month) for room/board; Medicaid covers care services

Frequently Asked Questions about Signature HealthCARE of Chapel Hill

What neighborhood is Signature HealthCARE of Chapel Hill in?

Signature HealthCARE of Chapel Hill is in the East Franklin Street neighborhood.

Is Signature HealthCARE of Chapel Hill in a walkable area?

Signature HealthCARE of Chapel Hill has a walk score of 74. Very walkable. Most errands can be accomplished on foot, and many essentials are within a short walk.

What is the occupancy rate at Signature HealthCARE of Chapel Hill?

Signature HealthCARE of Chapel Hill's occupancy is 82.8%.

Are there photos of Signature HealthCARE of Chapel Hill?

Yes — there are 4 photos of Signature HealthCARE of Chapel Hill in the photo gallery on this page.

What is the address of Signature HealthCARE of Chapel Hill?

Signature HealthCARE of Chapel Hill is located at 1602 E Franklin St, Chapel Hill, NC 27514.

What is the phone number of Signature HealthCARE of Chapel Hill?

(919) 967-1418 will put you in contact with the team at Signature HealthCARE of Chapel Hill.

Is Signature HealthCARE of Chapel Hill Medicare or Medicaid certified?

Yes — Signature HealthCARE of Chapel Hill is a CMS-certified provider of Medicare and Medicaid.

Guides for Better Senior Living

Care Cost Calculator: See Prices in Your Area

Nursing Home Data Explorer

Don’t Wait Too Long: 7 Red Flag Signs Your Parent Needs Assisted Living Now

The True Cost of Assisted Living in 2025 – And How Families Are Paying For It

Understanding Senior Living Costs: Pricing Models, Discounts & Financial Assistance