Siloam Springs Nursing & Rehab
Nursing Home · Siloam Springs, AR
CMS overall rating Info The Overall CMS Rating is scored from 1 to 5 stars and combines results from health inspections, staffing levels, and quality measures. Health inspections carry the most weight. Staffing and quality scores can increase or decrease the final rating based on performance compared to state and national standards.

Siloam Springs Nursing & Rehab

Nursing Home · Siloam Springs, AR
CMS overall rating Info The Overall CMS Rating is scored from 1 to 5 stars and combines results from health inspections, staffing levels, and quality measures. Health inspections carry the most weight. Staffing and quality scores can increase or decrease the final rating based on performance compared to state and national standards.
Calculator: See prices in your area
Siloam Springs Nursing & Rehab accepts Medicare, Medicaid, and private pay.

Overview of Siloam Springs Nursing & Rehab

Siloam Springs is a haven for those seeking a caring and family-like approach to recovery. The nursing home in Arkansas consists of professional staff committed to providing seniors with a safe and comfortable environment. With an emphasis on post-acute and long-term skilled nursing care, seniors can expect world-class hospitality and exceptional care from the compassionate staff.
Siloam Springs boasts top-notch leadership that boosts morale, creating a warm and joyful environment. Its areas of specialization include post-hospital rehabilitation, therapy (speech, occupational, physical), blood transfusions, bariatric services, IV care, post-stroke rehabilitation, diabetes management, cardiac care, hospice and palliative, tracheostomy care, pressure ulcer healing, and advanced wound care.

(479) 524-3128

Quality ratings

Measured by Centers for Medicare & Medicaid Services (CMS)

Overall rating Info The Overall CMS Rating combines results from health inspections, staffing levels and quality measures. Health inspections carry the most weight. Staffing and quality scores can increase or decrease the final rating based on performance compared to state and national standards.
▼ 36.5% Below AR avg. ▼ 36.5% Below AR avg.Click the badge to see the full State ranking.Click here to see the full State ranking.
Health Inspection Info Based on the results of the facility's three most recent standard inspections and any complaint investigations. CMS reviews the number, scope, and severity of deficiencies, with more recent findings weighted more heavily.
▼ 30.6% Below AR avg. ▼ 30.6% Below AR avg.Click the badge to see the full State ranking.Click here to see the full State ranking.
Staffing Info Measures average nursing staff hours per resident per day, including Registered Nurses (RNs) and total nursing staff. Ratings are adjusted based on the level of care residents require and are compared to state and national benchmarks.
▼ 7.7% Below AR avg. ▼ 7.7% Below AR avg.Click the badge to see the full State ranking.Click here to see the full State ranking.
Quality Measures Info Based on clinical and physical health indicators reported to CMS, such as hospital readmissions, falls, pressure ulcers, and improvements in mobility. These measures reflect how well residents' health needs are being managed.
▼ 18.9% Below AR avg. ▼ 18.9% Below AR avg.Click the badge to see the full State ranking.Click here to see the full State ranking.

Staffing hours breakdown

Info Daily nursing hours per resident by staff type, reported to CMS. Higher is generally better — compare this facility to state and national averages to see where staffing stands.

Hours per resident per day — compared to Arkansas state averages

Total nursing care / resident Info This home is ranked 75th out of 166 homes in Arkansas. Total adjusted nursing hours per resident per day, combining RN, LPN, and aide time. CMS adjusts this for case-mix so facilities can be fairly compared.
4h 39m per day
Rank #75 / 166Nurse hours — State benchmarkedThis home is ranked 75th out of 166 homes in Arkansas. Shows adjusted nurse hours per resident per day benchmarked to the Arkansas average, with a ranking across 166 Arkansas SNFs. More hours mean more direct care. The national average is about 3.5 hrs; below 3.0 is a red flag.Click the rank badge to see the full State ranking.Click here to see the full State ranking.
This facility Arkansas avg (4h 45m per day)
vs Arkansas avg
-2%

2 of 6 metrics below state avg

Standout metric Physical Therapist is +150% above state avg
Staff typeHours / Day / Residentvs state avg
Registered Nurse (RN) Info RNs hold the highest nursing license and can assess residents, interpret test results, and direct care plans. More RN hours per day often signals stronger clinical oversight and faster response to health changes. 17m per day ▼ 29% State avg: 24m per day · National avg: 41m per day
LPN / LVN Info Licensed Practical Nurses (LPNs) or Licensed Vocational Nurses (LVNs) deliver routine hands-on care — medication administration, wound dressing, and monitoring vital signs. They work under RN supervision and make up a large share of daily bedside care. 1h 2m per day ▲ 9% State avg: 57m per day · National avg: 52m per day
Nurse Aide Info Certified Nurse Aides (CNAs) provide the most direct day-to-day assistance: bathing, dressing, feeding, and mobility. Nurse aide hours are typically the largest staffing category and directly affect residents' quality of life. 2h 49m per day ▲ 3% State avg: 2h 44m per day · National avg: 2h 21m per day
Total Nursing (Weekend) Info Combined nursing hours (RN + LPN + Nurse Aide) per resident per day on weekends. Staffing often drops on weekends — this figure reveals whether the facility maintains adequate coverage outside of weekday hours. 3h 40m per day ▲ 5% State avg: 3h 29m per day · National avg: 3h 26m per day
Physical Therapist Info Hours per resident per day provided by licensed Physical Therapists (PTs) or PT Assistants. PT services help residents recover mobility after injury or illness and are especially important for post-acute (short-stay) rehabilitation. 5m per day ▲ 150% State avg: 2m per day · National avg: 4m per day
RN (Weekend) Info Registered nurse hours specifically on weekends. Facilities sometimes reduce RN presence on Saturdays and Sundays — a low weekend RN figure compared to weekday hours can indicate reduced clinical oversight when most administrative staff are absent. 10m per day ▼ 37% State avg: 16m per day · National avg: 29m per day

Types of Care at Siloam Springs Nursing & Rehab

Nursing Home

Capacity and availability

This home usually has availability

Occupancy lower than 85% suggests more openings may be available.

Lower occupancy than the Arkansas average: 71.3%
Occupancy rate 66.4% Rank #96 / 167Occupancy rate — State benchmarkedThis home is ranked 96th out of 167 homes in Arkansas. Shows this facility's occupancy rate versus the Arkansas average, with its Statewide rank out of 167. Higher occupancy signals strong local demand and financial stability.Click the rank badge to see the full State ranking.Click here to see the full State ranking.
Avg. Length of Stay 225 days
Occupancy rate
66.4% Rank #96 / 167Occupancy rate — State benchmarkedThis home is ranked 96th out of 167 homes in Arkansas. Shows this facility's occupancy rate versus the Arkansas average, with its Statewide rank out of 167. Higher occupancy signals strong local demand and financial stability.Click the rank badge to see the full State ranking.Click here to see the full State ranking.
Avg. Length of Stay
225 days
Walk Score
Walk Score: 39 / 100 Rank #80 / 164Walk Score — State benchmarkedThis home is ranked 80th out of 164 homes in Arkansas. Shows how walkable this facility's neighborhood is compared to the average Walk Score across Arkansas SNFs. Higher scores benefit residents, families, and staff.Click the rank badge to see the full State ranking.Click here to see the full State ranking.
Somewhat walkable. A few nearby services may be reachable on foot, but most trips require transportation.
BBB Rating
BBB Rating: A+ (Not Accredited)
An independent rating from the Better Business Bureau based on factors such as complaint history, transparency, and business practices.
How BBB ratings work

License Details

CMS Certification Number45356

Contact Siloam Springs Nursing & Rehab

Inspection History

In Arkansas, the Department of Human Services, Office of Long Term Care is authorized to conduct unannounced inspections and issue official quality of care reports for all senior living providers.

Since 2022 · 4 years of data 36 deficiencies

Inspection Scorecard Info This scorecard compares key inspection, citation, and complaint metrics at this facility against the Arkansas state average. Metrics rated ≥15% worse than average are highlighted in red; those ≥15% better are highlighted in green.

Since 2022 vs. Arkansas state average
Overall vs. AR average 2 Worse Metrics worse than Arkansas average:
• Total deficiencies (71% above)
• Deficiencies per year (70% above)
0 Better No metrics in this bucket.
Latest Inspection January 17, 2025 Routine

Deficiencies Info Deficiencies are formal regulatory issues recorded during state inspections.

This FacilityAR Averagevs. AR Avg
Total deficiencies Info Formal regulatory issues recorded by inspectors across all inspection types. 3621 This facility has 71% more total deficiencies than a typical Arkansas nursing home (36 vs. AR avg 21).↑ 71% worse
Deficiencies per year Info Average deficiencies per year since 2022. 95.3 This facility has 70% more deficiencies per year than a typical Arkansas nursing home (9 vs. AR avg 5.3).↑ 70% worse

Inspection Reports Summary Info An editor-reviewed summary of the themes and findings across this facility's recent inspection reports.

This facility’s inspection record is mixed, showing repeated deficiencies in resident care, medication management, infection control, and food safety across multiple inspections. The January 17, 2025 routine inspection found six deficiencies including inaccurate MDS assessments, delayed physician order changes, inadequate fall prevention, and poor grease trap maintenance. Earlier inspections cited seven deficiencies in December 2023 related to medication and infection control, plus ongoing issues with personal hygiene and environmental safety dating back to 2022.

Read the full inspection reports for this facility, including detailed findings and corrective actions.

Show Inspection Reports

Health Inspection History

Inspections Since 2022
Total health inspections 5

Arkansas average 4.2


Last Health inspection on Jan 2025
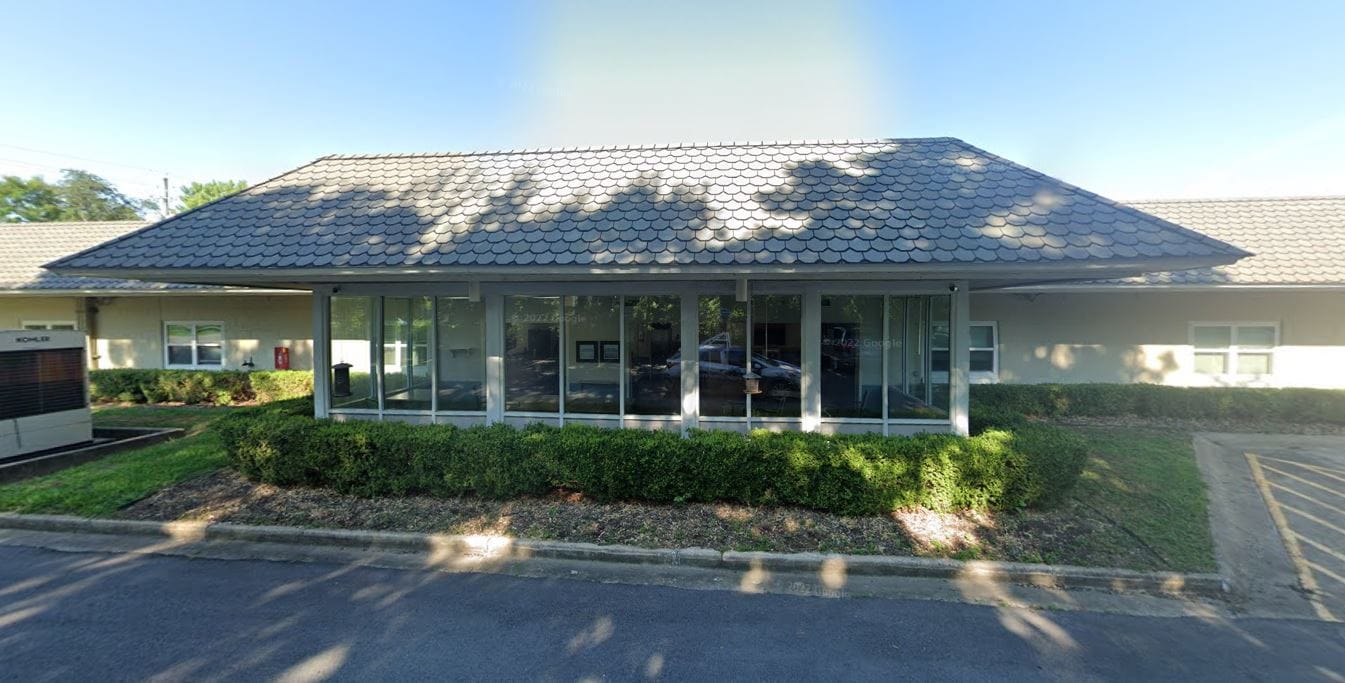
Total health citations
36 Rank #158 / 171Health citations — State benchmarkedThis home is ranked 158th out of 171 homes in Arkansas. Shows this facility's total health deficiency citations benchmarked to the Arkansas State average, with a ranking across all 171 AR SNFs. Lower citation counts earn a better rank.Click the rank badge to see the full State ranking.Click here to see the full State ranking.

Arkansas average 21.8

Citations per inspection
7.2 Rank #146 / 171Citations per inspection — State benchmarkedThis home is ranked 146th out of 171 homes in Arkansas. Shows average deficiency citations per CMS inspection for this facility versus the Arkansas mean across 171 SNFs with citation data. Lower is better.Click the rank badge to see the full State ranking.Click here to see the full State ranking.

Arkansas average 5.32


Health citations are formal notices following inspections when they fail to comply with safety and care standards.

34 of 36 citations resulted from standard inspections; and 2 of 36 resulted from complaint investigations.

Breakdown of citation severity (last 4 years)
Critical Health citations
1
150% worse than Arkansas average

Arkansas average: 0.4


Serious Health citations
0
100% better than Arkansas average

Arkansas average: 0.2

1 critical citation Arkansas average: 0.4

0 serious citations Arkansas average: 0.2

33 moderate citations Arkansas average: 20.9

2 minor citations Arkansas average: 0.4
Citations history (last 4 years)
Administration moderate citation Jan 17, 2025
Corrected

Nursing Services moderate citation Jan 17, 2025
Corrected

Nutrition moderate citation Jan 17, 2025
Corrected

Quality of Care moderate citation Jan 17, 2025
Corrected

Staffing Data

Reporting period: April 1 – June 30, 2025 (Q2 2025). Source: CMS Payroll-Based Journal report.

Total staff 122
Employees 111
Contractors 11
Staff to resident ratio 1.47:1
9% worse than Arkansas average
Arkansas average ratio: 1.61:1 Arkansas average ratio: 1.61:1See full Arkansas ranking
Avg staff/day 44
Average shift 8.4 hours
5% better than Arkansas average
Arkansas average: 8 hours Arkansas average shift: 8 hoursSee full Arkansas ranking
Total staff hours (quarter) 33,466

Nursing staff breakdown

Q2 2025 · Apr 1 – Jun 30 More info This data comes from the CMS Payroll-Based Journal report covering April 1 – June 30, 2025.
Registered Nurse

Manages medical care and health needs.

Total count 0
Average shift length Info Average shift length. Calculated as total hours divided by days worked and average staff per day.

No contractors work on this role.

Licensed Practical Nurse

Assists with medical care and medications.

Total count 26
Average shift length Info Average shift length. Calculated as total hours divided by days worked and average staff per day. 9.4 hours

No contractors work on this role.

Certified Nursing Assistant

Helps with daily care and mobility.

Total count 66
Average shift length Info Average shift length. Calculated as total hours divided by days worked and average staff per day. 8.2 hours

No contractors work on this role.

Contractor staffing

Q2 2025 · Apr 1 – Jun 30 More info This data comes from the CMS Payroll-Based Journal report covering April 1 – June 30, 2025.

Total hours from contractors

1.4%

481 contractor hours this quarter

Qualified Social Worker: 2 Respiratory Therapy Technician: 2 Physical Therapy Assistant: 2 Physical Therapy Aide: 1 Speech Language Pathologist: 1 Medical Director: 1 Occupational Therapy Aide: 1 Occupational Therapy Assistant: 1

Staff by category

Q2 2025 · Apr 1 – Jun 30 More info This data comes from the CMS Payroll-Based Journal report covering April 1 – June 30, 2025.
Certified Nursing Assistant6606619,93391100%8.2
Licensed Practical Nurse260267,97991100%9.4
Clinical Nurse Specialist3031,5019099%9.9
RN Director of Nursing2026947582%7
Dietitian1015656875%8.3
Administrator2025046369%8
Nurse Practitioner1014725965%8
Mental Health Service Worker1014645864%8
Respiratory Therapy Technician3254485965%5.3
Qualified Social Worker2242014145%4.9
Respiratory Therapist1011993134%6.4
Speech Language Pathologist0111762224%8
Physical Therapy Aide0111282022%6.4
Physical Therapy Assistant2241014448%2.1
Nurse Aide in Training1013867%6.4
Occupational Therapy Assistant01128910%3.1
Occupational Therapy Aide011251112%2.3
Medical Director0111078%1.4
66 Certified Nursing Assistant
% of Days 100%
26 Licensed Practical Nurse
% of Days 100%
3 Clinical Nurse Specialist
% of Days 99%
2 RN Director of Nursing
% of Days 82%
1 Dietitian
% of Days 75%
2 Administrator
% of Days 69%
1 Nurse Practitioner
% of Days 65%
1 Mental Health Service Worker
% of Days 64%
5 Respiratory Therapy Technician
% of Days 65%
4 Qualified Social Worker
% of Days 45%
1 Respiratory Therapist
% of Days 34%
1 Speech Language Pathologist
% of Days 24%
1 Physical Therapy Aide
% of Days 22%
4 Physical Therapy Assistant
% of Days 48%
1 Nurse Aide in Training
% of Days 7%
1 Occupational Therapy Assistant
% of Days 10%
1 Occupational Therapy Aide
% of Days 12%
1 Medical Director
% of Days 8%

Penalties and fines

Federal penalties imposed by CMS for regulatory violations, including civil money penalties (fines) and denials of payment for new Medicare/Medicaid admissions.

Source: CMS Penalties Database

No penalties in the past 3 years

No civil money penalties or payment denials were reported in the last 3 years.

Quality of care over time

These measures show how residents usually do over time at this home, based on health outcomes and preventive care.

High-risk clinical events score Info A composite score based on pressure ulcers, falls with injury, weight loss, walking ability decline, and activities of daily living decline. 7.5
In line with Arkansas average

Arkansas average: 7.7

Functional decline score Info A composite score based on activities of daily living decline, walking ability decline, and incontinence. 15.6
17% worse than Arkansas average

Arkansas average: 13.3

Long-stay resident measures
Significantly above average Arkansas avg: 4.2 Info CMS star rating based on long-stay quality measure performance. 5 stars = significantly above average, 1 star = significantly below average.
Need for Help with Daily Activities Increased Info Percent of long-stay residents whose need for help with daily activities has increased 13.8%
20% worse than Arkansas average

Arkansas average: 11.5%

Walking Ability Worsened Info Percent of long-stay residents whose ability to move independently worsened 12.8%
5% better than Arkansas average

Arkansas average: 13.4%

Low Risk Residents with Bowel/Bladder Incontinence Info Percent of low risk long-stay residents who lose control of their bowels or bladder 20.3%
34% worse than Arkansas average

Arkansas average: 15.1%

Falls with Major Injury Info Percent of long-stay residents experiencing one or more falls with major injury 0.7%
83% better than Arkansas average

Arkansas average: 3.9%

High Risk Residents with Pressure Ulcers Info Percent of long-stay high risk residents with pressure ulcers 4.2%
12% better than Arkansas average

Arkansas average: 4.7%

Urinary Tract Infection Info Percent of long-stay residents with a urinary tract infection 0.7%
46% better than Arkansas average

Arkansas average: 1.3%

Lost Too Much Weight Info Percent of long-stay residents who lose too much weight 6.3%
27% worse than Arkansas average

Arkansas average: 5.0%

Depressive Symptoms Info Percent of long-stay residents who have depressive symptoms 1.1%
30% better than Arkansas average

Arkansas average: 1.5%

Antipsychotic Use Info Percent of long-stay residents who received an antipsychotic medication 14.8%
41% worse than Arkansas average

Arkansas average: 10.5%

Pneumococcal Vaccine Info Percent of long-stay residents assessed and appropriately given the pneumococcal vaccine 99.3%
5% better than Arkansas average

Arkansas average: 94.4%

Influenza Vaccine Info Percent of long-stay residents assessed and appropriately given the seasonal influenza vaccine 95.3%
In line with Arkansas average

Arkansas average: 96.2%

Hospitalizations per 1,000 days Info Number of hospitalizations per 1,000 long-stay resident days. 3.26
65% worse than Arkansas average

Arkansas average: 1.97

ED visits per 1,000 days Info Number of outpatient emergency department visits per 1,000 long-stay resident days. 0.89
59% better than Arkansas average

Arkansas average: 2.18

Short-stay resident measures
Above average Arkansas avg: 2.7 Info CMS star rating based on short-stay quality measure performance. 5 stars = much above average, 1 star = much below average.
Pneumococcal Vaccine Info Percent of short-stay residents assessed and appropriately given the pneumococcal vaccine 93.4%
15% better than Arkansas average

Arkansas average: 80.9%

Antipsychotic medication increase Info Percent of short-stay residents who newly received an antipsychotic medication 1.0%
36% better than Arkansas average

Arkansas average: 1.5%

Influenza Vaccine Info Percent of short-stay residents assessed and appropriately given the seasonal influenza vaccine 75.3%
In line with Arkansas average

Arkansas average: 77.7%

Re-hospitalized after SNF stay Info Percentage of short-stay residents who were re-hospitalized after their nursing home admission. 18.3%
27% better than Arkansas average

Arkansas average: 25.2%

Emergency department visits Info Percentage of short-stay residents who had an outpatient emergency department visit. 6.6%
52% better than Arkansas average

Arkansas average: 13.8%

Falls with major injury Info Percentage of SNF residents who experience falls with major injury during their stay. 0.0%
100% better than Arkansas average

Arkansas average: 0.8%

Ability to care for self at discharge Info Percentage of residents at or above expected ability to care for themselves at discharge. 50.0%
7% worse than Arkansas average

Arkansas average: 53.7%

Successful return to home or community Info Rate of successful return to home or community from a skilled nursing facility. 26.0%
49% worse than Arkansas average

Arkansas average: 50.6%

Breakdown by payment type

Medicare

38% of new residents, usually for short-term rehab.

Typical stay 1 - 2 months

Private pay

19% of new residents, often for short stays.

Typical stay 6 - 7 months

Medicaid

43% of new residents, often for long-term daily care.

Typical stay 9 - 10 months

Facility Characteristics

Source: CMS Long-Term Care Facility Characteristics (Data as of Jan 2026)

Total residents 83
Medicare
5
6% of residents
Medicaid
62
74.7% of residents
Private pay or other
16
19.3% of residents
Programs & Services
Residents Group

Residents meet regularly to discuss policies, care quality, and activities

Active Resident Council

Organized group of residents that meets regularly to discuss facility policies, quality of life, and activities.

Finances and operations

Privately-owned community
Operated by a business corporation.
Home revenue
$9.9M
Operating loss
-$94.7K
Privately-owned community Operated by a business corporation.
Home revenue
$9.9M Rank #70 / 166Revenue — State benchmarkedThis home is ranked 70th out of 166 homes in Arkansas. Shows this facility's annual revenue compared to the Arkansas SNF average. Higher revenue generally means more resources for staffing and capital — read alongside Payroll %.Click the rank badge to see the full State ranking.Click here to see the full State ranking.
Operating loss
-$94.7K
Payroll costs Info The portion of the home's budget spent on staff, including nurses, caregivers, and other employees who support care and operations. Rank #59 / 166Payroll — State benchmarkedThis home is ranked 59th out of 166 homes in Arkansas. Shows total annual staff payroll benchmarked to the Arkansas average. Higher payroll investment relative to peers often signals better staffing and less reliance on cheaper contract labor.Click the rank badge to see the full State ranking.Click here to see the full State ranking.
$4.8M
48.4% of revenue Rank #52 / 166Payroll % — State benchmarkedThis home is ranked 52nd out of 166 homes in Arkansas. Shows payroll as a percentage of revenue versus the Arkansas average. Well-run Arkansas SNFs typically land around 47–60% — the top third Statewide. Below 25% may signal understaffing or heavy agency use — read with Staffing ratings.Click the rank badge to see the full State ranking.Click here to see the full State ranking.
Other operating costs Info All remaining costs needed to run the home, such as food, utilities, building maintenance, supplies and administrative expenses.
$5.2M
Total costs $10.0M

Who this home usually serves

TYPE OF STAY

Mostly long-term care residents

Most residents stay for extended periods and receive ongoing daily care.

Places of interest near Siloam Springs Nursing & Rehab

Address 0.7 miles from city center Info Estimated distance in miles from Siloam Springs's city center to Siloam Springs Nursing & Rehab's address, calculated via Google Maps. — 1.23 miles to nearest hospital (Physician's Wellness & Weight Loss Center)

Calculate Travel Distance to Siloam Springs Nursing & Rehab

Add your location

Address

Financial Assistance for
Nursing Home in Arkansas

Siloam Springs Nursing & Rehab is located in Siloam Springs, Arkansas.
Here are the financial assistance programs available to residents in Arkansas.

Get Financial aid guidance

ARChoices

Arkansas Medicaid ARChoices

Age 65+ or 21+ with disability
General Arkansas resident, Medicaid- eligible, nursing home-level care need.
Income Limits (2025) ~$2,829/month 300% FBR, individual
Asset Limits $2,000 (individual), $3,000 (couple).
AR

Rural focus; possible waitlists.

Benefits
Personal care (5-7 hours/day) Meals ($7/meal) Respite care (240 hours/year) Adult day services ($60/day)

Choices in Living Resource Center

Arkansas Choices in Living

Age 60+
General Arkansas resident.
Income Limits No strict limit; prioritizes low-income.
Asset Limits Not applicable.
AR

Limited direct funding; mostly referral-based.

Benefits
Care coordination Limited respite (up to 5 days/year) Transportation assistance (~5 trips/month)

Living Choices Assisted Living Waiver

Arkansas Medicaid Living Choices Assisted Living Waiver

Age 65+
General Arkansas resident, requires nursing home-level care, lives in a Level II assisted living facility.
Income Limits (2025) ~$2,829/month 300% FBR, individual
Asset Limits $2,000 (individual), $3,000 (couple); spousal rules apply.
AR

Limited provider network; excludes Level I facilities (no nursing services).

Benefits
Personal care (~5 hours/day) Medication management Nursing Activities Transportation

Program of All-Inclusive Care for the Elderly (PACE)

Arkansas Medicaid PACE

Age 55+
General Arkansas resident, nursing home-level care, safe with PACE support.
Income Limits (2025) ~$2,829/month 300% FBR
Asset Limits $2,000 (individual), $3,000 (couple).
AR

Limited geographic availability.

Benefits
Primary/preventive care Personal care (5-7 hours/day) Meals Transportation Therapy

Arkansas State Plan Personal Care

Arkansas Medicaid Personal Care Program

Age
General Any age, Arkansas resident, needs ADL/IADL help, Medicaid-eligible.
Income Limits (2025) ~$1,004/month individual
Asset Limits $9,660 (individual), $14,470 (couple).
AR

No nursing home-level care requirement.

Benefits
Personal care (~4-6 hours/day) Homemaker services (e.g., meal prep)

Frequently Asked Questions about Siloam Springs Nursing & Rehab

What neighborhood is Siloam Springs Nursing & Rehab in?

Siloam Springs Nursing & Rehab is in the Hico neighborhood of Siloam Springs.

Is Siloam Springs Nursing & Rehab in a walkable area?

Siloam Springs Nursing & Rehab has a walk score of 39. Somewhat walkable. A few nearby services may be reachable on foot, but most trips require transportation.

What is the phone number of Siloam Springs Nursing & Rehab?

(479) 524-3128 will put you in contact with the team at Siloam Springs Nursing & Rehab.

Is Siloam Springs Nursing & Rehab Medicare or Medicaid certified?

Yes — Siloam Springs Nursing & Rehab is a CMS-certified provider of Medicare and Medicaid.

Guides for Better Senior Living

Care Cost Calculator: See Prices in Your Area

Nursing Home Data Explorer

Don’t Wait Too Long: 7 Red Flag Signs Your Parent Needs Assisted Living Now

The True Cost of Assisted Living in 2025 – And How Families Are Paying For It

Understanding Senior Living Costs: Pricing Models, Discounts & Financial Assistance

Explore Open Rooms
1 Contact details
2 What type of senior care service are you looking for?
3 What budget do you have in mind for senior care?
4 How soon do you need to find care?
5 Additional details

Thank you for your interest!

Our team will be in touch shortly to help with next steps.