Sodalis Lake Jackson
Nursing Home, Assisted Living, Independent Living, Memory Care & Respite Care · Texas, TX
CMS overall rating Info CMS (the Centers for Medicare & Medicaid Services) is the federal agency that rates nursing home quality. Its Overall Rating runs from 1 to 5 stars, combining health inspections, staffing, and quality measures, with inspections weighted most heavily.

Sodalis Lake Jackson

Nursing Home, Assisted Living, Independent Living, Memory Care & Respite Care · Texas, TX
CMS overall rating Info CMS (the Centers for Medicare & Medicaid Services) is the federal agency that rates nursing home quality. Its Overall Rating runs from 1 to 5 stars, combining health inspections, staffing, and quality measures, with inspections weighted most heavily.
Calculator: See prices in your area
Sodalis Lake Jackson accepts Medicare, Medicaid, and private pay.

Overview of Sodalis Lake Jackson

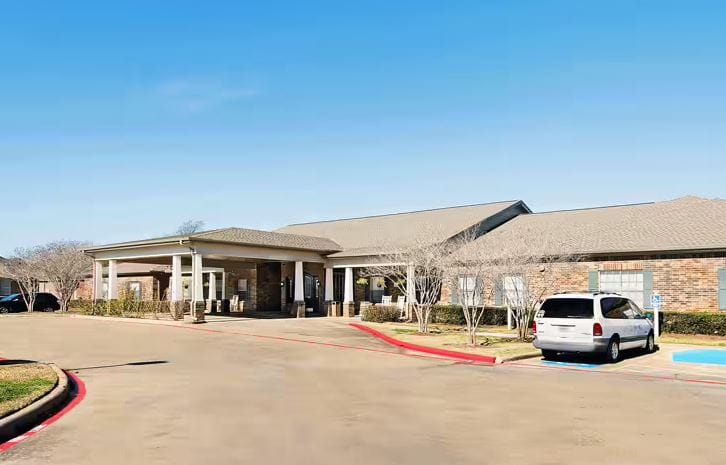
Enchanting seniors with its warm and welcoming environment, Sodalis Lake Jackson is a distinguished senior living community set in the quiet lands of Oak Drive South, Lake Jackson, TX, that offers assisted living, independent living, memory care, and respite care. With cozy and elegant residences ranging from studio to two-bedroom floor plans, seniors live in comfort and style. Boasting a compassionate and highly skilled team, the community delivers top-tier care and support for seniors to thrive and live their best lives.

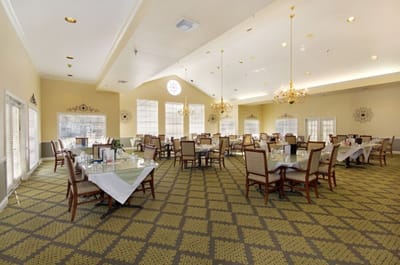
Mingle with friends and enjoy every moment of your best years through engaging activities and enjoyable programs. Have a delightful dining experience with delicious and healthy meals served three times a day to meet residents’ dietary needs and preferences. Sodalis Lake Jackson is great for seniors who want to live their golden years surrounded by beautiful spaces and a friendly community.

(979) 475-7223

Quality ratings

Measured by Centers for Medicare & Medicaid Services (CMS)

Overall rating Info The Overall CMS Rating combines results from health inspections, staffing levels and quality measures. Health inspections carry the most weight. Staffing and quality scores can increase or decrease the final rating based on performance compared to state and national standards.
▲ 78.9% Above TX avg. ▲ 78.9% Above TX avg.TX average: 2.8Click the badge to see the full State ranking.Click here to see the full State ranking.
Health Inspection Info Based on the results of the facility's three most recent standard inspections and any complaint investigations. CMS reviews the number, scope, and severity of deficiencies, with more recent findings weighted more heavily.
▲ 80.9% Above TX avg. ▲ 80.9% Above TX avg.TX average: 2.8Click the badge to see the full State ranking.Click here to see the full State ranking.
Staffing Info Measures average nursing staff hours per resident per day, including Registered Nurses (RNs) and total nursing staff. Ratings are adjusted based on the level of care residents require and are compared to state and national benchmarks.
▼ 5.7% Below TX avg. ▼ 5.7% Below TX avg.TX average: 2.1Click the badge to see the full State ranking.Click here to see the full State ranking.
Quality Measures Info Based on clinical and physical health indicators reported to CMS, such as hospital readmissions, falls, pressure ulcers, and improvements in mobility. These measures reflect how well residents' health needs are being managed.
▼ 20.1% Below TX avg. ▼ 20.1% Below TX avg.TX average: 3.8Click the badge to see the full State ranking.Click here to see the full State ranking.

Staffing hours breakdown

Info Daily nursing hours per resident by staff type, reported to CMS. Higher is generally better — compare this facility to state and national averages to see where staffing stands.

Hours per resident per day — compared to Texas state averages

Total nursing care / resident Info This home is ranked 146th out of 296 homes in Texas for nurse hours. Total adjusted nursing hours per resident per day, combining RN, LPN, and aide time. CMS adjusts this for case-mix so facilities can be fairly compared.
3h 27m per day
Rank #146 / 296Nurse hours — State benchmarkedThis home is ranked 146th out of 296 homes in Texas. Shows adjusted nurse hours per resident per day benchmarked to the Texas average, with a ranking across 296 Texas facilities. More hours mean more direct care. The national average is about 3.5 hrs; below 3.0 is a red flag.Ranking totals vary by category as each rank only includes facilities that report data for that metric. Homes missing that data point aren't included in the ranking.Click the rank badge to see the full State ranking.Click here to see the full State ranking.
This facility Texas avg (3h 38m per day)
vs Texas avg
-5%

3 of 6 metrics below state avg

Staff typeHours / Day / Residentvs state avg
Registered Nurse (RN) Info RNs hold the highest nursing license and can assess residents, interpret test results, and direct care plans. More RN hours per day often signals stronger clinical oversight and faster response to health changes. 26m per day ■ Avg State avg: 25m per day · National avg: 41m per day
LPN / LVN Info Licensed Practical Nurses (LPNs) or Licensed Vocational Nurses (LVNs) deliver routine hands-on care — medication administration, wound dressing, and monitoring vital signs. They work under RN supervision and make up a large share of daily bedside care. 46m per day ▼ 20% State avg: 57m per day · National avg: 52m per day
Nurse Aide Info Certified Nurse Aides (CNAs) provide the most direct day-to-day assistance: bathing, dressing, feeding, and mobility. Nurse aide hours are typically the largest staffing category and directly affect residents' quality of life. 2h 0m per day ■ Avg State avg: 2h 1m per day · National avg: 2h 20m per day
Weekend Total Nursing Info Combined nursing hours (RN + LPN + Nurse Aide) per resident per day on weekends. Staffing often drops on weekends — this figure reveals whether the facility maintains adequate coverage outside of weekday hours. 2h 54m per day ▼ 4% State avg: 3h 0m per day · National avg: 3h 27m per day
Physical Therapist Info Hours per resident per day provided by licensed Physical Therapists (PTs) or PT Assistants. PT services help residents recover mobility after injury or illness and are especially important for post-acute (short-stay) rehabilitation. 1m per day ▼ 69% State avg: 4m per day · National avg: 4m per day
Weekend RN Info Registered nurse hours specifically on weekends. Facilities sometimes reduce RN presence on Saturdays and Sundays — a low weekend RN figure compared to weekday hours can indicate reduced clinical oversight when most administrative staff are absent. 20m per day ■ Avg State avg: 20m per day · National avg: 29m per day

Capacity and availability

Avg. Length of Stay
74 days
Bed community size
108-bed community Rank #321 / 988Bed count — State benchmarkedThis home is ranked 321st out of 988 homes in Texas. Shows this facility's certified or reported bed count compared to other Texas facilities. Larger communities may offer more amenities, programs, and on-site services for residents and families.Ranking totals vary by category as each rank only includes facilities that report data for that metric. Homes missing that data point aren't included in the ranking.Click the rank badge to see the full State ranking.Click here to see the full State ranking.
A larger shared setting that may offer more common spaces and organized community services.
Walk Score
Walk Score: 28 / 100 Rank #956 / 1391Walk Score — State benchmarkedThis home is ranked 956th out of 1391 homes in Texas. Shows how walkable this facility's neighborhood is compared to the average Walk Score across Texas facilities. Higher scores benefit residents, families, and staff.Ranking totals vary by category as each rank only includes facilities that report data for that metric. Homes missing that data point aren't included in the ranking.Click the rank badge to see the full State ranking.Click here to see the full State ranking.
Somewhat walkable. A few nearby services may be reachable on foot, but most trips require transportation.

About this community

Occupancy

Occupancy rate
58%
Rank #211 / 304Occupancy rate — State benchmarkedThis home is ranked 211th out of 304 homes in Texas. Shows this facility's occupancy rate versus the Texas average, with its Statewide rank out of 304. Higher occupancy signals strong local demand and financial stability.Ranking totals vary by category as each rank only includes facilities that report data for that metric. Homes missing that data point aren't included in the ranking.Click the rank badge to see the full State ranking.Click here to see the full State ranking.
Lower than the Texas average: 63.5%
Occupied beds
63 / 108
Average occupied beds in Texas homes 75 beds

License Details

Facility TypeType B
StatusLicensed
ExpirationJanuary 3, 2026
CountyBrazoria
License Number148996

Ownership & Operating Entity

Sodalis Lake Jackson is legally operated by Ec Opco Lake Jackson, Llc, and administrated by Tracy Soileau.

Management CompanyTRILOGY SENIOR LIVING MANAGEMENT, LLC
OwnerEC OPCO LAKE JACKSON, LLC
Ownership TypeLimited Liability Company (LLC)

Staffing

Key information about the people who lead and staff this community.

Leadership

Administrator Email[email protected]

Memory & Specialized Care

1 service
No Alzheimer's certification

Contact Sodalis Lake Jackson

Inspection History

In Texas, the Health and Human Services Commission (HHSC) is the primary regulatory body that conducts unannounced inspections and publishes quality reports for all long-term care homes.

Since 2023 · 3 years of data 8 citations 2 inspections

Inspection Scorecard Info This scorecard compares key inspection, citation, and complaint metrics at this facility against the Texas state average. Metrics rated ≥15% worse than average are highlighted in red; those ≥15% better are highlighted in green.

Since 2023 vs. Texas state average
Overall vs. TX average 3 Worse Metrics worse than Texas average:
• Total citations (33% above)
• Citations per year (35% above)
• Inspections with citations (100% above)
2 At Avg Metrics at Texas average:
• Health citations (at TX avg)
• Life safety citations (at TX avg)
0 Better No metrics in this bucket.
Latest Inspection June 20, 2023 Other An inspection that falls outside standard annual surveys and formal complaint investigations. May include administrative compliance checks, documentation reviews, focused surveys on specific concerns, or revisit surveys to verify prior corrections.

Citations Info Citations are formal regulatory issues recorded during state inspections.

This FacilityTX Averagevs. TX Avg
Total citations Info Formal regulatory issues recorded by inspectors across all inspection types. 86 This facility has 33% more total citations than a typical Texas nursing home (8 vs. TX avg 6).↑ 33% worse
Health citations Info Violations related to resident care, clinical practices, and day-to-day operations. 22 This facility has health citations in line with the Texas average (2 vs. TX avg 2).— At avg
Life safety citations Info Violations related to building safety — fire prevention, emergency egress, and similar. 66 This facility has life safety citations in line with the Texas average (6 vs. TX avg 6).— At avg
Citations per year Info Average citations per year since 2023. 2.72 This facility has 35% more citations per year than a typical Texas nursing home (2.7 vs. TX avg 2).↑ 35% worse

Inspections Info State inspections evaluate whether the facility meets health and safety standards.

This FacilityTX Averagevs. TX Avg
Inspections with citations Info Inspections that resulted in at least one regulatory citation. 21 This facility has 100% more inspections with citations than a typical Texas nursing home (2 vs. TX avg 1).↑ 100% worse

Inspection Reports Summary Info An editor-reviewed summary of the themes and findings across this facility's recent inspection reports.

  • June 20, 2023 inspection found 8 deficiencies including continuing education documentation and multiple life safety code violations related to sprinkler systems, bedroom doors, and window requirements.
  • The facility failed to comply with NFPA 101 and NFPA 25 standards for fire safety and sprinkler maintenance, indicating ongoing safety compliance issues.
  • All life safety code violations from a 2019 inspection were corrected before the 2023 survey, showing some prior deficiencies were resolved.

Health Inspection History

Inspections since 2023
Total health inspections 3

Texas average 7.4


Last Health inspection on Apr 2025

Total health citations
6 Rank #8 / 299Health citations — State benchmarkedThis home is ranked 8th out of 299 homes in Texas. Shows this facility's total health deficiency citations benchmarked to the Texas State average, with a ranking across all 299 TX facilities. Lower citation counts earn a better rank.Ranking totals vary by category as each rank only includes facilities that report data for that metric. Homes missing that data point aren't included in the ranking.Click the rank badge to see the full State ranking.Click here to see the full State ranking.

Texas average 25.9

Citations per inspection
2 Rank #24 / 299Citations per inspection — State benchmarkedThis home is ranked 24th out of 299 homes in Texas. Shows average deficiency citations per CMS inspection for this facility versus the Texas mean across 299 facilities with citation data. Lower is better.Ranking totals vary by category as each rank only includes facilities that report data for that metric. Homes missing that data point aren't included in the ranking.Click the rank badge to see the full State ranking.Click here to see the full State ranking.

Texas average 3.67


Health citations are formal notices following inspections when they fail to comply with safety and care standards.

All 6 citations resulted from standard inspections.

Breakdown of citation severity (last 3 years)
Critical health citations
0
100% better than Texas average

Texas average: 2


Serious health citations
0
100% better than Texas average

Texas average: 0.4

0 critical citations Texas average: 2

0 serious citations Texas average: 0.4

6 moderate citations Texas average: 23

0 minor citations Texas average: 0.4
Citations history (last 3 years)
Nutrition moderate citation Apr 30, 2025
Corrected

Care Planning moderate citation Apr 30, 2025
Corrected

Care Planning moderate citation Apr 30, 2025
Corrected

Care Planning moderate citation Mar 06, 2024
Corrected

Staffing Data

Reporting period: October 1 – December 31, 2025 (Q4 2025). Source: CMS Payroll-Based Journal report.

Total staff 81
Employees 66
Contractors 15
Staff to resident ratio 1.53 : 1
0% compared with Texas average
Texas average ratio: 1.48 : 1 Texas average ratio: 1.48 : 1See full Texas ranking
Avg staff/day 24
Average shift 9 hours
11% better than Texas average
Texas average: 8.1 hours Texas average shift: 8.1 hoursSee full Texas ranking
Total staff hours (quarter) 19,875

Nursing staff breakdown

Q4 2025 · Oct 1 – Dec 31 More info This data comes from the CMS Payroll-Based Journal report covering October 1 – December 31, 2025.
Registered Nurse

Manages medical care and health needs.

RN Staff Info All 9 RN Staff are full-time employees. No contractors work on this role. 9
Average shift length Info Average shift length. Calculated as total hours divided by days worked and average staff per day. 11.1 hours
Licensed Practical Nurse

Assists with medical care and medications.

LPN Staff Info All 14 LPN Staff are full-time employees. No contractors work on this role. 14
Average shift length Info Average shift length. Calculated as total hours divided by days worked and average staff per day. 9.3 hours
Certified Nursing Assistant

Helps with daily care and mobility.

CNA Staff Info All 31 CNA Staff are full-time employees. No contractors work on this role. 31
Average shift length Info Average shift length. Calculated as total hours divided by days worked and average staff per day. 10.3 hours

Contractor staffing

Q4 2025 · Oct 1 – Dec 31 More info This data comes from the CMS Payroll-Based Journal report covering October 1 – December 31, 2025.

Total hours from contractors

7%

1,393 contractor hours this quarter

Occupational Therapy Aide: 4 Speech Language Pathologist: 3 Respiratory Therapy Technician: 3 Physical Therapy Assistant: 2 Physical Therapy Aide: 2 Qualified Social Worker: 1

Staff by category

Q4 2025 · Oct 1 – Dec 31 More info This data comes from the CMS Payroll-Based Journal report covering October 1 – December 31, 2025.
Certified Nursing Assistant310318,52792100%10.3
Licensed Practical Nurse140143,53792100%9.3
Medication Aide/Technician5051,97892100%11.2
Registered Nurse9091,7849199%11.1
Speech Language Pathologist0339637076%7.6
Occupational Therapy Aide1455429199%5.6
Administrator10152092100%5.7
RN Director of Nursing1014745863%8.2
Nurse Practitioner1014626065%7.7
Dietitian1013865358%7.3
Mental Health Service Worker1012212729%8.2
Physical Therapy Aide0221883336%5.7
Respiratory Therapy Technician0331095560%2
Physical Therapy Assistant022825054%1.6
Other Dietary Services Staff101821516%5.4
Qualified Social Worker011221820%1.2
31 Certified Nursing Assistant
% of Days 100%
14 Licensed Practical Nurse
% of Days 100%
5 Medication Aide/Technician
% of Days 100%
9 Registered Nurse
% of Days 99%
3 Speech Language Pathologist
% of Days 76%
5 Occupational Therapy Aide
% of Days 99%
1 Administrator
% of Days 100%
1 RN Director of Nursing
% of Days 63%
1 Nurse Practitioner
% of Days 65%
1 Dietitian
% of Days 58%
1 Mental Health Service Worker
% of Days 29%
2 Physical Therapy Aide
% of Days 36%
3 Respiratory Therapy Technician
% of Days 60%
2 Physical Therapy Assistant
% of Days 54%
1 Other Dietary Services Staff
% of Days 16%
1 Qualified Social Worker
% of Days 20%

Penalties and fines

Federal penalties imposed by CMS for regulatory violations, including civil money penalties (fines) and denials of payment for new Medicare/Medicaid admissions.

Source: CMS Penalties Database

No penalties in the past 3 years

No civil money penalties or payment denials were reported in the last 3 years.

Quality of care over time

These measures show how residents usually do over time at this home, based on health outcomes and preventive care.

High-risk clinical events score Info A composite score based on pressure ulcers, falls with injury, weight loss, walking ability decline, and activities of daily living decline. 7.4
14% better than Texas average

Texas average: 8.6

Functional decline score Info A composite score based on activities of daily living decline, walking ability decline, and incontinence. 17.8
11% worse than Texas average

Texas average: 16.0

Long-stay resident measures
Need for Help with Daily Activities Increased Info Percent of long-stay residents whose need for help with daily activities has increased 7.9%
51% better than Texas average

Texas average: 16.2%

Walking Ability Worsened Info Percent of long-stay residents whose ability to move independently worsened 19.0%
17% worse than Texas average

Texas average: 16.2%

Low Risk Residents with Bowel/Bladder Incontinence Info Percent of low risk long-stay residents who lose control of their bowels or bladder 26.5%
69% worse than Texas average

Texas average: 15.7%

Falls with Major Injury Info Percent of long-stay residents experiencing one or more falls with major injury 1.8%
45% better than Texas average

Texas average: 3.2%

High Risk Residents with Pressure Ulcers Info Percent of long-stay high risk residents with pressure ulcers 1.4%
69% better than Texas average

Texas average: 4.4%

Urinary Tract Infection Info Percent of long-stay residents with a urinary tract infection 1.2%
51% worse than Texas average

Texas average: 0.8%

Lost Too Much Weight Info Percent of long-stay residents who lose too much weight 6.8%
95% worse than Texas average

Texas average: 3.5%

Depressive Symptoms Info Percent of long-stay residents who have depressive symptoms 9.0%
215% worse than Texas average

Texas average: 2.9%

Antipsychotic Use Info Percent of long-stay residents who received an antipsychotic medication 17.1%
117% worse than Texas average

Texas average: 7.9%

Pneumococcal Vaccine Info Percent of long-stay residents assessed and appropriately given the pneumococcal vaccine 100.0%
In line with Texas average

Texas average: 97.3%

Influenza Vaccine Info Percent of long-stay residents assessed and appropriately given the seasonal influenza vaccine 100.0%
In line with Texas average

Texas average: 97.9%

Short-stay resident measures
Pneumococcal Vaccine Info Percent of short-stay residents assessed and appropriately given the pneumococcal vaccine 100.0%
11% better than Texas average

Texas average: 90.4%

Antipsychotic medication increase Info Percent of short-stay residents who newly received an antipsychotic medication 3.1%
116% worse than Texas average

Texas average: 1.4%

Influenza Vaccine Info Percent of short-stay residents assessed and appropriately given the seasonal influenza vaccine 99.1%
13% better than Texas average

Texas average: 88.0%

Breakdown by payment type

Medicare

32% of new residents, usually for short-term rehab.

Typical stay 1 - 2 months

Private pay

59% of new residents, often for short stays.

Typical stay 1 - 2 months

Medicaid

8% of new residents, often for long-term daily care.

Typical stay 1 - 2 years

Facility Characteristics

Source: CMS Long-Term Care Facility Characteristics (Data as of Jan 2026)

Total residents 53
Medicare
13
24.5% of residents
Medicaid
22
41.5% of residents
Private pay or other
18
34% of residents
Programs & Services
Residents Group

Residents meet regularly to discuss policies, care quality, and activities

Nurse Aide Training

State-approved Nurse Aide Training and Competency Evaluation Program on-site

Active Resident Council

Organized group of residents that meets regularly to discuss facility policies, quality of life, and activities.

Finances and operations

Based on CMS SNF Cost Report for fiscal year ending in 12/2023.

Privately-owned community
Operated by a single business entity.
Net patient revenue Info Net patient revenue — what the home actually collects for resident care, after contractual allowances, bad debt and discounts are subtracted from its gross charges (CMS cost report, Worksheet G-3). It covers resident care only; money the home earns from other sources is shown separately as "Other income."
$4.6M
Net patient income Info Net patient income: net patient revenue minus the home's total operating expenses. A positive figure means it earns more from resident care than it spends to deliver it; a negative figure means the opposite. It excludes non-operating "other income."
-$38.3K
Privately-owned community Operated by a single business entity.
Net patient revenue Info Net patient revenue — what the home actually collects for resident care, after contractual allowances, bad debt and discounts are subtracted from its gross charges (CMS cost report, Worksheet G-3). It covers resident care only; money the home earns from other sources is shown separately as "Other income."
$4.6M Rank #295 / 304Revenue — State benchmarkedThis home is ranked 295th out of 304 homes in Texas. Shows this facility's annual revenue compared to the Texas average. Higher revenue generally means more resources for staffing and capital — read alongside Payroll %.Ranking totals vary by category as each rank only includes facilities that report data for that metric. Homes missing that data point aren't included in the ranking.Click the rank badge to see the full State ranking.Click here to see the full State ranking.
Net patient income Info Net patient income: net patient revenue minus the home's total operating expenses. A positive figure means it earns more from resident care than it spends to deliver it; a negative figure means the opposite. It excludes non-operating "other income."
-$38.3K
Other income Info Money the home earns outside of resident care — such as investments, grants, rentals and other non-operating sources (CMS cost report, Worksheet G-3). It is tracked separately from net patient revenue: it is not part of that figure, and it is not included in net patient income.
$102.3K
Payroll costs Info Staff salaries plus wage-related costs — benefits such as payroll taxes, health insurance and retirement — from the home's own accounting records (CMS cost report, Worksheet A). Contract or agency labor is counted separately, under other operating costs. Rank #277 / 304Payroll — State benchmarkedThis home is ranked 277th out of 304 homes in Texas. Shows total annual staff payroll benchmarked to the Texas average. Higher payroll investment relative to peers often signals better staffing and less reliance on cheaper contract labor.Ranking totals vary by category as each rank only includes facilities that report data for that metric. Homes missing that data point aren't included in the ranking.Click the rank badge to see the full State ranking.Click here to see the full State ranking.
$2.1M 44.7% of net patient revenue Info Payroll as a share of revenue: staff salaries and wage-related benefits divided by net patient revenue. A higher figure means more of each revenue dollar goes to staff pay. Rank #26 / 304Payroll % — State benchmarkedThis home is ranked 26th out of 304 homes in Texas. Shows payroll as a percentage of revenue versus the Texas average. Well-run Texas facilities typically land around 51–63% — the top third Statewide. Below 25% may signal understaffing or heavy agency use — read with Staffing ratings.Ranking totals vary by category as each rank only includes facilities that report data for that metric. Homes missing that data point aren't included in the ranking.Click the rank badge to see the full State ranking.Click here to see the full State ranking.
Other operating costs Info Everything it costs to run the home apart from payroll — food, utilities, supplies, maintenance, contract labor and administration. Calculated as total operating expense minus payroll (staff salaries and wage-related benefits).
$2.6M
Total costs Info The home's total operating expense for the year — all the costs of running it, salaries included (CMS cost report, Worksheet G-3).
$4.6M

What does this home offer?

Pets allowed icon
Pets allowed icon

Pets Allowed

Housing options icon

Housing Options: Studio / 1 Bed / 2 Bed

Building type icon
Building type icon

Building Type: Single-story

Transportation services icon

Transportation Services

Fitness and recreation icon

Fitness and Recreation

Who this home usually serves

TYPE OF STAY

Mix of rehab and long-term care

This home supports both short-term rehab and long-term care, with residents staying for a wide range of durations.

Most new residents arrive under private pay (59% of admissions), and a typical private pay stay runs around 1 - 2 months.

Admissions
212 total

Coverage residents most often arrive under.

Medicare 32%
Private pay 59%
Medicaid 8%
Discharges
213 total

Coverage residents most often leave under.

Medicare 26%
Private pay 63%
Medicaid 11%

Places of interest near Sodalis Lake Jackson

Address 14.3 miles from city center Info Estimated distance in miles from Lake Jackson's city center to Sodalis Lake Jackson's address, calculated via Google Maps.

Calculate Travel Distance to Sodalis Lake Jackson

Add your location

Address

Compare Nursing Home around Texas

The information below is reported by the Texas Health and Human Services Commission.

5 facilities compared · CMS & TX Dept. of Health data

The Legacy Midtown Park
NH
AL
HC
IL
MC
Dallas (Vickery Meadow)
98
Facility 98
TX AVG 80
Rank #376 / 988
87.5%
Facility 87.5%
TX AVG 63.5%
Rank #31 / 304
+38%
5.42
Facility 5.42
TX AVG 3.63
Rank #14 / 296
+1%+49%
$27.5k
Facility $27.5k
TX AVG $81.8k
Rank #168 / 301
4
Facility 4
TX AVG 25.9
Rank #2 / 299
1.3
Facility 1.3
TX AVG 3.7
Rank #2 / 299
-48-
45
Facility 45
TX AVG 41
Rank #628 / 1391
The Legacy Midtown Park Inc
$16.1M
Facility $16.1M
TX AVG $8.4M
Rank #9 / 304
$15.0M
Facility $15.0M
TX AVG $3.5M
Rank #9 / 304
93%
Facility 93%
TX AVG 47%
Rank #214 / 304
676489
Caraday of Houston
NH
MC
RC
Houston (Northside / Northline)
150
Facility 150
TX AVG 80
Rank #63 / 988
--
3.76
Facility 3.76
TX AVG 3.63
Rank #93 / 296
-32%+4%
$0
Facility $0
TX AVG $81.8k
Rank #1 / 301
15
Facility 15
TX AVG 25.9
Rank #66 / 299
3.8
Facility 3.8
TX AVG 3.7
Rank #202 / 299
-12-
41
Facility 41
TX AVG 41
Rank #709 / 1391
E&R Cunningham Investments, LP
$2.7M
Facility $2.7M
TX AVG $8.4M
Rank #299 / 304
$1.8M
Facility $1.8M
TX AVG $3.5M
Rank #297 / 304
66.5%
Facility 66.5%
TX AVG 47%
Rank #103 / 304
676470
Sun Valley Rehabilitation and Healthcare Center
NH
HC
MC
NC
RC
Harlingen (Estrellita Subdivision)
124
Facility 124
TX AVG 80
Rank #178 / 988
76.4%
Facility 76.4%
TX AVG 63.5%
Rank #102 / 304
+20%
3.79
Facility 3.79
TX AVG 3.63
Rank #93 / 296
-15%+4%
$0
Facility $0
TX AVG $81.8k
Rank #1 / 301
5
Facility 5
TX AVG 25.9
Rank #6 / 299
2.5
Facility 2.5
TX AVG 3.7
Rank #64 / 299
-94-
37
Facility 37
TX AVG 41
Rank #808 / 1391
Av Rehab LLC
$9.2M
Facility $9.2M
TX AVG $8.4M
Rank #176 / 304
$4.9M
Facility $4.9M
TX AVG $3.5M
Rank #163 / 304
53.1%
Facility 53.1%
TX AVG 47%
Rank #129 / 304
676493
Houston Transitional Care
NH
HC
MC
NC
PC
RC
Houston (Braeburn)
70
Facility 70
TX AVG 80
Rank #517 / 988
90.3%
Facility 90.3%
TX AVG 63.5%
Rank #18 / 304
+42%
3.17
Facility 3.17
TX AVG 3.63
Rank #222 / 296
+22%-13%
$0
Facility $0
TX AVG $81.8k
Rank #1 / 301
16
Facility 16
TX AVG 25.9
Rank #76 / 299
5.3
Facility 5.3
TX AVG 3.7
Rank #274 / 299
-67-
75
Facility 75
TX AVG 41
Rank #67 / 1391
Ahmad El-Saadi
$12.3M
Facility $12.3M
TX AVG $8.4M
Rank #31 / 304
$5.1M
Facility $5.1M
TX AVG $3.5M
Rank #134 / 304
41.4%
Facility 41.4%
TX AVG 47%
Rank #301 / 304
676435
Sodalis Lake Jackson
NH
AL
IL
MC
RC
Lake Jackson
108
Facility 108
TX AVG 80
Rank #321 / 988
58.2%
Facility 58.2%
TX AVG 63.5%
Rank #211 / 304
-8%
3.45
Facility 3.45
TX AVG 3.63
Rank #146 / 296
+45%-5%
$0
Facility $0
TX AVG $81.8k
Rank #1 / 301
6
Facility 6
TX AVG 25.9
Rank #8 / 299
2.0
Facility 2.0
TX AVG 3.7
Rank #24 / 299
-57-
28
Facility 28
TX AVG 41
Rank #956 / 1391
Oak Village Healthcare Ltc Partners, Inc
$4.6M
Facility $4.6M
TX AVG $8.4M
Rank #295 / 304
$2.1M
Facility $2.1M
TX AVG $3.5M
Rank #277 / 304
44.7%
Facility 44.7%
TX AVG 47%
Rank #26 / 304
676307

Financial Assistance for
Nursing Home in Texas

Sodalis Lake Jackson is located in Lake Jackson, Texas.
Here are the financial assistance programs available to residents in Texas.

Get Financial aid guidance

Community Care for the Aged and Disabled (CCAD)

TX Medicaid CCAD

Age 65+ or disabled
General Texas resident, Medicaid-eligible, care need (not always nursing home level).
Income Limits (2025) ~$2,829/month 300% FBR, individual
Asset Limits $2,000 (individual), $3,000 (couple).
TX

Large state; rural access challenges.

Benefits
Personal care (5-7 hours/day) Respite (240 hours/year) Adult day care (~$60/day) Home aides

Texas Community Care Services

TX CCS

Age 60+
General Texas resident, at risk of decline.
Income Limits ~$2,000/month individual, varies
Asset Limits $5,000 individual
TX

Limited funding; high demand in urban areas.

Benefits
In-home care (3-5 hours/week) Respite (up to 10 days/year) Transportation (~5 trips/month)

Area Agency on Aging (AAA) Services

Texas AAA Services

Age 60+
General TX resident; no income/asset limits.
Income Limits (2025) None; donations encouraged.
Asset Limits Not assessed.
TX

28 AAAs; includes Meals on Wheels in some areas.

Benefits
Meals (~$5-$7/meal) Transportation Homemaker services (~4 hours/week) Respite (~5 days/year) Legal aid

Medicare Savings Program (MSP)

Texas Medicare Savings Program

Age 65+ or disabled
General TX resident, Medicare Part A/B.
Income Limits (2025) ~$2,510/month (QMB), ~$3,380/month (SLMB), ~$3,598/month (QI)—individual.
Asset Limits $9,430 (individual), $14,130 (couple).
TX

Includes Extra Help for Part D; no waitlist.

Benefits
Covers Part B premiums ($174.70/month) Deductibles ($240/year) Copays (~20%)

Family Caregiver Support Program (FCSP)

Texas Family Caregiver Support Program

Age
General Caregivers of 60+ needing care or 55+ caregivers of others; TX resident; 2+ ADLs.
Income Limits (2025) No strict cap; prioritizes low-income ~$24,980/year
Asset Limits Not assessed.
TX

High rural demand; includes grandparent caregivers.

Benefits
Respite (4-6 hours/week or 5 days/year) Adult day care ($60/day) Training Supplies (~$500/year)

VA Aid and Attendance (A&A) and Housebound Benefits

Texas VA Aid and Attendance/Housebound

Age 65+ or disabled veteran/spouse
General TX resident, wartime service, ADL help (A&A) or homebound.
Income Limits (2025) Net income < ~$1,984/month (veteran with dependent, A&A); pension offsets income.
Asset Limits ~$155,356 net worth
TX

High veteran population; supports rural/urban needs.

Benefits
Cash (~$1,433-$2,642/month veteran, ~$951-$1,318 spouse) for care costs

Property Tax Exemption for Seniors

Texas Senior Property Tax Exemption

Age 65+
General TX resident, homeowner (homestead).
Income Limits (2025) None; tax-based eligibility.
Asset Limits Not assessed.
TX

$25,000+ exemption; optional freeze in some counties; saves ~$500-$1,000/year.

Benefits
Tax exemption or freeze (~$500-$1,000/year savings)

Senior Farmers’ Market Nutrition Program (SFMNP)

Texas SFMNP

Age 60+
General TX resident, low-income.
Income Limits (2025) ~$2,322/month 185% FPL
Asset Limits Not assessed.
TX

Vouchers (~$50/season); serves ~20,000 via 28 AAAs.

Benefits
Vouchers (~$50/season) for produce at farmers’ markets

Frequently Asked Questions about Sodalis Lake Jackson

What neighborhood is Sodalis Lake Jackson in?

Sodalis Lake Jackson is in the Lake Jackson neighborhood of Lake Jackson.

Who is the owner of Sodalis Lake Jackson?

The legal owner and operator of Sodalis Lake Jackson is Ec Opco Lake Jackson, Llc.

Is Sodalis Lake Jackson in a walkable area?

Sodalis Lake Jackson has a walk score of 28. Somewhat walkable. A few nearby services may be reachable on foot, but most trips require transportation.

What is the license number of Sodalis Lake Jackson?

According to TX state health department records, Sodalis Lake Jackson's license number is 148996.

When does Sodalis Lake Jackson's license expire?

According to TX state health department records, Sodalis Lake Jackson's license expires on January 3, 2026.

What is the occupancy rate at Sodalis Lake Jackson?

Sodalis Lake Jackson's occupancy is 58%.

Who is the administrator of Sodalis Lake Jackson?

Tracy Soileau is the administrator of Sodalis Lake Jackson.

Guides for Better Senior Living

Care Cost Calculator: See Prices in Your Area

Nursing Home Data Explorer

Don’t Wait Too Long: 7 Red Flag Signs Your Parent Needs Assisted Living Now

The True Cost of Assisted Living in 2025 – And How Families Are Paying For It

Understanding Senior Living Costs: Pricing Models, Discounts & Financial Assistance