• Home
  • Nursing Home in Florida
Sodalis Senior Living
Nursing Home, Assisted Living, Memory Care & Respite Care · Merritt Island, FL
CMS overall rating Info CMS (the Centers for Medicare & Medicaid Services) is the federal agency that rates nursing home quality. Its Overall Rating runs from 1 to 5 stars, combining health inspections, staffing, and quality measures, with inspections weighted most heavily.

Sodalis Senior Living

Nursing Home, Assisted Living, Memory Care & Respite Care · Merritt Island, FL
CMS overall rating Info CMS (the Centers for Medicare & Medicaid Services) is the federal agency that rates nursing home quality. Its Overall Rating runs from 1 to 5 stars, combining health inspections, staffing, and quality measures, with inspections weighted most heavily.
Calculator: See prices in your area
Sodalis Senior Living accepts Medicare, Medicaid, and private pay.

Overview of Sodalis Senior Living

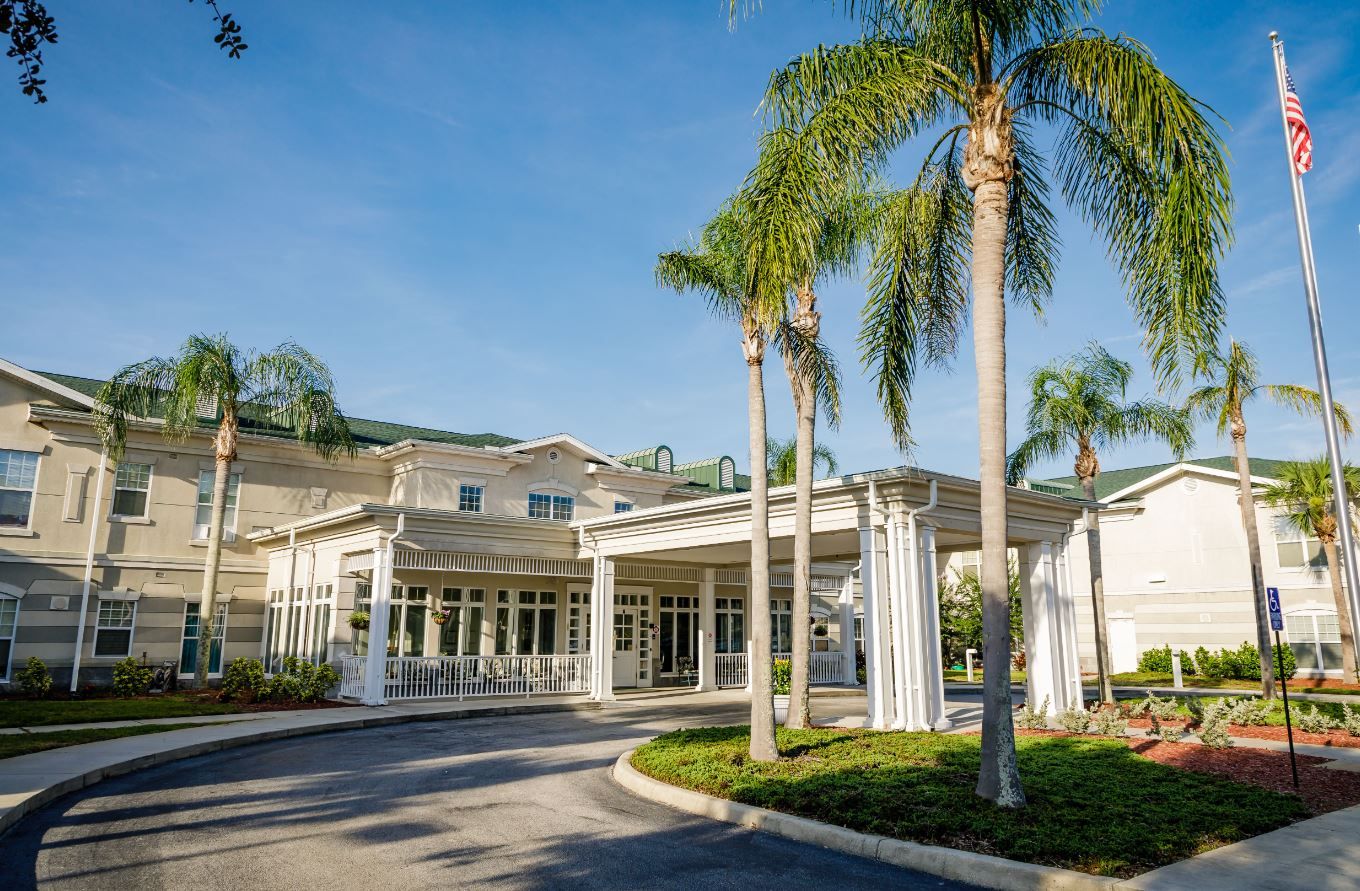
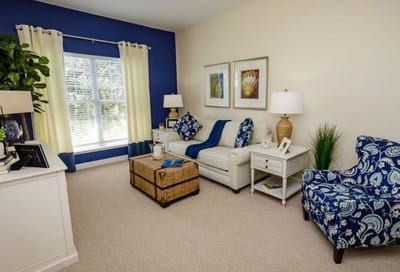
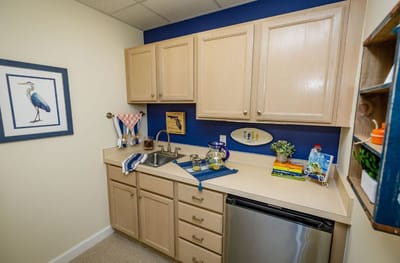
At Sodalis Senior Living, they encourage an engaged lifestyle and offer compassionate care to all their residents. The community offers studio and one-bedroom apartments, giving residents and their families the option to choose what kind of space they want, depending on their comfort level they seek. Additionally, when residents begin their stay, they are given a personalized care plan by a professional team to meet their needs.

Aside from the excellent facilities, Sodalis Senior Living offers various activities for engagement for their residents. They ensure that their residents enjoy their life inside the facility and get to socialize with their new family. Furthermore, they are given spaces so they can just relax and enjoy their free time. Seniors residents are sure to enjoy their stay at Sodalis Senior Living.

Quality ratings

Measured by Centers for Medicare & Medicaid Services (CMS)

Overall rating Info The Overall CMS Rating combines results from health inspections, staffing levels and quality measures. Health inspections carry the most weight. Staffing and quality scores can increase or decrease the final rating based on performance compared to state and national standards.
Health Inspection Info Based on the results of the facility's three most recent standard inspections and any complaint investigations. CMS reviews the number, scope, and severity of deficiencies, with more recent findings weighted more heavily.
Staffing Info Measures average nursing staff hours per resident per day, including Registered Nurses (RNs) and total nursing staff. Ratings are adjusted based on the level of care residents require and are compared to state and national benchmarks.
Quality Measures Info Based on clinical and physical health indicators reported to CMS, such as hospital readmissions, falls, pressure ulcers, and improvements in mobility. These measures reflect how well residents' health needs are being managed.

Staffing hours breakdown

Info Daily nursing hours per resident by staff type, reported to CMS. Higher is generally better — compare this facility to state and national averages to see where staffing stands.

Hours per resident per day — compared to state averages

Total nursing care / resident Info Total adjusted nursing hours per resident per day, combining RN, LPN, and aide time. CMS adjusts this for case-mix so facilities can be fairly compared.
3h 45m per day
Rank #145 / 253Nurse hours — State benchmarkedThis home is ranked 145th out of 253 homes in Florida. Shows adjusted nurse hours per resident per day benchmarked to the Florida average, with a ranking across 253 Florida facilities. More hours mean more direct care. The national average is about 3.5 hrs; below 3.0 is a red flag.Rankings are based only on facilities in Florida that report data for that category. Facilities without available data are excluded from the ranking.Click the rank badge to see the full State ranking.Click here to see the full State ranking.
vs avg
Staff typeHours / Day / Residentvs state avg
Registered Nurse (RN) Info RNs hold the highest nursing license and can assess residents, interpret test results, and direct care plans. More RN hours per day often signals stronger clinical oversight and faster response to health changes. 32m per day
LPN / LVN Info Licensed Practical Nurses (LPNs) or Licensed Vocational Nurses (LVNs) deliver routine hands-on care — medication administration, wound dressing, and monitoring vital signs. They work under RN supervision and make up a large share of daily bedside care. 53m per day
Nurse Aide Info Certified Nurse Aides (CNAs) provide the most direct day-to-day assistance: bathing, dressing, feeding, and mobility. Nurse aide hours are typically the largest staffing category and directly affect residents' quality of life. 2h 9m per day
Weekend Total Nursing Info Combined nursing hours (RN + LPN + Nurse Aide) per resident per day on weekends. Staffing often drops on weekends — this figure reveals whether the facility maintains adequate coverage outside of weekday hours. 3h 18m per day
Physical Therapist Info Hours per resident per day provided by licensed Physical Therapists (PTs) or PT Assistants. PT services help residents recover mobility after injury or illness and are especially important for post-acute (short-stay) rehabilitation. 3m per day
Weekend RN Info Registered nurse hours specifically on weekends. Facilities sometimes reduce RN presence on Saturdays and Sundays — a low weekend RN figure compared to weekday hours can indicate reduced clinical oversight when most administrative staff are absent. 21m per day

Capacity and availability

This home is often near full

Higher occupancy than the state average
Occupancy rate
95.9% Rank #13 / 258Occupancy rate — State benchmarkedThis home is ranked 13th out of 258 homes in Florida. Shows this facility's occupancy rate versus the Florida average, with its Statewide rank out of 258. Higher occupancy signals strong local demand and financial stability.Rankings are based only on facilities in Florida that report data for that category. Facilities without available data are excluded from the ranking.Click the rank badge to see the full State ranking.Click here to see the full State ranking.
Avg. Length of Stay
72 days
Bed community size
180-bed community Rank #56 / 1074Bed count — State benchmarkedThis home is ranked 56th out of 1074 homes in Florida. Shows this facility's certified or reported bed count compared to other Florida facilities. Larger communities may offer more amenities, programs, and on-site services for residents and families.Rankings are based only on facilities in Florida that report data for that category. Facilities without available data are excluded from the ranking.Click the rank badge to see the full State ranking.Click here to see the full State ranking.
A large-scale community that may provide a wide range of amenities, services, and structured programs.
Walk Score
Walk Score: 30 / 100 Rank #915 / 1486Walk Score — State benchmarkedThis home is ranked 915th out of 1486 homes in Florida. Shows how walkable this facility's neighborhood is compared to the average Walk Score across Florida facilities. Higher scores benefit residents, families, and staff.Rankings are based only on facilities in Florida that report data for that category. Facilities without available data are excluded from the ranking.Click the rank badge to see the full State ranking.Click here to see the full State ranking.
Somewhat walkable. A few nearby services may be reachable on foot, but most trips require transportation.

Contact Sodalis Senior Living

Staffing Data

Reporting period: October 1 – December 31, 2025 (Q4 2025). Source: CMS Payroll-Based Journal report.

Total staff 195
Employees 162
Contractors 33
Staff to resident ratio 1.16 : 1
0% compared with State average

State average ratio: 0 : 0

Avg staff/day 91
Average shift 8.4 hours
0% compared with State average

State average: 0 hours

Total staff hours (quarter) 70,129

Nursing staff breakdown

Q4 2025 · Oct 1 – Dec 31 More info This data comes from the CMS Payroll-Based Journal report covering October 1 – December 31, 2025.
Registered Nurse

Manages medical care and health needs.

RN Staff Info All 16 RN Staff are full-time employees. No contractors work on this role. 16
Average shift length Info Average shift length. Calculated as total hours divided by days worked and average staff per day. 10 hours
Licensed Practical Nurse

Assists with medical care and medications.

LPN Staff Info All 29 LPN Staff are full-time employees. No contractors work on this role. 29
Average shift length Info Average shift length. Calculated as total hours divided by days worked and average staff per day. 9.2 hours
Certified Nursing Assistant

Helps with daily care and mobility.

CNA Staff Info All 89 CNA Staff are full-time employees. No contractors work on this role. 89
Average shift length Info Average shift length. Calculated as total hours divided by days worked and average staff per day. 8.4 hours

Contractor staffing

Q4 2025 · Oct 1 – Dec 31 More info This data comes from the CMS Payroll-Based Journal report covering October 1 – December 31, 2025.

Total hours from contractors

10.8%

7,595 contractor hours this quarter

Physical Therapy Aide: 7 Speech Language Pathologist: 7 Physical Therapy Assistant: 7 Qualified Social Worker: 4 Respiratory Therapy Technician: 4 Occupational Therapy Assistant: 2 Occupational Therapy Aide: 1 Medical Director: 1

Staff by category

Q4 2025 · Oct 1 – Dec 31 More info This data comes from the CMS Payroll-Based Journal report covering October 1 – December 31, 2025.
Certified Nursing Assistant8908934,28492100%8.4
Licensed Practical Nurse2902912,28292100%9.2
Registered Nurse160165,48692100%10
Clinical Nurse Specialist6062,5768795%8.3
Physical Therapy Aide0772,2399199%7.1
Speech Language Pathologist0772,21792100%7.8
RN Director of Nursing5051,7617582%8.8
Mental Health Service Worker4041,7406672%8
Other Dietary Services Staff5051,7119199%7.4
Physical Therapy Assistant0771,2028896%6
Respiratory Therapy Technician0448908289%6.7
Qualified Social Worker0447749098%7.3
Dental Services Staff3037107480%6.8
Occupational Therapy Aide1125666166%8.6
Nurse Practitioner1014966267%8
Administrator1014806065%8
Dietitian1014716267%7.6
Nurse Aide in Training1011541921%8.1
Medical Director011502426%2.1
Occupational Therapy Assistant0224267%7
89 Certified Nursing Assistant
% of Days 100%
29 Licensed Practical Nurse
% of Days 100%
16 Registered Nurse
% of Days 100%
6 Clinical Nurse Specialist
% of Days 95%
7 Physical Therapy Aide
% of Days 99%
7 Speech Language Pathologist
% of Days 100%
5 RN Director of Nursing
% of Days 82%
4 Mental Health Service Worker
% of Days 72%
5 Other Dietary Services Staff
% of Days 99%
7 Physical Therapy Assistant
% of Days 96%
4 Respiratory Therapy Technician
% of Days 89%
4 Qualified Social Worker
% of Days 98%
3 Dental Services Staff
% of Days 80%
2 Occupational Therapy Aide
% of Days 66%
1 Nurse Practitioner
% of Days 67%
1 Administrator
% of Days 65%
1 Dietitian
% of Days 67%
1 Nurse Aide in Training
% of Days 21%
1 Medical Director
% of Days 26%
2 Occupational Therapy Assistant
% of Days 7%

Penalties and fines

Federal penalties imposed by CMS for regulatory violations, including civil money penalties (fines) and denials of payment for new Medicare/Medicaid admissions.

Source: CMS Penalties Database

No penalties in the past 3 years

No civil money penalties or payment denials were reported in the last 3 years.

Quality of care over time

These measures show how residents usually do over time at this home, based on health outcomes and preventive care.

High-risk clinical events score Info A composite score based on pressure ulcers, falls with injury, weight loss, walking ability decline, and activities of daily living decline. 7.6
In line with State average

State average: 7.4

Functional decline score Info A composite score based on activities of daily living decline, walking ability decline, and incontinence. 13.1
6% worse than State average

State average: 12.4

Long-stay resident measures
Need for Help with Daily Activities Increased Info Percent of long-stay residents whose need for help with daily activities has increased 13.3%
27% worse than State average

State average: 10.5%

Walking Ability Worsened Info Percent of long-stay residents whose ability to move independently worsened 11.4%
12% better than State average

State average: 12.9%

Low Risk Residents with Bowel/Bladder Incontinence Info Percent of low risk long-stay residents who lose control of their bowels or bladder 14.5%
7% worse than State average

State average: 13.5%

Falls with Major Injury Info Percent of long-stay residents experiencing one or more falls with major injury 3.8%
44% worse than State average

State average: 2.6%

High Risk Residents with Pressure Ulcers Info Percent of long-stay high risk residents with pressure ulcers 3.4%
37% better than State average

State average: 5.4%

Urinary Tract Infection Info Percent of long-stay residents with a urinary tract infection 0.2%
77% better than State average

State average: 0.9%

Lost Too Much Weight Info Percent of long-stay residents who lose too much weight 6.0%
In line with State average

State average: 6.0%

Depressive Symptoms Info Percent of long-stay residents who have depressive symptoms 2.9%
14% better than State average

State average: 3.3%

Antipsychotic Use Info Percent of long-stay residents who received an antipsychotic medication 12.5%
56% worse than State average

State average: 8.0%

Pneumococcal Vaccine Info Percent of long-stay residents assessed and appropriately given the pneumococcal vaccine 99.4%
In line with State average

State average: 97.7%

Influenza Vaccine Info Percent of long-stay residents assessed and appropriately given the seasonal influenza vaccine 100.0%
In line with State average

State average: 99.2%

Short-stay resident measures
Pneumococcal Vaccine Info Percent of short-stay residents assessed and appropriately given the pneumococcal vaccine 99.9%
6% better than State average

State average: 94.0%

Antipsychotic medication increase Info Percent of short-stay residents who newly received an antipsychotic medication 0.6%
62% better than State average

State average: 1.5%

Influenza Vaccine Info Percent of short-stay residents assessed and appropriately given the seasonal influenza vaccine 100.0%
6% better than State average

State average: 94.7%

Breakdown by payment type

Medicare

47% of new residents, usually for short-term rehab.

Typical stay 29 days

Private pay

48% of new residents, often for short stays.

Typical stay 1 - 2 months

Medicaid

5% of new residents, often for long-term daily care.

Typical stay 2 years

Facility Characteristics

Source: CMS Long-Term Care Facility Characteristics (Data as of Jan 2026)

Total residents 168
Medicare
44
26.2% of residents
Medicaid
90
53.6% of residents
Private pay or other
34
20.2% of residents
Programs & Services
Residents Group

Residents meet regularly to discuss policies, care quality, and activities

Family Member Group

Family members meet regularly to discuss policies, care quality, and activities

Active Family Council

Organized group of family members that meets regularly to discuss facility policies, resident care, and activities.

Active Resident Council

Organized group of residents that meets regularly to discuss facility policies, quality of life, and activities.

Finances and operations

Based on CMS SNF Cost Report for fiscal year ending in 12/2023.

Nonprofit
Nonprofit Corporation
Net patient revenue Info Net patient revenue — what the home actually collects for resident care, after contractual allowances, bad debt and discounts are subtracted from its gross charges (CMS cost report, Worksheet G-3). It covers resident care only; money the home earns from other sources is shown separately as "Other income."
$21.8M
Net patient income Info Net patient income: net patient revenue minus the home's total operating expenses. A positive figure means it earns more from resident care than it spends to deliver it; a negative figure means the opposite. It excludes non-operating "other income."
-$33.7K
Nonprofit Nonprofit Corporation
Net patient revenue Info Net patient revenue — what the home actually collects for resident care, after contractual allowances, bad debt and discounts are subtracted from its gross charges (CMS cost report, Worksheet G-3). It covers resident care only; money the home earns from other sources is shown separately as "Other income."
$21.8M Rank #61 / 257Revenue — State benchmarkedThis home is ranked 61st out of 257 homes in Florida. Shows this facility's annual revenue compared to the Florida average. Higher revenue generally means more resources for staffing and capital — read alongside Payroll %.Rankings are based only on facilities in Florida that report data for that category. Facilities without available data are excluded from the ranking.Click the rank badge to see the full State ranking.Click here to see the full State ranking.
Net patient income Info Net patient income: net patient revenue minus the home's total operating expenses. A positive figure means it earns more from resident care than it spends to deliver it; a negative figure means the opposite. It excludes non-operating "other income."
-$33.7K
Other income Info Money the home earns outside of resident care — such as investments, grants, rentals and other non-operating sources (CMS cost report, Worksheet G-3). It is tracked separately from net patient revenue: it is not part of that figure, and it is not included in net patient income.
$19.4K
Payroll costs Info Staff salaries plus wage-related costs — benefits such as payroll taxes, health insurance and retirement — from the home's own accounting records (CMS cost report, Worksheet A). Contract or agency labor is counted separately, under other operating costs. Rank #54 / 257Payroll — State benchmarkedThis home is ranked 54th out of 257 homes in Florida. Shows total annual staff payroll benchmarked to the Florida average. Higher payroll investment relative to peers often signals better staffing and less reliance on cheaper contract labor.Rankings are based only on facilities in Florida that report data for that category. Facilities without available data are excluded from the ranking.Click the rank badge to see the full State ranking.Click here to see the full State ranking.
$11.5M 52.9% of net patient revenue Info Payroll as a share of revenue: staff salaries and wage-related benefits divided by net patient revenue. A higher figure means more of each revenue dollar goes to staff pay. Rank #132 / 257Payroll % — State benchmarkedThis home is ranked 132nd out of 257 homes in Florida. Shows payroll as a percentage of revenue versus the Florida average. Well-run Florida facilities typically land around 49–56% — the top third Statewide. Below 25% may signal understaffing or heavy agency use — read with Staffing ratings.Rankings are based only on facilities in Florida that report data for that category. Facilities without available data are excluded from the ranking.Click the rank badge to see the full State ranking.Click here to see the full State ranking.
Other operating costs Info Everything it costs to run the home apart from payroll — food, utilities, supplies, maintenance, contract labor and administration. Calculated as total operating expense minus payroll (staff salaries and wage-related benefits).
$10.3M
Total costs Info The home's total operating expense for the year — all the costs of running it, salaries included (CMS cost report, Worksheet G-3).
$21.8M

What does this home offer?

Pets allowed icon
Pets allowed icon

Pets Allowed

Housing options icon

Housing Options: Studio / 1 Bed

Building type icon
Building type icon

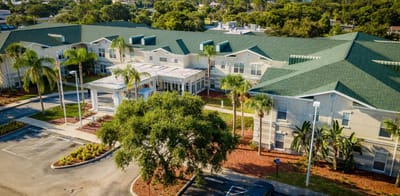
Building Type: Two-story

Transportation services icon

Transportation Services

Fitness and recreation icon

Fitness and Recreation

Who this home usually serves

TYPE OF STAY

Mix of rehab and long-term care

This home supports both short-term rehab and long-term care, with residents staying for a wide range of durations.

New residents most often arrive under private pay (48% of admissions), and a typical private pay stay runs around 1 - 2 months.

Admissions
874 total

Coverage residents most often arrive under.

Medicare 47%
Private pay 48%
Medicaid 5%
Discharges
871 total

Coverage residents most often leave under.

Medicare 46%
Private pay 48%
Medicaid 5%

Places of interest near Sodalis Senior Living

Address 5.5 miles from city center Info Estimated distance in miles from Merritt Island's city center to Sodalis Senior Living's address, calculated via Google Maps.

Calculate Travel Distance to Sodalis Senior Living

Add your location

Address

Compare Nursing Homes around the area

The information below is reported by the Florida Agency for Health Care Administration (AHCA).

Sodalis Senior Living
NH
AL
MC
RC
Merritt Island -180 - 30 Studio / 1 Bed
Terracina Grand
NH
AL
IL
MC
RC
Naples -200 A+ 12 Studio / 1 Bed / 2 Bed
Brookdale DeLand
NH
AL
MC
Deland (Scarlett) -89 A+ 14 Studio / Suite

Frequently Asked Questions about Sodalis Senior Living

Is Sodalis Senior Living in a walkable area?

Sodalis Senior Living has a walk score of 30. Somewhat walkable. A few nearby services may be reachable on foot, but most trips require transportation.

What is the occupancy rate at Sodalis Senior Living?

Sodalis Senior Living's occupancy is 95.9%.

Does Sodalis Senior Living operate as a for-profit or non-profit?

Sodalis Senior Living is registered as a non-profit.

Are there photos of Sodalis Senior Living?

Yes — there are 4 photos of Sodalis Senior Living in the photo gallery on this page.

What is the address of Sodalis Senior Living?

Sodalis Senior Living is located at 535 Crockett Blvd, Merritt Island, FL 32953.

What is the phone number of Sodalis Senior Living?

(321) 454-2363 will put you in contact with the team at Sodalis Senior Living.

Is Sodalis Senior Living Medicare or Medicaid certified?

Yes — Sodalis Senior Living is a CMS-certified provider of Medicare and Medicaid.

Guides for Better Senior Living

Care Cost Calculator: See Prices in Your Area

Nursing Home Data Explorer

Don’t Wait Too Long: 7 Red Flag Signs Your Parent Needs Assisted Living Now

The True Cost of Assisted Living in 2025 – And How Families Are Paying For It

Understanding Senior Living Costs: Pricing Models, Discounts & Financial Assistance