Total health inspections
3
Massachusetts average 4.5
Last Health inspection on Jul 2024

We arrange tours, appointments, and even moving support so you don’t have to
Thank you for your interest!
Our team will be in touch shortly to help with next steps.
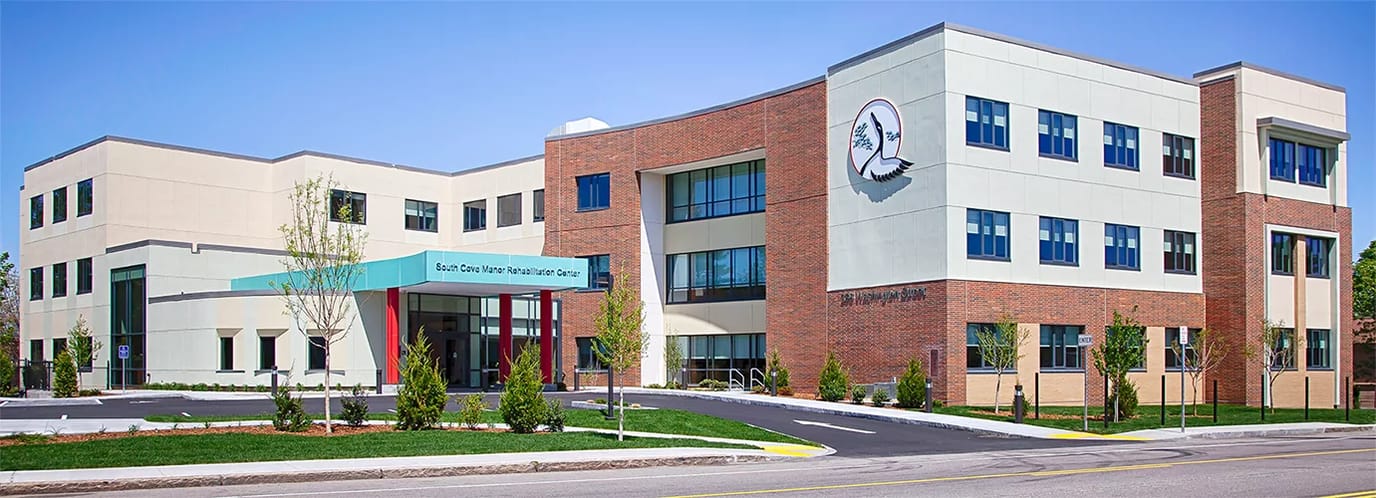
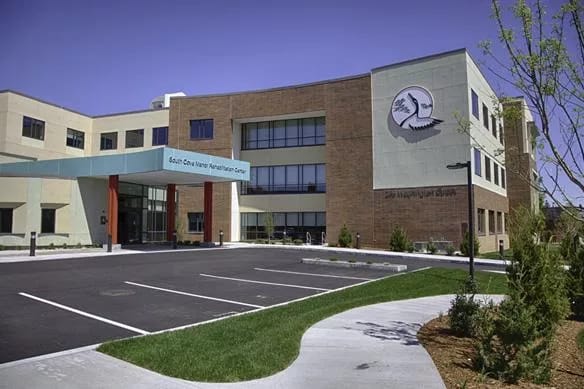

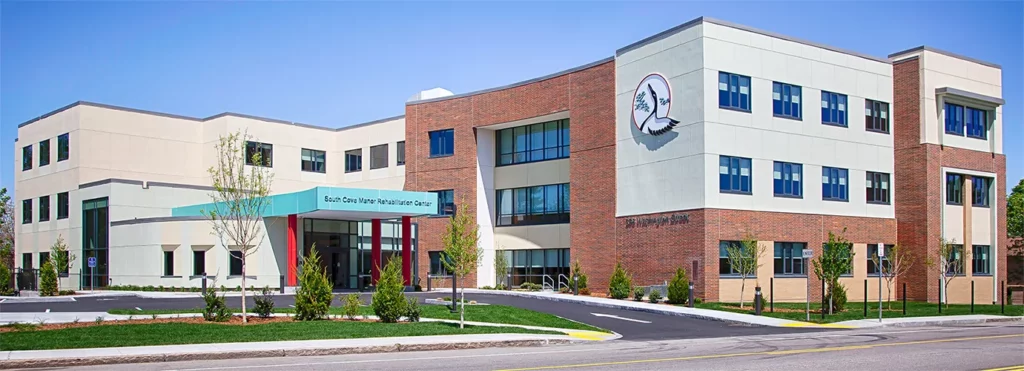
South Cove Manor at Quincy Point Rehabilitation Center was established in 1985 by a group of passionate community advocates, envisioning a nursing center tailored to the specific needs of the growing Asian elderly population. In 2014, South Cove Manor transitioned to a new, state-of-the-art campus in Quincy from its original location on Shawmut Avenue in Boston. This strategic move enabled the center to introduce innovative care models and significantly expand its rehabilitation services. South Cove Manor’s steadfast dedication to delivering exceptionally high-quality care and fostering innovation has led to outstanding regulatory ratings.
Recognizing the challenges faced by this community due to language and cultural barriers in traditional care facilities, the founders aspired to create a welcoming home that honored its residents’ cultural backgrounds and traditions. Despite its strong roots in the Asian community, South Cove Manor embraces and serves individuals from diverse backgrounds. This inclusive approach is reflected in its multicultural staff, various activities, and varied menus, fostering an environment that warmly welcomes everyone. The center proudly boasts the highest Five-Star quality rating from the Centers for Medicare and Medicaid Services (CMS). It consistently earns deficiency-free survey ratings from the Massachusetts Department of Public Health. These accolades position South Cove Manor among the top nursing facilities in Massachusetts and across the nation.
Offers a balance of services and community atmosphere.
Occupancy is moderate, suggesting balanced demand.
Residents typically stay for brief periods, with frequent admissions and discharges throughout the year.
27% of new residents, usually for short-term rehab.
62% of new residents, often for short stays.
11% of new residents, often for long-term daily care.
Massachusetts average 4.5
Last Health inspection on Jul 2024
Massachusetts average 32.7
Massachusetts average 7.24
Health citations are formal notices following inspections when they fail to comply with safety and care standards.
All 30 citations resulted from standard inspections.
Massachusetts average: 0.3
Massachusetts average: 1.5
Data sourced from CMS Health Deficiencies reports. Citation severity codes range from A (least serious) to L (most serious). Immediate Jeopardy (J-L) citations indicate situations where the facility's noncompliance has placed residents at risk of death or serious harm.
Nursing Home Licensed facility providing 24/7 skilled nursing care for residents with complex, ongoing medical needs. Staffed by RNs, LPNs, and CNAs. Inspected and star-rated annually by CMS. Accepts Medicare (short-term rehab) and Medicaid (long-term care).
Respite Care Short-term temporary care — days to weeks — to give family caregivers a break. Full care provided during the stay. Often used after hospitalization or to trial a facility before a permanent placement decision.
Nursing Home Licensed facility providing 24/7 skilled nursing care for residents with complex, ongoing medical needs. Staffed by RNs, LPNs, and CNAs. Inspected and star-rated annually by CMS. Accepts Medicare (short-term rehab) and Medicaid (long-term care).
Nursing Home Licensed facility providing 24/7 skilled nursing care for residents with complex, ongoing medical needs. Staffed by RNs, LPNs, and CNAs. Inspected and star-rated annually by CMS. Accepts Medicare (short-term rehab) and Medicaid (long-term care).
Nursing Home Licensed facility providing 24/7 skilled nursing care for residents with complex, ongoing medical needs. Staffed by RNs, LPNs, and CNAs. Inspected and star-rated annually by CMS. Accepts Medicare (short-term rehab) and Medicaid (long-term care).
![]() 0.9 mile from city center — 3.88 miles to nearest hospital (Encompass Health Rehabilitation Hospital of Braintree)
0.9 mile from city center — 3.88 miles to nearest hospital (Encompass Health Rehabilitation Hospital of Braintree)
Add your location
This data corresponds to Q2 2025 and is based on CMS Payroll-Based Journal.
Massachusetts average ratio: 1.70:1
Massachusetts average: 7.9 hours
Manages medical care and health needs.
This role is partially covered by contractors.
Assists with medical care and medications.
This role is partially covered by contractors.
Helps with daily care and mobility.
This role is partially covered by contractors.
Total hours from contractors
2,795 contractor hours this quarter
| Certified Nursing Assistant | 66 | 3 | 69 | 28,427 | 91 | 100% | 7.5 |
| Licensed Practical Nurse | 19 | 10 | 29 | 8,785 | 91 | 100% | 8 |
| Registered Nurse | 16 | 13 | 29 | 4,737 | 91 | 100% | 7.1 |
| Other Dietary Services Staff | 16 | 0 | 16 | 4,014 | 91 | 100% | 6.9 |
| Clinical Nurse Specialist | 5 | 0 | 5 | 1,585 | 75 | 82% | 7.8 |
| Mental Health Service Worker | 2 | 0 | 2 | 901 | 64 | 70% | 7.4 |
| Nurse Aide in Training | 4 | 0 | 4 | 712 | 69 | 76% | 5.7 |
| Qualified Social Worker | 0 | 1 | 1 | 512 | 64 | 70% | 8 |
| RN Director of Nursing | 1 | 0 | 1 | 479 | 64 | 70% | 7.5 |
| Physical Therapy Assistant | 0 | 2 | 2 | 473 | 65 | 71% | 7.3 |
| Administrator | 1 | 0 | 1 | 454 | 62 | 68% | 7.3 |
| Nurse Practitioner | 1 | 0 | 1 | 453 | 61 | 67% | 7.4 |
| Respiratory Therapy Technician | 0 | 2 | 2 | 443 | 63 | 69% | 7 |
| Dietitian | 1 | 0 | 1 | 442 | 59 | 65% | 7.5 |
| Speech Language Pathologist | 0 | 1 | 1 | 378 | 57 | 63% | 6.6 |
| Occupational Therapy Aide | 1 | 0 | 1 | 373 | 50 | 55% | 7.5 |
| Medical Director | 0 | 1 | 1 | 154 | 68 | 75% | 2.3 |
| Occupational Therapy Assistant | 0 | 2 | 2 | 70 | 28 | 31% | 2.4 |
Source: CMS Long-Term Care Facility Characteristics (Data as of Jan 2026)
Residents meet regularly to discuss policies, care quality, and activities
State-approved Nurse Aide Training and Competency Evaluation Program on-site
Organized group of residents that meets regularly to discuss facility policies, quality of life, and activities.
Data sourced from CMS Long-Term Care Facility Characteristics quarterly report. Payer mix reflects the current resident census by primary payment source.
These measures show how residents usually do over time at this home, based on health outcomes and preventive care.
Massachusetts average: 10.2
Massachusetts average: 20.0
Massachusetts average: 18.7%
Massachusetts average: 19.3%
Massachusetts average: 22.1%
Massachusetts average: 3.6%
Massachusetts average: 4.7%
Massachusetts average: 2.1%
Massachusetts average: 5.2%
Massachusetts average: 10.7%
Massachusetts average: 20.3%
Massachusetts average: 91.9%
Massachusetts average: 94.8%
Massachusetts average: 1.86
Massachusetts average: 1.54
Massachusetts average: 76.7%
Massachusetts average: 1.3%
Massachusetts average: 77.7%
Massachusetts average: 0.8%
Massachusetts average: 50.6%
Quality measures are calculated from Minimum Data Set (MDS) assessments. For most measures, lower percentages indicate better care quality.
Historical financial and operational data for South Cove Manor at Quincy Point Rehabilitation Center based on CMS SNF Cost Reports.
Loading trend charts...
Care Cost Calculator: See Prices in Your Area
Nursing Home Data Explorer
Don’t Wait Too Long: 7 Red Flag Signs Your Parent Needs Assisted Living Now
The True Cost of Assisted Living in 2025 – And How Families Are Paying For It
Understanding Senior Living Costs: Pricing Models, Discounts & Financial Assistance

Touring a community? Use this expert-backed checklist to stay organized, ask the right questions, and find the perfect fit.
We'll send you a PDF version of the touring checklist.