


Total staff
235
Employees
129
Contractors
106
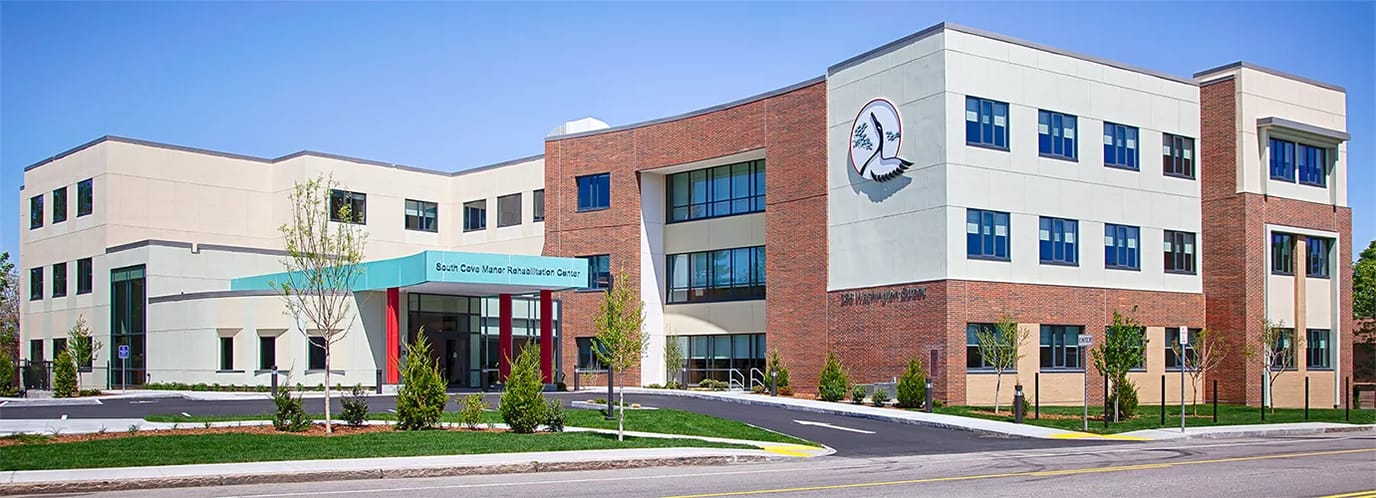
South Cove Manor at Quincy Point Rehabilitation Center was established in 1985 by a group of passionate community advocates, envisioning a nursing center tailored to the specific needs of the growing Asian elderly population. In 2014, South Cove Manor transitioned to a new, state-of-the-art campus in Quincy from its original location on Shawmut Avenue in Boston. This strategic move enabled the center to introduce innovative care models and significantly expand its rehabilitation services. South Cove Manor’s steadfast dedication to delivering exceptionally high-quality care and fostering innovation has led to outstanding regulatory ratings.
Recognizing the challenges faced by this community due to language and cultural barriers in traditional care facilities, the founders aspired to create a welcoming home that honored its residents’ cultural backgrounds and traditions. Despite its strong roots in the Asian community, South Cove Manor embraces and serves individuals from diverse backgrounds. This inclusive approach is reflected in its multicultural staff, various activities, and varied menus, fostering an environment that warmly welcomes everyone. The center proudly boasts the highest Five-Star quality rating from the Centers for Medicare and Medicaid Services (CMS). It consistently earns deficiency-free survey ratings from the Massachusetts Department of Public Health. These accolades position South Cove Manor among the top nursing facilities in Massachusetts and across the nation.
| Staff type | Hours / Day / Resident | vs state avg |
|---|---|---|
|
Registered Nurse (RN)
| 37m per day | ▼ 5% State avg: 39m per day · National avg: 41m per day |
|
LPN / LVN
| 36m per day | ▼ 38% State avg: 58m per day · National avg: 52m per day |
|
Nurse Aide
| 2h 22m per day | ▲ 4% State avg: 2h 16m per day · National avg: 2h 21m per day |
|
Weekend Total Nursing
| 3h 21m per day | ▼ 3% State avg: 3h 27m per day · National avg: 3h 26m per day |
|
Physical Therapist
| 0m per day | ▼ 90% State avg: 4m per day · National avg: 4m per day |
|
Weekend RN
| 30m per day | ▲ 8% State avg: 28m per day · National avg: 29m per day |
Reporting period: October 1 – December 31, 2025 (Q4 2025). Source: CMS Payroll-Based Journal report.
Manages medical care and health needs.
Assists with medical care and medications.
Helps with daily care and mobility.
Total hours from contractors
3,980 contractor hours this quarter
| Certified Nursing Assistant | 69 | 32 | 101 | 28,733 | 92 | 100% | 7.7 |
| Licensed Practical Nurse | 15 | 33 | 48 | 7,465 | 92 | 100% | 8.1 |
| Registered Nurse | 16 | 27 | 43 | 5,360 | 92 | 100% | 7.1 |
| Other Dietary Services Staff | 16 | 0 | 16 | 4,184 | 92 | 100% | 7.3 |
| Clinical Nurse Specialist | 5 | 0 | 5 | 1,958 | 88 | 96% | 7.7 |
| Mental Health Service Worker | 2 | 0 | 2 | 892 | 63 | 68% | 7.4 |
| Nurse Aide in Training | 2 | 0 | 2 | 843 | 82 | 89% | 6.6 |
| Speech Language Pathologist | 0 | 1 | 1 | 471 | 67 | 73% | 7 |
| Physical Therapy Assistant | 0 | 2 | 2 | 469 | 66 | 72% | 7.1 |
| Administrator | 1 | 0 | 1 | 405 | 54 | 59% | 7.5 |
| Nurse Practitioner | 1 | 0 | 1 | 398 | 53 | 58% | 7.5 |
| Dietitian | 1 | 0 | 1 | 388 | 52 | 57% | 7.5 |
| Occupational Therapy Aide | 1 | 0 | 1 | 339 | 45 | 49% | 7.5 |
| Qualified Social Worker | 0 | 4 | 4 | 161 | 41 | 45% | 3.9 |
| Medical Director | 0 | 1 | 1 | 136 | 29 | 32% | 4.7 |
| Respiratory Therapy Technician | 0 | 3 | 3 | 88 | 43 | 47% | 2 |
| Occupational Therapy Assistant | 0 | 2 | 2 | 76 | 35 | 38% | 2.1 |
| Physical Therapy Aide | 0 | 1 | 1 | 1 | 1 | 1% | 1 |
Federal penalties imposed by CMS for regulatory violations, including civil money penalties (fines) and denials of payment for new Medicare/Medicaid admissions.
Source: CMS Penalties Database
No penalties in the past 3 years
No civil money penalties or payment denials were reported in the last 3 years.
These measures show how residents usually do over time at this home, based on health outcomes and preventive care.
Massachusetts average: 10.2
Massachusetts average: 20.0
Massachusetts average: 18.7%
Massachusetts average: 19.3%
Massachusetts average: 22.1%
Massachusetts average: 3.6%
Massachusetts average: 4.7%
Massachusetts average: 2.1%
Massachusetts average: 5.2%
Massachusetts average: 10.7%
Massachusetts average: 20.3%
Massachusetts average: 91.9%
Massachusetts average: 94.8%
Massachusetts average: 1.86
Massachusetts average: 1.54
Massachusetts average: 76.7%
Massachusetts average: 1.3%
Massachusetts average: 77.7%
Massachusetts average: 0.8%
Massachusetts average: 50.6%
Quality measures are calculated from Minimum Data Set (MDS) assessments. For most measures, lower percentages indicate better care quality.
27% of new residents, usually for short-term rehab.
62% of new residents, often for short stays.
11% of new residents, often for long-term daily care.
Source: CMS Long-Term Care Facility Characteristics (Data as of Jan 2026)
Residents meet regularly to discuss policies, care quality, and activities
State-approved Nurse Aide Training and Competency Evaluation Program on-site
Organized group of residents that meets regularly to discuss facility policies, quality of life, and activities.
Data sourced from CMS Long-Term Care Facility Characteristics quarterly report. Payer mix reflects the current resident census by primary payment source.
Historical financial and operational data for South Cove Manor at Quincy Point Rehabilitation Center from 2011–2023, based on CMS SNF Cost Reports.
Key figures below are for fiscal year ending in 12/2023.
Based on CMS SNF Cost Report for fiscal year ending in 12/2023.
Residents typically stay for brief periods, with frequent admissions and discharges throughout the year.
Most new residents arrive under private pay (62% of admissions), and a typical private pay stay runs around 1 - 2 months.
Coverage residents most often arrive under.
Coverage residents most often leave under.
![]() 0.6 miles from city center
0.6 miles from city center
![]() Estimated distance in miles from Quincy's city center to South Cove Manor at Quincy Point Rehabilitation Center's address, calculated via Google Maps.
Estimated distance in miles from Quincy's city center to South Cove Manor at Quincy Point Rehabilitation Center's address, calculated via Google Maps.
Add your location
Info below is compiled from CMS reports & the MA Executive Office of Elder Affairs, senior community websites & trusted data sources such as Walk Score & BBB.
Communities are listed from highest to lowest based on our ranking methodology.
| South Cove Manor at Quincy Point Rehabilitation Center | NH PC RC SNF | Quincy (Quincy Point) | 141
Facility
141
MA AVG
94
Rank
#37 / 276 |
96.5%
Facility
96.5%
MA AVG
78.3
Rank
#4 / 81 | +23% | 3.77
Facility
3.77
MA AVG
3.93
Rank
#44 / 86 | +44% | -4% | $0
Facility
$0
MA AVG
$76.6k
Rank
#1 / 87 | 30
Facility
30
MA AVG
32.7
Rank
#47 / 86 | 10.0
Facility
10.0
MA AVG
7.2
Rank
#73 / 86 | - | 136 | - |
80
Facility
80
MA AVG
53
Rank
#119 / 498 | Marianne Bowler | $18.1MFiscal year ending 12/2023
Facility
$18.1MFiscal year ending 12/2023
MA AVG
$17.4M
Rank
#52 / 89 | $11.7MFiscal year ending 12/2023
Facility
$11.7MFiscal year ending 12/2023
MA AVG
$6.5M
Rank
#24 / 89 | 64.4%Fiscal year ending 12/2023
Facility
64.4%Fiscal year ending 12/2023
MA AVG
43.6%
Rank
#10 / 89 | 225514 | ||||
| Pope Rehabilitation & Skilled Nursing Center | NH HOS PC RC SNF | Weymouth (Weymouth Landing) | 123
Facility
123
MA AVG
94
Rank
#55 / 276 |
92.4%
Facility
92.4%
MA AVG
78.3
Rank
#20 / 81 | +18% | 4.01
Facility
4.01
MA AVG
3.93
Rank
#34 / 86 | -29% | +2% | $0
Facility
$0
MA AVG
$76.6k
Rank
#1 / 87 | 14
Facility
14
MA AVG
32.7
Rank
#18 / 86 | 3.5
Facility
3.5
MA AVG
7.2
Rank
#11 / 86 | - | 114 | - |
53
Facility
53
MA AVG
53
Rank
#244 / 498 | Paul Mahoney | $16.1MFiscal year ending 12/2023
Facility
$16.1MFiscal year ending 12/2023
MA AVG
$17.4M
Rank
#48 / 89 | $9.7MFiscal year ending 12/2023
Facility
$9.7MFiscal year ending 12/2023
MA AVG
$6.5M
Rank
#47 / 89 | 60%Fiscal year ending 12/2023
Facility
60%Fiscal year ending 12/2023
MA AVG
43.6%
Rank
#43 / 89 | 225309 | ||||
| Alliance Health at Marina Bay | NH HOS PC RC SNF | Quincy (Marina Bay) | 167
Facility
167
MA AVG
94
Rank
#18 / 276 |
89.9%
Facility
89.9%
MA AVG
78.3
Rank
#27 / 81 | +15% | 4.34
Facility
4.34
MA AVG
3.93
Rank
#18 / 86 | +64% | +10% | $9.8k
Facility
$9.8k
MA AVG
$76.6k
Rank
#55 / 87 | 24
Facility
24
MA AVG
32.7
Rank
#37 / 86 | 6.0
Facility
6.0
MA AVG
7.2
Rank
#42 / 86 | 1 | 150 | - |
13
Facility
13
MA AVG
53
Rank
#449 / 498 | Cailin Gallego | $22.5MFiscal year ending 12/2023
Facility
$22.5MFiscal year ending 12/2023
MA AVG
$17.4M
Rank
#6 / 89 | $12.1MFiscal year ending 12/2023
Facility
$12.1MFiscal year ending 12/2023
MA AVG
$6.5M
Rank
#14 / 89 | 53.7%Fiscal year ending 12/2023
Facility
53.7%Fiscal year ending 12/2023
MA AVG
43.6%
Rank
#85 / 89 | 225680 | ||||
| RegalCare at Quincy | NH SNF | Quincy (South Quincy) | 71
Facility
71
MA AVG
94
Rank
#182 / 276 |
75.6%
Facility
75.6%
MA AVG
78.3
Rank
#54 / 81 | -3% | 3.67
Facility
3.67
MA AVG
3.93
Rank
#52 / 86 | -28% | -7% | $19.4k
Facility
$19.4k
MA AVG
$76.6k
Rank
#66 / 87 | 33
Facility
33
MA AVG
32.7
Rank
#54 / 86 | 4.7
Facility
4.7
MA AVG
7.2
Rank
#25 / 86 | 3 | 54 | - |
82
Facility
82
MA AVG
53
Rank
#108 / 498 | - | $7.1MFiscal year ending 12/2023
Facility
$7.1MFiscal year ending 12/2023
MA AVG
$17.4M
Rank
#86 / 89 | $3.5MFiscal year ending 12/2023
Facility
$3.5MFiscal year ending 12/2023
MA AVG
$6.5M
Rank
#87 / 89 | 49.7%Fiscal year ending 12/2023
Facility
49.7%Fiscal year ending 12/2023
MA AVG
43.6%
Rank
#15 / 89 | 225522 |
South Cove Manor at Quincy Point Rehabilitation Center is located in Quincy, Massachusetts.
Here are the financial assistance programs available to residents in Massachusetts.
South Cove Manor at Quincy Point Rehabilitation Center is in the Quincy Point neighborhood.
South Cove Manor at Quincy Point Rehabilitation Center has a walk score of 80. Very walkable. Most errands can be accomplished on foot, and many essentials are within a short walk.
South Cove Manor at Quincy Point Rehabilitation Center's occupancy is 93.3%.
No, South Cove Manor at Quincy Point Rehabilitation Center has a no-pet policy.
South Cove Manor at Quincy Point Rehabilitation Center is registered as a non-profit.
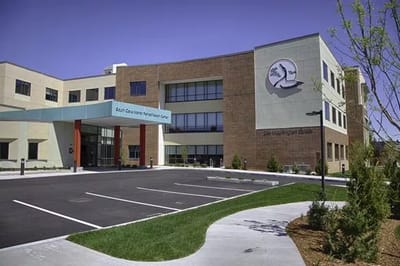
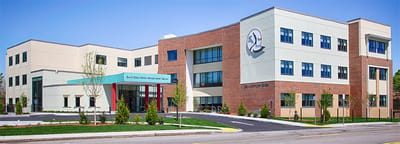
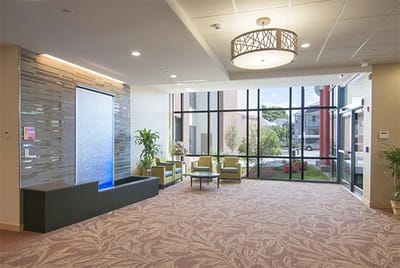
Yes — there are 4 photos of South Cove Manor at Quincy Point Rehabilitation Center in the photo gallery on this page.
South Cove Manor at Quincy Point Rehabilitation Center is located at 288 Washington St, Quincy, MA 02169.
Care Cost Calculator: See Prices in Your Area
Nursing Home Data Explorer
Don’t Wait Too Long: 7 Red Flag Signs Your Parent Needs Assisted Living Now
The True Cost of Assisted Living in 2025 – And How Families Are Paying For It
Understanding Senior Living Costs: Pricing Models, Discounts & Financial Assistance


