Pope Rehabilitation & Skilled Nursing Center
Nursing Home, Hospice Care, Palliative Care & Respite Care · Weymouth, MA
CMS overall rating Info CMS (the Centers for Medicare & Medicaid Services) is the federal agency that rates nursing home quality. Its Overall Rating runs from 1 to 5 stars, combining health inspections, staffing, and quality measures, with inspections weighted most heavily.

Pope Rehabilitation & Skilled Nursing Center

Nursing Home, Hospice Care, Palliative Care & Respite Care · Weymouth, MA
CMS overall rating Info CMS (the Centers for Medicare & Medicaid Services) is the federal agency that rates nursing home quality. Its Overall Rating runs from 1 to 5 stars, combining health inspections, staffing, and quality measures, with inspections weighted most heavily.
Calculator: See prices in your area
Pope Rehabilitation & Skilled Nursing Center accepts Medicare, Medicaid, and private pay.

Overview of Pope Rehabilitation & Skilled Nursing Center

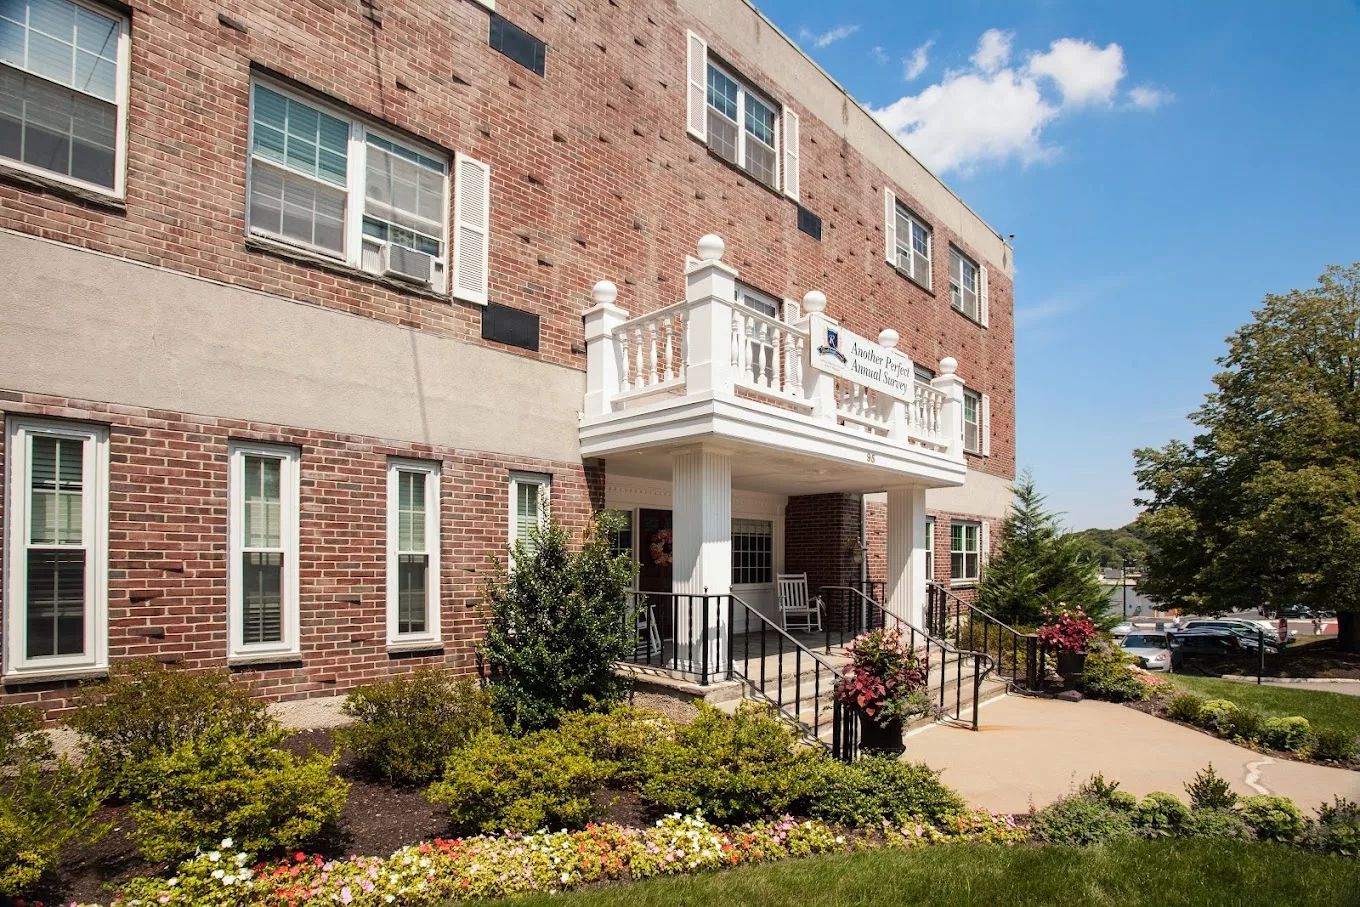
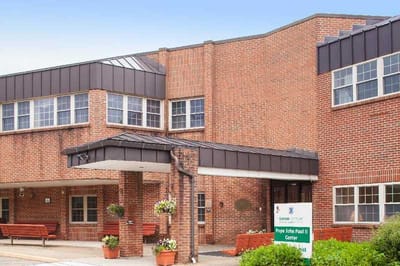
Pope Rehabilitation & Skilled Nursing Center, situated in the heart of Weymouth, Massachusetts, stands as a nurturing sanctuary catering to seniors in need of compassionate care. This family-owned center is dedicated to post-surgery rehabilitation and skilled nursing services, prioritizing an atmosphere that mirrors a home environment. At Pope Rehabilitation & Skilled Nursing Center, the collective spirit thrives, enriched by the diverse experiences and unique contributions of each individual.
Each resident at Pope Rehabilitation & Skilled Nursing Center is esteemed as an invaluable part of their extended family, fostering an environment where individuality is treasured and respected with utmost dignity and empathy. Accommodation options range from private to semi-private rooms, ensuring residents have the liberty to personalize their living spaces with their cherished belongings. When the sunlight pours in, casting a comforting radiance, residents transform their spaces into personal sanctuaries.

Quality ratings

Measured by Centers for Medicare & Medicaid Services (CMS)

Overall rating Info The Overall CMS Rating combines results from health inspections, staffing levels and quality measures. Health inspections carry the most weight. Staffing and quality scores can increase or decrease the final rating based on performance compared to state and national standards.
▲ 38.0% Above MA avg. ▲ 38.0% Above MA avg.MA average: 2.9Click the badge to see the full State ranking.Click here to see the full State ranking.
Health Inspection Info Based on the results of the facility's three most recent standard inspections and any complaint investigations. CMS reviews the number, scope, and severity of deficiencies, with more recent findings weighted more heavily.
▲ 40.5% Above MA avg. ▲ 40.5% Above MA avg.MA average: 2.8Click the badge to see the full State ranking.Click here to see the full State ranking.
Staffing Info Measures average nursing staff hours per resident per day, including Registered Nurses (RNs) and total nursing staff. Ratings are adjusted based on the level of care residents require and are compared to state and national benchmarks.
▲ 33.3% Above MA avg. ▲ 33.3% Above MA avg.MA average: 3.0Click the badge to see the full State ranking.Click here to see the full State ranking.
Quality Measures Info Based on clinical and physical health indicators reported to CMS, such as hospital readmissions, falls, pressure ulcers, and improvements in mobility. These measures reflect how well residents' health needs are being managed.
▲ 25.8% Above MA avg. ▲ 25.8% Above MA avg.MA average: 3.2Click the badge to see the full State ranking.Click here to see the full State ranking.

Staffing hours breakdown

Info Daily nursing hours per resident by staff type, reported to CMS. Higher is generally better — compare this facility to state and national averages to see where staffing stands.

Hours per resident per day — compared to Massachusetts state averages

Total nursing care / resident Info This home is ranked 38th out of 93 homes in Massachusetts for nurse hours. Total adjusted nursing hours per resident per day, combining RN, LPN, and aide time. CMS adjusts this for case-mix so facilities can be fairly compared.
4h 1m per day
Rank #38 / 93Nurse hours — State benchmarkedThis home is ranked 38th out of 93 homes in Massachusetts. Shows adjusted nurse hours per resident per day benchmarked to the Massachusetts average, with a ranking across 93 Massachusetts facilities. More hours mean more direct care. The national average is about 3.5 hrs; below 3.0 is a red flag.Rankings are based only on facilities in Massachusetts that report data for that category. Facilities without available data are excluded from the ranking.Click the rank badge to see the full State ranking.Click here to see the full State ranking.
This facility Massachusetts avg (3h 56m per day)
vs Massachusetts avg
+2%

4 of 6 metrics below state avg

Standout metric Physical Therapist is +130% above state avg
Staff typeHours / Day / Residentvs state avg
Registered Nurse (RN) Info RNs hold the highest nursing license and can assess residents, interpret test results, and direct care plans. More RN hours per day often signals stronger clinical oversight and faster response to health changes. 31m per day ▼ 21% State avg: 39m per day · National avg: 41m per day
LPN / LVN Info Licensed Practical Nurses (LPNs) or Licensed Vocational Nurses (LVNs) deliver routine hands-on care — medication administration, wound dressing, and monitoring vital signs. They work under RN supervision and make up a large share of daily bedside care. 1h 17m per day ▲ 33% State avg: 58m per day · National avg: 52m per day
Nurse Aide Info Certified Nurse Aides (CNAs) provide the most direct day-to-day assistance: bathing, dressing, feeding, and mobility. Nurse aide hours are typically the largest staffing category and directly affect residents' quality of life. 1h 53m per day ▼ 17% State avg: 2h 16m per day · National avg: 2h 21m per day
Weekend Total Nursing Info Combined nursing hours (RN + LPN + Nurse Aide) per resident per day on weekends. Staffing often drops on weekends — this figure reveals whether the facility maintains adequate coverage outside of weekday hours. 3h 10m per day ▼ 8% State avg: 3h 27m per day · National avg: 3h 26m per day
Physical Therapist Info Hours per resident per day provided by licensed Physical Therapists (PTs) or PT Assistants. PT services help residents recover mobility after injury or illness and are especially important for post-acute (short-stay) rehabilitation. 9m per day ▲ 130% State avg: 4m per day · National avg: 4m per day
Weekend RN Info Registered nurse hours specifically on weekends. Facilities sometimes reduce RN presence on Saturdays and Sundays — a low weekend RN figure compared to weekday hours can indicate reduced clinical oversight when most administrative staff are absent. 16m per day ▼ 42% State avg: 28m per day · National avg: 29m per day

Capacity and availability

This home is often near full

Higher occupancy than the Massachusetts average: 82%
Occupancy rate
95.7% Rank #9 / 96Occupancy rate — State benchmarkedThis home is ranked 9th out of 96 homes in Massachusetts. Shows this facility's occupancy rate versus the Massachusetts average, with its Statewide rank out of 96. Higher occupancy signals strong local demand and financial stability.Rankings are based only on facilities in Massachusetts that report data for that category. Facilities without available data are excluded from the ranking.Click the rank badge to see the full State ranking.Click here to see the full State ranking.
Avg. Length of Stay
86 days
Bed community size
123-bed community Rank #55 / 280Bed count — State benchmarkedThis home is ranked 55th out of 280 homes in Massachusetts. Shows this facility's certified or reported bed count compared to other Massachusetts facilities. Larger communities may offer more amenities, programs, and on-site services for residents and families.Rankings are based only on facilities in Massachusetts that report data for that category. Facilities without available data are excluded from the ranking.Click the rank badge to see the full State ranking.Click here to see the full State ranking.
A larger shared setting that may offer more common spaces and organized community services.
Walk Score
Walk Score: 53 / 100 Rank #244 / 499Walk Score — State benchmarkedThis home is ranked 244th out of 499 homes in Massachusetts. Shows how walkable this facility's neighborhood is compared to the average Walk Score across Massachusetts facilities. Higher scores benefit residents, families, and staff.Rankings are based only on facilities in Massachusetts that report data for that category. Facilities without available data are excluded from the ranking.Click the rank badge to see the full State ranking.Click here to see the full State ranking.
Moderately walkable. Some errands can be accomplished on foot, with a mix of nearby amenities.

Contact Pope Rehabilitation & Skilled Nursing Center

Staffing Data

Reporting period: October 1 – December 31, 2025 (Q4 2025). Source: CMS Payroll-Based Journal report.

Total staff 201
Employees 195
Contractors 6
Staff to resident ratio 1.90 : 1
14% more staff per resident than Massachusetts average
Massachusetts average ratio: 1.66 : 1 Massachusetts average ratio: 1.66 : 1See full Massachusetts ranking
Avg staff/day 68
Average shift 7.7 hours
0% compared with Massachusetts average
Massachusetts average: 7.9 hours Massachusetts average shift: 7.9 hoursSee full Massachusetts ranking
Total staff hours (quarter) 47,903

Nursing staff breakdown

Q4 2025 · Oct 1 – Dec 31 More info This data comes from the CMS Payroll-Based Journal report covering October 1 – December 31, 2025.
Registered Nurse

Manages medical care and health needs.

RN Staff Info All 18 RN Staff are full-time employees. No contractors work on this role. 18
Average shift length Info Average shift length. Calculated as total hours divided by days worked and average staff per day. 8 hours
Licensed Practical Nurse

Assists with medical care and medications.

LPN Staff Info All 38 LPN Staff are full-time employees. No contractors work on this role. 38
Average shift length Info Average shift length. Calculated as total hours divided by days worked and average staff per day. 8.3 hours
Certified Nursing Assistant

Helps with daily care and mobility.

CNA Staff Info All 82 CNA Staff are full-time employees. No contractors work on this role. 82
Average shift length Info Average shift length. Calculated as total hours divided by days worked and average staff per day. 7.3 hours

Contractor staffing

Q4 2025 · Oct 1 – Dec 31 More info This data comes from the CMS Payroll-Based Journal report covering October 1 – December 31, 2025.

Total hours from contractors

0.3%

162 contractor hours this quarter

Clinical Nurse Specialist: 3 Medical Director: 2 Occupational Therapy Assistant: 1

Staff by category

Q4 2025 · Oct 1 – Dec 31 More info This data comes from the CMS Payroll-Based Journal report covering October 1 – December 31, 2025.
Certified Nursing Assistant8208219,62292100%7.3
Licensed Practical Nurse3803810,98492100%8.3
Registered Nurse180183,15992100%8
RN Director of Nursing100102,48492100%8.9
Clinical Nurse Specialist6391,7346571%7.9
Respiratory Therapy Technician8081,5998289%6.9
Speech Language Pathologist5051,3498997%7.5
Other Dietary Services Staff5051,34192100%7
Physical Therapy Assistant9091,2969199%6.4
Mental Health Service Worker4041,1236571%7.7
Physical Therapy Aide3031,0007683%8.1
Administrator1015046368%8
Dietitian1014966267%8
Nurse Practitioner1014725964%8
Occupational Therapy Aide1013905459%7.2
Qualified Social Worker3032705054%5.3
Medical Director022481820%2.7
Occupational Therapy Assistant0113478%4.8
82 Certified Nursing Assistant
% of Days 100%
38 Licensed Practical Nurse
% of Days 100%
18 Registered Nurse
% of Days 100%
10 RN Director of Nursing
% of Days 100%
9 Clinical Nurse Specialist
% of Days 71%
8 Respiratory Therapy Technician
% of Days 89%
5 Speech Language Pathologist
% of Days 97%
5 Other Dietary Services Staff
% of Days 100%
9 Physical Therapy Assistant
% of Days 99%
4 Mental Health Service Worker
% of Days 71%
3 Physical Therapy Aide
% of Days 83%
1 Administrator
% of Days 68%
1 Dietitian
% of Days 67%
1 Nurse Practitioner
% of Days 64%
1 Occupational Therapy Aide
% of Days 59%
3 Qualified Social Worker
% of Days 54%
2 Medical Director
% of Days 20%
1 Occupational Therapy Assistant
% of Days 8%

Penalties and fines

Federal penalties imposed by CMS for regulatory violations, including civil money penalties (fines) and denials of payment for new Medicare/Medicaid admissions.

Source: CMS Penalties Database

No penalties in the past 3 years

No civil money penalties or payment denials were reported in the last 3 years.

Quality of care over time

These measures show how residents usually do over time at this home, based on health outcomes and preventive care.

High-risk clinical events score Info A composite score based on pressure ulcers, falls with injury, weight loss, walking ability decline, and activities of daily living decline. 10.7
In line with Massachusetts average

Massachusetts average: 10.2

Functional decline score Info A composite score based on activities of daily living decline, walking ability decline, and incontinence. 22.9
15% worse than Massachusetts average

Massachusetts average: 20.0

Long-stay resident measures
Below average Info CMS star rating based on long-stay quality measure performance. 5 stars = significantly above average, 1 star = significantly below average.
Need for Help with Daily Activities Increased Info Percent of long-stay residents whose need for help with daily activities has increased 20.9%
12% worse than Massachusetts average

Massachusetts average: 18.7%

Walking Ability Worsened Info Percent of long-stay residents whose ability to move independently worsened 21.1%
9% worse than Massachusetts average

Massachusetts average: 19.3%

Low Risk Residents with Bowel/Bladder Incontinence Info Percent of low risk long-stay residents who lose control of their bowels or bladder 26.7%
21% worse than Massachusetts average

Massachusetts average: 22.1%

Falls with Major Injury Info Percent of long-stay residents experiencing one or more falls with major injury 2.4%
33% better than Massachusetts average

Massachusetts average: 3.6%

High Risk Residents with Pressure Ulcers Info Percent of long-stay high risk residents with pressure ulcers 5.6%
20% worse than Massachusetts average

Massachusetts average: 4.7%

Urinary Tract Infection Info Percent of long-stay residents with a urinary tract infection 2.2%
In line with Massachusetts average

Massachusetts average: 2.1%

Lost Too Much Weight Info Percent of long-stay residents who lose too much weight 3.5%
33% better than Massachusetts average

Massachusetts average: 5.2%

Depressive Symptoms Info Percent of long-stay residents who have depressive symptoms 0.6%
94% better than Massachusetts average

Massachusetts average: 10.7%

Antipsychotic Use Info Percent of long-stay residents who received an antipsychotic medication 16.5%
19% better than Massachusetts average

Massachusetts average: 20.3%

Pneumococcal Vaccine Info Percent of long-stay residents assessed and appropriately given the pneumococcal vaccine 95.5%
In line with Massachusetts average

Massachusetts average: 91.9%

Influenza Vaccine Info Percent of long-stay residents assessed and appropriately given the seasonal influenza vaccine 98.9%
In line with Massachusetts average

Massachusetts average: 94.8%

Hospitalizations per 1,000 days Info Number of hospitalizations per 1,000 long-stay resident days. 1.39
25% better than Massachusetts average

Massachusetts average: 1.86

ED visits per 1,000 days Info Number of outpatient emergency department visits per 1,000 long-stay resident days. 0.75
51% better than Massachusetts average

Massachusetts average: 1.54

Short-stay resident measures
Pneumococcal Vaccine Info Percent of short-stay residents assessed and appropriately given the pneumococcal vaccine 75.6%
In line with Massachusetts average

Massachusetts average: 76.7%

Antipsychotic medication increase Info Percent of short-stay residents who newly received an antipsychotic medication 0.4%
71% better than Massachusetts average

Massachusetts average: 1.3%

Influenza Vaccine Info Percent of short-stay residents assessed and appropriately given the seasonal influenza vaccine 78.8%
In line with Massachusetts average

Massachusetts average: 77.7%

Re-hospitalized after SNF stay Info Percentage of short-stay residents who were re-hospitalized after their nursing home admission. 9.5%
63% better than Massachusetts average

Massachusetts average: 25.8%

Emergency department visits Info Percentage of short-stay residents who had an outpatient emergency department visit. 0.0%
100% better than Massachusetts average

Massachusetts average: 11.8%

Breakdown by payment type

Medicare

61% of new residents, usually for short-term rehab.

Typical stay 21 days

Private pay

37% of new residents, often for short stays.

Typical stay 1 - 2 months

Medicaid

2% of new residents, often for long-term daily care.

Typical stay 7 years

Facility Characteristics

Source: CMS Long-Term Care Facility Characteristics (Data as of Jan 2026)

Total residents 106
Medicare
18
17% of residents
Medicaid
59
55.7% of residents
Private pay or other
29
27.4% of residents
Programs & Services
Residents Group

Residents meet regularly to discuss policies, care quality, and activities

Active Resident Council

Organized group of residents that meets regularly to discuss facility policies, quality of life, and activities.

Finances and operations

Based on CMS SNF Cost Report for fiscal year ending in 12/2023.

For-profit
Corporation
Net patient revenue Info Net patient revenue — what the home actually collects for resident care, after contractual allowances, bad debt and discounts are subtracted from its gross charges (CMS cost report, Worksheet G-3). It covers resident care only; money the home earns from other sources is shown separately as "Other income."
$16.1M
Net patient income Info Net patient income: net patient revenue minus the home's total operating expenses. A positive figure means it earns more from resident care than it spends to deliver it; a negative figure means the opposite. It excludes non-operating "other income."
$239.2K
For-profit Corporation
Net patient revenue Info Net patient revenue — what the home actually collects for resident care, after contractual allowances, bad debt and discounts are subtracted from its gross charges (CMS cost report, Worksheet G-3). It covers resident care only; money the home earns from other sources is shown separately as "Other income."
$16.1M Rank #47 / 96Revenue — State benchmarkedThis home is ranked 47th out of 96 homes in Massachusetts. Shows this facility's annual revenue compared to the Massachusetts average. Higher revenue generally means more resources for staffing and capital — read alongside Payroll %.Rankings are based only on facilities in Massachusetts that report data for that category. Facilities without available data are excluded from the ranking.Click the rank badge to see the full State ranking.Click here to see the full State ranking.
Net patient income Info Net patient income: net patient revenue minus the home's total operating expenses. A positive figure means it earns more from resident care than it spends to deliver it; a negative figure means the opposite. It excludes non-operating "other income."
$239.2K
Other income Info Money the home earns outside of resident care — such as investments, grants, rentals and other non-operating sources (CMS cost report, Worksheet G-3). It is tracked separately from net patient revenue: it is not part of that figure, and it is not included in net patient income.
$100.5K
Payroll costs Info Staff salaries plus wage-related costs — benefits such as payroll taxes, health insurance and retirement — from the home's own accounting records (CMS cost report, Worksheet A). Contract or agency labor is counted separately, under other operating costs. Rank #47 / 96Payroll — State benchmarkedThis home is ranked 47th out of 96 homes in Massachusetts. Shows total annual staff payroll benchmarked to the Massachusetts average. Higher payroll investment relative to peers often signals better staffing and less reliance on cheaper contract labor.Rankings are based only on facilities in Massachusetts that report data for that category. Facilities without available data are excluded from the ranking.Click the rank badge to see the full State ranking.Click here to see the full State ranking.
$9.7M 60% of net patient revenue Info Payroll as a share of revenue: staff salaries and wage-related benefits divided by net patient revenue. A higher figure means more of each revenue dollar goes to staff pay. Rank #48 / 96Payroll % — State benchmarkedThis home is ranked 48th out of 96 homes in Massachusetts. Shows payroll as a percentage of revenue versus the Massachusetts average. Well-run Massachusetts facilities typically land around 54–65% — the top third Statewide. Below 25% may signal understaffing or heavy agency use — read with Staffing ratings.Rankings are based only on facilities in Massachusetts that report data for that category. Facilities without available data are excluded from the ranking.Click the rank badge to see the full State ranking.Click here to see the full State ranking.
Other operating costs Info Everything it costs to run the home apart from payroll — food, utilities, supplies, maintenance, contract labor and administration. Calculated as total operating expense minus payroll (staff salaries and wage-related benefits).
$6.2M
Total costs Info The home's total operating expense for the year — all the costs of running it, salaries included (CMS cost report, Worksheet G-3).
$15.9M

Who this home usually serves

TYPE OF STAY

Mostly short-term rehab stays

Most residents typically stay for a few weeks or months before returning home or moving on.

Most new residents arrive under Medicare (61% of admissions), and a typical Medicare stay runs around 21 days.

Admissions
510 total

Coverage residents most often arrive under.

Medicare 61%
Private pay 37%
Medicaid 2%
Discharges
501 total

Coverage residents most often leave under.

Medicare 53%
Private pay 36%
Medicaid 11%

Places of interest near Pope Rehabilitation & Skilled Nursing Center

Address 1.4 miles from city center Info Estimated distance in miles from Weymouth's city center to Pope Rehabilitation & Skilled Nursing Center's address, calculated via Google Maps. — 3.27 miles to nearest hospital (South Shore Hospital)

Calculate Travel Distance to Pope Rehabilitation & Skilled Nursing Center

Add your location

Address

Compare Nursing Homes around Quincy

The information below is reported by the Massachusetts Executive Office of Elder Affairs and Department of Public Health.

4 facilities compared · CMS & MA Dept. of Health data

South Cove Manor at Quincy Point Rehabilitation Center
NH
PC
RC
Quincy (Quincy Point)
141
Facility 141
MA AVG 94
Rank #37 / 280
93.3%
Facility 93.3%
MA AVG 82%
Rank #19 / 96
+14%
3.77
Facility 3.77
MA AVG 3.93
Rank #50 / 93
+44%-4%
$0
Facility $0
MA AVG $76.6k
Rank #1 / 94
30
Facility 30
MA AVG 32.7
Rank #54 / 93
10.0
Facility 10.0
MA AVG 7.2
Rank #80 / 93
-136-
80
Facility 80
MA AVG 53
Rank #119 / 499
Marianne Bowler
$18.1M
Facility $18.1M
MA AVG $17.4M
Rank #53 / 96
$11.7M
Facility $11.7M
MA AVG $6.5M
Rank #25 / 96
64.4%
Facility 64.4%
MA AVG 43.6%
Rank #10 / 96
225514
Pope Rehabilitation & Skilled Nursing Center
NH
HC
PC
RC
Weymouth (Weymouth Landing)
123
Facility 123
MA AVG 94
Rank #55 / 280
95.7%
Facility 95.7%
MA AVG 82%
Rank #9 / 96
+17%
4.01
Facility 4.01
MA AVG 3.93
Rank #38 / 93
-29%+2%
$0
Facility $0
MA AVG $76.6k
Rank #1 / 94
14
Facility 14
MA AVG 32.7
Rank #20 / 93
3.5
Facility 3.5
MA AVG 7.2
Rank #13 / 93
-114-
53
Facility 53
MA AVG 53
Rank #244 / 499
Paul Mahoney
$16.1M
Facility $16.1M
MA AVG $17.4M
Rank #47 / 96
$9.7M
Facility $9.7M
MA AVG $6.5M
Rank #47 / 96
60%
Facility 60%
MA AVG 43.6%
Rank #48 / 96
225309
Alliance Health at Marina Bay
NH
HC
NC
PC
RC
Quincy (Marina Bay)
167
Facility 167
MA AVG 94
Rank #18 / 280
89.8%
Facility 89.8%
MA AVG 82%
Rank #33 / 96
+10%
4.34
Facility 4.34
MA AVG 3.93
Rank #20 / 93
+64%+10%
$9.8k
Facility $9.8k
MA AVG $76.6k
Rank #60 / 94
24
Facility 24
MA AVG 32.7
Rank #44 / 93
6.0
Facility 6.0
MA AVG 7.2
Rank #48 / 93
1150-
13
Facility 13
MA AVG 53
Rank #450 / 499
Cailin Gallego
$22.5M
Facility $22.5M
MA AVG $17.4M
Rank #6 / 96
$12.1M
Facility $12.1M
MA AVG $6.5M
Rank #14 / 96
53.7%
Facility 53.7%
MA AVG 43.6%
Rank #92 / 96
225680
RegalCare at Quincy
NH
Quincy (South Quincy)
71
Facility 71
MA AVG 94
Rank #183 / 280
77.0%
Facility 77.0%
MA AVG 82%
Rank #65 / 96
-6%
3.67
Facility 3.67
MA AVG 3.93
Rank #58 / 93
-28%-7%
$19.4k
Facility $19.4k
MA AVG $76.6k
Rank #72 / 94
33
Facility 33
MA AVG 32.7
Rank #61 / 93
4.7
Facility 4.7
MA AVG 7.2
Rank #29 / 93
354-
82
Facility 82
MA AVG 53
Rank #108 / 499
-
$7.1M
Facility $7.1M
MA AVG $17.4M
Rank #93 / 96
$3.5M
Facility $3.5M
MA AVG $6.5M
Rank #93 / 96
49.7%
Facility 49.7%
MA AVG 43.6%
Rank #15 / 96
225522

Financial Assistance for
Nursing Home in Massachusetts

Pope Rehabilitation & Skilled Nursing Center is located in Weymouth, Massachusetts.
Here are the financial assistance programs available to residents in Massachusetts.

Get Financial aid guidance

Home Care Program

MassHealth Home Care

Age 60+
General Massachusetts resident, at risk of nursing home placement.
Income Limits (2025) ~$1,500/month individual, varies by region
Asset Limits $2,000 individual, excludes home, car
MA

Coordinated through Aging Services Access Points (ASAPs); high demand in urban areas.

Benefits
In-home care (3-5 hours/day) Homemaker services Respite care (up to 14 days/year) Adult day care (~$75/day)

Frail Elder Waiver

Massachusetts Medicaid FE Waiver

Age 65+
General Massachusetts resident, Medicaid-eligible, nursing home-level care need.
Income Limits (2025) ~$2,829/month 300% FBR, individual
Asset Limits $2,000 (individual), $3,000 (couple).
MA

Requires clinical eligibility determination.

Benefits
Personal care (5-7 hours/day) Respite care (240 hours/year) Adult day care (~$75/day) Home health services

Senior Care Options (SCO)

Massachusetts Senior Care Options

Age 65+
General Massachusetts resident, eligible for MassHealth (Medicare optional), nursing home-level care need.
Income Limits (2025) ~$2,829/month (300% FBR, individual); QIT allowed.
Asset Limits $2,000 (individual), $3,000 (couple) (excludes home up to $713,000, car).
MA

Not available in Dukes/Nantucket Counties; multiple SCO providers (e.g., CCA, Tufts).

Benefits
Personal care (5-7 hours/day) Medical care Respite (240 hours/year) Adult

Medicare Savings Program (MSP)

Massachusetts Medicare Savings Program (MassHealth Buy-In)

Age 65+ or disabled
General Massachusetts resident, Medicare Part A/B.
Income Limits (2025) ~$2,510/month (QMB), ~$3,380/month (SLMB), ~$3,598/month (QI)—individual.
Asset Limits $9,430 (individual), $14,130 (couple).
MA

Three tiers; no waitlist; includes Extra Help for Part D.

Benefits
Covers Part B premiums ($174.70/month) Deductibles ($240/year) Copays (~20%)

National Family Caregiver Support Program (NFCSP) Respite

Massachusetts NFCSP Respite Care

Age
General Caregivers of 60+ needing care or 55+ caregivers of others; Massachusetts resident; functional needs (2+ ADLs).
Income Limits (2025) Prioritizes ~$24,980/year (individual); no strict cap.
Asset Limits Not assessed; need-based.
MA

27 ASAPs; prioritizes low-income, rural caregivers.

Benefits
Respite (4-6 hours/week or 5 days/year) Adult day care ($60/day) Caregiver training Supplies (~$500/year)

Prescription Advantage

Massachusetts Prescription Advantage

Age 65+ or disabled
General Massachusetts resident, enrolled in Medicare Part D (or ineligible for Medicare).
Income Limits (2025) No strict limit; copays vary by income ~$24,980-$75,000/year individual
Asset Limits Not assessed.
MA

Supplements Medicare Part D; no enrollment fee for low-income.

Benefits
Covers prescription copays ($5-$40/drug) Fills coverage gaps Catastrophic cost protection ($4,000+ covered)

VA Aid and Attendance (A&A) and Housebound Benefits

Massachusetts VA Aid and Attendance/Housebound

Age 65+ or disabled veteran/spouse
General Massachusetts resident, wartime service, need for ADL help (A&A) or homebound.
Income Limits (2025) Net income < ~$1,984/month (veteran with dependent, A&A); pension offsets income.
Asset Limits ~$155,356 net worth limit
MA

High veteran demand statewide.

Benefits
Cash (~$1,433-$2,642/month veteran, ~$951-$1,318 spouse) for care costs (e.g., in-home, assisted living)

Frequently Asked Questions about Pope Rehabilitation & Skilled Nursing Center

What neighborhood is Pope Rehabilitation & Skilled Nursing Center in?

Pope Rehabilitation & Skilled Nursing Center is in the Weymouth Landing neighborhood.

Is Pope Rehabilitation & Skilled Nursing Center in a walkable area?

Pope Rehabilitation & Skilled Nursing Center has a walk score of 53. Moderately walkable. Some errands can be accomplished on foot, with a mix of nearby amenities.

What is the occupancy rate at Pope Rehabilitation & Skilled Nursing Center?

Pope Rehabilitation & Skilled Nursing Center's occupancy is 95.7%.

Does Pope Rehabilitation & Skilled Nursing Center operate as a for-profit or non-profit?

Pope Rehabilitation & Skilled Nursing Center is registered as a for-profit.

Are there photos of Pope Rehabilitation & Skilled Nursing Center?

Yes — there are 4 photos of Pope Rehabilitation & Skilled Nursing Center in the photo gallery on this page.

What is the address of Pope Rehabilitation & Skilled Nursing Center?

Pope Rehabilitation & Skilled Nursing Center is located at 140 Webb St, Weymouth, MA 02188.

What is the phone number of Pope Rehabilitation & Skilled Nursing Center?

(781) 335-4352 will put you in contact with the team at Pope Rehabilitation & Skilled Nursing Center.

Guides for Better Senior Living

Care Cost Calculator: See Prices in Your Area

Nursing Home Data Explorer

Don’t Wait Too Long: 7 Red Flag Signs Your Parent Needs Assisted Living Now

The True Cost of Assisted Living in 2025 – And How Families Are Paying For It

Understanding Senior Living Costs: Pricing Models, Discounts & Financial Assistance