


Total health inspections
2
Missouri average 6.6
Last Health inspection on Nov 2024
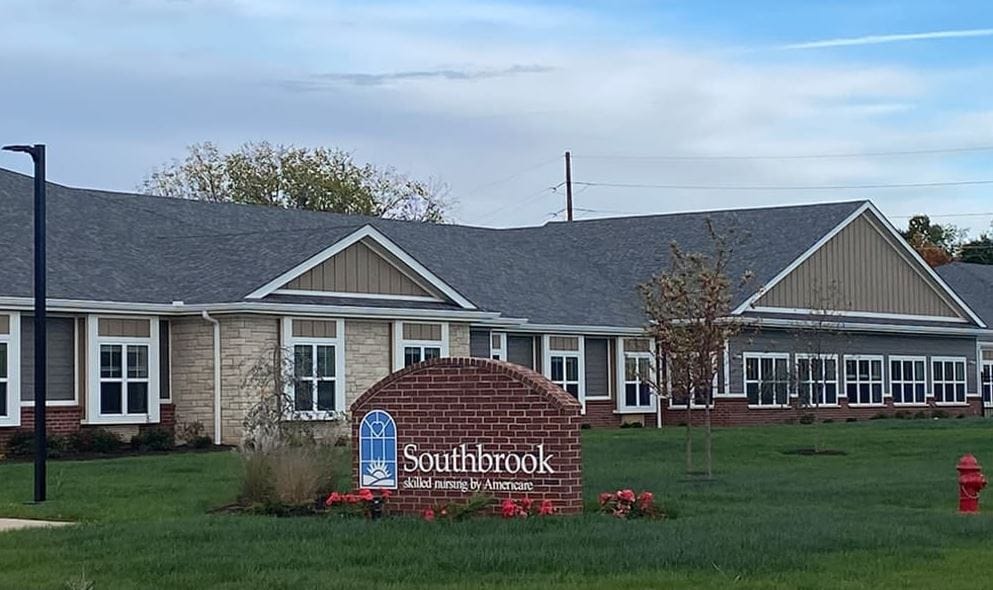

Peacefully settled in Farmington, MO, Southbrook is a trusted senior living community that offers a wide range of care options, including skilled nursing, rehabilitation, hospice care, and home health care. Residents can comfortably rest in their comfortable and spacious studios apartments. A skilled nursing team works hard to provide residents with compassionate and comprehensive care services that help them regain their strengths and maintain independence.
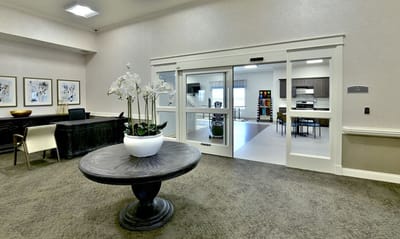
Offering a person-centered approach to care and access to various therapies, including physical, occupational, and speech therapy, the community ensures residents are able to recover quickly. Residents’ healing journey is made vibrant and comfortable with a wide range of amenities and activities offered by the community. Delicious and nutritious meals are also provided to guarantee residents receive the sustenance and nourishment they need to stay healthy.
| Staff type | Hours / Day / Resident | vs state avg |
|---|---|---|
|
Registered Nurse (RN)
| 32m per day | ▲ 13% State avg: 28m per day · National avg: 41m per day |
|
LPN / LVN
| 55m per day | ▲ 34% State avg: 41m per day · National avg: 52m per day |
|
Nurse Aide
| 2h 33m per day | ▲ 9% State avg: 2h 20m per day · National avg: 2h 21m per day |
|
Weekend Total Nursing
| 3h 33m per day | ▲ 16% State avg: 3h 3m per day · National avg: 3h 26m per day |
|
Physical Therapist
| 2m per day | ▼ 7% State avg: 2m per day · National avg: 4m per day |
|
Weekend RN
| 34m per day | ▲ 72% State avg: 20m per day · National avg: 29m per day |
In Missouri, the Department of Health and Senior Services, Division of Regulation and Licensure performs the inspections and unannounced surveys required for all long-term care providers.
Deficiencies
| This Facility | MO Average | vs. MO Avg |
|---|---|---|---|
|
Total deficiencies
| 14 | 35 | This facility has 60% fewer total deficiencies than a typical Missouri nursing home (14 vs. MO avg 35).↓ 60% better |
|
Deficiencies per year
| 3.5 | 8.8 | This facility has 60% fewer deficiencies per year than a typical Missouri nursing home (3.5 vs. MO avg 8.8).↓ 60% better |
Missouri average 6.6
Last Health inspection on Nov 2024
Missouri average 36.5
Missouri average 5.67
Health citations are formal notices following inspections when they fail to comply with safety and care standards.
All 14 citations resulted from standard inspections.
Missouri average: 0.7
Missouri average: 1
Reporting period: October 1 – December 31, 2025 (Q4 2025). Source: CMS Payroll-Based Journal report.
Manages medical care and health needs.
Assists with medical care and medications.
Helps with daily care and mobility.
Total hours from contractors
2,779 contractor hours this quarter
| Certified Nursing Assistant | 67 | 0 | 67 | 17,561 | 92 | 100% | 8.8 |
| Licensed Practical Nurse | 18 | 0 | 18 | 6,567 | 92 | 100% | 8.7 |
| Registered Nurse | 14 | 0 | 14 | 3,910 | 92 | 100% | 9.2 |
| Medication Aide/Technician | 13 | 0 | 13 | 3,397 | 92 | 100% | 7.6 |
| Dental Services Staff | 2 | 0 | 2 | 996 | 65 | 71% | 8.5 |
| RN Director of Nursing | 2 | 0 | 2 | 935 | 72 | 78% | 7.7 |
| Speech Language Pathologist | 0 | 7 | 7 | 901 | 76 | 83% | 5.2 |
| Other Dietary Services Staff | 4 | 0 | 4 | 869 | 68 | 74% | 8 |
| Physical Therapy Aide | 0 | 5 | 5 | 629 | 71 | 77% | 5.8 |
| Administrator | 1 | 0 | 1 | 464 | 58 | 63% | 8 |
| Nurse Practitioner | 1 | 0 | 1 | 440 | 55 | 60% | 8 |
| Therapeutic Recreation Specialist | 0 | 1 | 1 | 421 | 63 | 68% | 6.7 |
| Qualified Social Worker | 0 | 3 | 3 | 308 | 66 | 72% | 4.4 |
| Respiratory Therapy Technician | 0 | 4 | 4 | 255 | 62 | 67% | 3.9 |
| Physical Therapy Assistant | 0 | 4 | 4 | 254 | 66 | 72% | 3.4 |
| Physical Therapist | 2 | 0 | 2 | 90 | 6 | 7% | 7.5 |
| Occupational Therapy Assistant | 0 | 1 | 1 | 11 | 1 | 1% | 10.5 |
Federal penalties imposed by CMS for regulatory violations, including civil money penalties (fines) and denials of payment for new Medicare/Medicaid admissions.
Source: CMS Penalties Database
No penalties in the past 3 years
No civil money penalties or payment denials were reported in the last 3 years.
These measures show how residents usually do over time at this home, based on health outcomes and preventive care.
Missouri average: 10.9
Missouri average: 19.5
Missouri average: 19.8%
Missouri average: 20.6%
Missouri average: 18.1%
Missouri average: 4.0%
Missouri average: 5.0%
Missouri average: 2.7%
Missouri average: 5.6%
Missouri average: 12.8%
Missouri average: 22.0%
Missouri average: 85.2%
Missouri average: 90.9%
Missouri average: 2.08
Missouri average: 2.35
Missouri average: 66.6%
Missouri average: 2.2%
Missouri average: 63.5%
Missouri average: 25.3%
Missouri average: 13.4%
Missouri average: 0.8%
Missouri average: 53.7%
Missouri average: 50.6%
Quality measures are calculated from Minimum Data Set (MDS) assessments. For most measures, lower percentages indicate better care quality.
49% of new residents, usually for short-term rehab.
36% of new residents, often for short stays.
15% of new residents, often for long-term daily care.
Source: CMS Long-Term Care Facility Characteristics (Data as of Jan 2026)
Residents meet regularly to discuss policies, care quality, and activities
State-approved Nurse Aide Training and Competency Evaluation Program on-site
Organized group of residents that meets regularly to discuss facility policies, quality of life, and activities.
Data sourced from CMS Long-Term Care Facility Characteristics quarterly report. Payer mix reflects the current resident census by primary payment source.
Historical financial and operational data for Southbrook from 2011–2021, based on CMS SNF Cost Reports.
Key figures below are for fiscal year ending in 12/2021 — the home's most recent complete cost report, an older period than most facilities report.
Based on the home's most recent complete CMS SNF Cost Report — fiscal year ending in 12/2021. This is an older period than most facilities report, so compare with that in mind.
Pets Allowed
Room Sizes: 280 / 355 sq. ft.
Housing Options: Private Room / Semi-Private Room
Building Type: Single-story
Transportation Services
Fitness and Recreation
Most residents typically stay for a few weeks or months before returning home or moving on.
New residents most often arrive under Medicare (49% of admissions), and a typical Medicare stay runs around 27 days.
Coverage residents most often arrive under.
Coverage residents most often leave under.
![]() 1.6 miles from city center
1.6 miles from city center
![]() Estimated distance in miles from Farmington's city center to Southbrook's address, calculated via Google Maps.
Estimated distance in miles from Farmington's city center to Southbrook's address, calculated via Google Maps.
Add your location
The information below is reported by the Missouri Department of Health and Senior Services, Division of Regulation and Licensure.
| St Francois Manor | NH HOS SNF | Farmington | 158
Facility
158
MO AVG
96
Rank
#43 / 452 | - | - | 5.97
Facility
5.97
MO AVG
3.74
Rank
#6 / 280 | -34% | +60% | $0
Facility
$0
MO AVG
$76.9k
Rank
#1 / 286 | 19
Facility
19
MO AVG
36.5
Rank
#71 / 284 | 3.8
Facility
3.8
MO AVG
5.7
Rank
#66 / 284 | - | 17 | A+ |
77
Facility
77
MO AVG
45
Rank
#53 / 563 | Jennifer Simpson | $5.2MFiscal year ending 12/2023
Facility
$5.2MFiscal year ending 12/2023
MO AVG
$8.4M
Rank
#193 / 290 | $2.6MFiscal year ending 12/2023
Facility
$2.6MFiscal year ending 12/2023
MO AVG
$3.3M
Rank
#151 / 290 | 50.8%Fiscal year ending 12/2023
Facility
50.8%Fiscal year ending 12/2023
MO AVG
45.6%
Rank
#47 / 290 | 265674 | ||||
| Camelot Nursing & Rehab Center | NH AL SNF | Farmington (Sleepy Hollow Run) | 97
Facility
97
MO AVG
96
Rank
#196 / 452 |
73.1%
Facility
73.1%
MO AVG
65.1
Rank
#161 / 420 | +12% | 3.29
Facility
3.29
MO AVG
3.74
Rank
#204 / 280 | -16% | -12% | $0
Facility
$0
MO AVG
$76.9k
Rank
#1 / 286 | 12
Facility
12
MO AVG
36.5
Rank
#29 / 284 | 4.0
Facility
4.0
MO AVG
5.7
Rank
#76 / 284 | - | 71 | - |
55
Facility
55
MO AVG
45
Rank
#189 / 563 | Camelot Snf Investments, LLC | $7.4MFiscal year ending 12/2023
Facility
$7.4MFiscal year ending 12/2023
MO AVG
$8.4M
Rank
#88 / 290 | $3.4MFiscal year ending 12/2023
Facility
$3.4MFiscal year ending 12/2023
MO AVG
$3.3M
Rank
#142 / 290 | 46.4%Fiscal year ending 12/2023
Facility
46.4%Fiscal year ending 12/2023
MO AVG
45.6%
Rank
#243 / 290 | 265348 | ||||
| Farmington Presbyterian Manor | NH AL IL MC SNF | Farmington | 90
Facility
90
MO AVG
96
Rank
#226 / 452 |
74.4%
Facility
74.4%
MO AVG
65.1
Rank
#148 / 420 | +14% | 4.58
Facility
4.58
MO AVG
3.74
Rank
#42 / 280 | +49% | +23% | $12.6k
Facility
$12.6k
MO AVG
$76.9k
Rank
#176 / 286 | 9
Facility
9
MO AVG
36.5
Rank
#10 / 284 | 2.3
Facility
2.3
MO AVG
5.7
Rank
#11 / 284 | 1 | 67 | A+ |
66
Facility
66
MO AVG
45
Rank
#113 / 563 | Jane Hull | $8.7MFiscal year ending 06/2024
Facility
$8.7MFiscal year ending 06/2024
MO AVG
$8.4M
Rank
#74 / 290 | $4.7MFiscal year ending 06/2024
Facility
$4.7MFiscal year ending 06/2024
MO AVG
$3.3M
Rank
#51 / 290 | 53.6%Fiscal year ending 06/2024
Facility
53.6%Fiscal year ending 06/2024
MO AVG
45.6%
Rank
#76 / 290 | 265583 | ||||
| Southbrook | NH HOS SNF | Farmington | 104
Facility
104
MO AVG
96
Rank
#165 / 452 |
83.7%
Facility
83.7%
MO AVG
65.1
Rank
#82 / 420 | +29% | 4.33
Facility
4.33
MO AVG
3.74
Rank
#66 / 280 | +22% | +16% | $0
Facility
$0
MO AVG
$76.9k
Rank
#1 / 286 | 14
Facility
14
MO AVG
36.5
Rank
#40 / 284 | 7.0
Facility
7.0
MO AVG
5.7
Rank
#220 / 284 | - | 87 | - |
39
Facility
39
MO AVG
45
Rank
#329 / 563 | - | $5.1M*Fiscal year ending 12/2021These figures are from this home's most recent complete cost report — an older period than most facilities report. Compare with that in mind.
Facility
$5.1M*Fiscal year ending 12/2021These figures are from this home's most recent complete cost report — an older period than most facilities report. Compare with that in mind.
MO AVG
$8.4M
Rank
#204 / 290 | $3.1M*Fiscal year ending 12/2021These figures are from this home's most recent complete cost report — an older period than most facilities report. Compare with that in mind.
Facility
$3.1M*Fiscal year ending 12/2021These figures are from this home's most recent complete cost report — an older period than most facilities report. Compare with that in mind.
MO AVG
$3.3M
Rank
#182 / 290 | 60.3%*Fiscal year ending 12/2021These figures are from this home's most recent complete cost report — an older period than most facilities report. Compare with that in mind.
Facility
60.3%*Fiscal year ending 12/2021These figures are from this home's most recent complete cost report — an older period than most facilities report. Compare with that in mind.
MO AVG
45.6%
Rank
#94 / 290 | 265389 | ||||
| Community Manor | NH HOS MC PC RC SNF | Farmington | 99
Facility
99
MO AVG
96
Rank
#185 / 452 |
98.0%
Facility
98.0%
MO AVG
65.1
Rank
#7 / 420 | +51% | 2.68
Facility
2.68
MO AVG
3.74
Rank
#251 / 280 | +4% | -28% | $0
Facility
$0
MO AVG
$76.9k
Rank
#1 / 286 | 28
Facility
28
MO AVG
36.5
Rank
#124 / 284 | 7.0
Facility
7.0
MO AVG
5.7
Rank
#220 / 284 | - | 97 | - |
77
Facility
77
MO AVG
45
Rank
#53 / 563 | Miss Ouri Nursing & Rehab, LLC | $8.1MFiscal year ending 12/2023
Facility
$8.1MFiscal year ending 12/2023
MO AVG
$8.4M
Rank
#95 / 290 | $4.1MFiscal year ending 12/2023
Facility
$4.1MFiscal year ending 12/2023
MO AVG
$3.3M
Rank
#79 / 290 | 50.7%Fiscal year ending 12/2023
Facility
50.7%Fiscal year ending 12/2023
MO AVG
45.6%
Rank
#94 / 290 | 265798 |
Southbrook is located in Farmington, Missouri.
Here are the financial assistance programs available to residents in Missouri.
Southbrook has a walk score of 39. Somewhat walkable. A few nearby services may be reachable on foot, but most trips require transportation.
Southbrook's occupancy is 85.6%.
Yes, Southbrook allows residents to bring their pets.
Southbrook is registered as a for-profit in MO.
Yes — there are 4 photos of Southbrook in the photo gallery on this page.
Southbrook is located at 1101 Hazel Ln, Farmington, MO 63640.
(573) 756-6658 will put you in contact with the team at Southbrook.
Care Cost Calculator: See Prices in Your Area
Nursing Home Data Explorer
Don’t Wait Too Long: 7 Red Flag Signs Your Parent Needs Assisted Living Now
The True Cost of Assisted Living in 2025 – And How Families Are Paying For It
Understanding Senior Living Costs: Pricing Models, Discounts & Financial Assistance


