The Neighborhoods by TigerPlace
Nursing Home & Hospice Care · Columbia, MO
CMS overall rating Info CMS (the Centers for Medicare & Medicaid Services) is the federal agency that rates nursing home quality. Its Overall Rating runs from 1 to 5 stars, combining health inspections, staffing, and quality measures, with inspections weighted most heavily.

The Neighborhoods by TigerPlace

Nursing Home & Hospice Care · Columbia, MO
CMS overall rating Info CMS (the Centers for Medicare & Medicaid Services) is the federal agency that rates nursing home quality. Its Overall Rating runs from 1 to 5 stars, combining health inspections, staffing, and quality measures, with inspections weighted most heavily.
Calculator: See prices in your area
The Neighborhoods by TigerPlace accepts Medicare, Medicaid, and private pay.

Overview of The Neighborhoods by Tigerplace

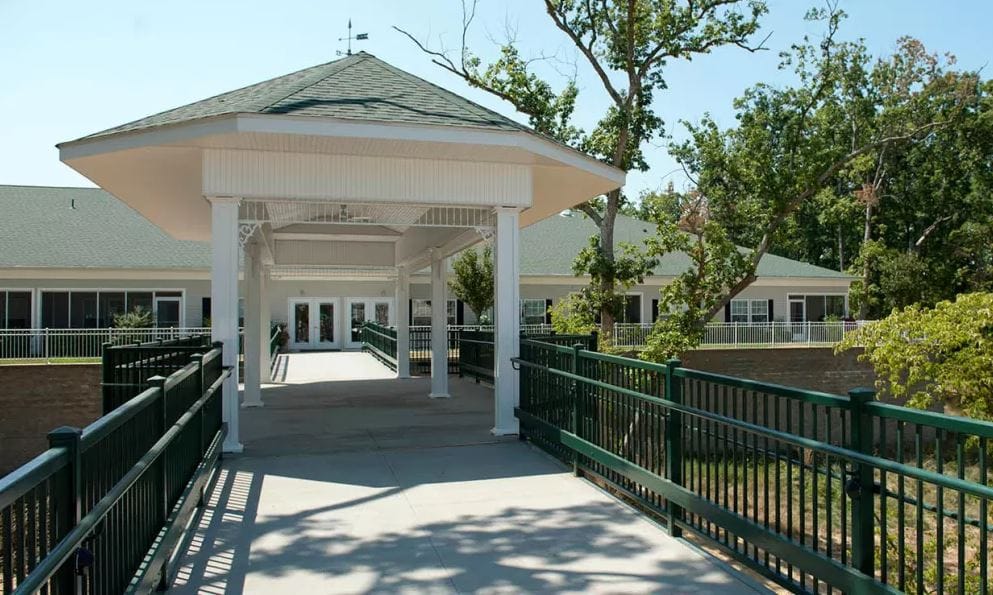
Revisit old passions at The Neighborhoods by Tigerplace, a remarkable senior living community based in Columbia, MO, offering home care, rehabilitation, skilled nursing, and hospice care. With its comprehensive services, residents are guaranteed to age in place with the comfort of knowing that all of their needs in different phases of their retirement will be met. With physical, occupational and speech therapy, residents are able to maintain or regain their strengths and mobility to continue living a fulfilling and active life.

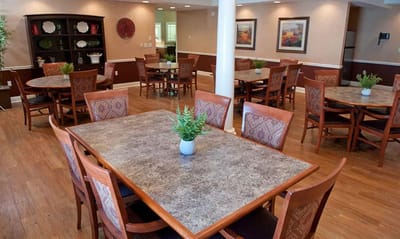
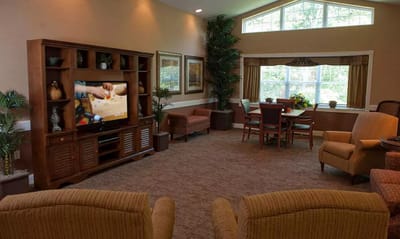
Stay active, connected and engaged with a plethora of interesting activities, events, and wellness programs offered by the community. The community also provides healthy, delicious meals crafted to give residents the sustenance and nutrition they need to stay energized and healthy. Pets are also warmly welcomed by the community to provide residents the therapeutic value that pets provide, fostering a sense of companionship and purpose from having the responsibility of taking care of another being.

Quality ratings

Measured by Centers for Medicare & Medicaid Services (CMS)

Overall rating Info The Overall CMS Rating combines results from health inspections, staffing levels and quality measures. Health inspections carry the most weight. Staffing and quality scores can increase or decrease the final rating based on performance compared to state and national standards.
▼ 19.5% Below MO avg. ▼ 19.5% Below MO avg.MO average: 2.5Click the badge to see the full State ranking.Click here to see the full State ranking.
Health Inspection Info Based on the results of the facility's three most recent standard inspections and any complaint investigations. CMS reviews the number, scope, and severity of deficiencies, with more recent findings weighted more heavily.
▼ 27.9% Below MO avg. ▼ 27.9% Below MO avg.MO average: 2.8Click the badge to see the full State ranking.Click here to see the full State ranking.
Staffing Info Measures average nursing staff hours per resident per day, including Registered Nurses (RNs) and total nursing staff. Ratings are adjusted based on the level of care residents require and are compared to state and national benchmarks.
▲ 37.1% Above MO avg. ▲ 37.1% Above MO avg.MO average: 2.2Click the badge to see the full State ranking.Click here to see the full State ranking.
Quality Measures Info Based on clinical and physical health indicators reported to CMS, such as hospital readmissions, falls, pressure ulcers, and improvements in mobility. These measures reflect how well residents' health needs are being managed.
▼ 24.7% Below MO avg. ▼ 24.7% Below MO avg.MO average: 2.7Click the badge to see the full State ranking.Click here to see the full State ranking.

Staffing hours breakdown

Info Daily nursing hours per resident by staff type, reported to CMS. Higher is generally better — compare this facility to state and national averages to see where staffing stands.

Hours per resident per day — compared to Missouri state averages

Total nursing care / resident Info This home is ranked 35th out of 282 homes in Missouri for nurse hours. Total adjusted nursing hours per resident per day, combining RN, LPN, and aide time. CMS adjusts this for case-mix so facilities can be fairly compared.
4h 56m per day
Rank #35 / 282Nurse hours — State benchmarkedThis home is ranked 35th out of 282 homes in Missouri. Shows adjusted nurse hours per resident per day benchmarked to the Missouri average, with a ranking across 282 Missouri facilities. More hours mean more direct care. The national average is about 3.5 hrs; below 3.0 is a red flag.Rankings are based only on facilities in Missouri that report data for that category. Facilities without available data are excluded from the ranking.Click the rank badge to see the full State ranking.Click here to see the full State ranking.
This facility Missouri avg (3h 44m per day)
vs Missouri avg
+32%

3 of 6 metrics below state avg

Standout metric LPN / LVN is +97% above state avg
Staff typeHours / Day / Residentvs state avg
Registered Nurse (RN) Info RNs hold the highest nursing license and can assess residents, interpret test results, and direct care plans. More RN hours per day often signals stronger clinical oversight and faster response to health changes. 19m per day ▼ 30% State avg: 28m per day · National avg: 41m per day
LPN / LVN Info Licensed Practical Nurses (LPNs) or Licensed Vocational Nurses (LVNs) deliver routine hands-on care — medication administration, wound dressing, and monitoring vital signs. They work under RN supervision and make up a large share of daily bedside care. 1h 21m per day ▲ 97% State avg: 41m per day · National avg: 52m per day
Nurse Aide Info Certified Nurse Aides (CNAs) provide the most direct day-to-day assistance: bathing, dressing, feeding, and mobility. Nurse aide hours are typically the largest staffing category and directly affect residents' quality of life. 2h 55m per day ▲ 25% State avg: 2h 20m per day · National avg: 2h 21m per day
Weekend Total Nursing Info Combined nursing hours (RN + LPN + Nurse Aide) per resident per day on weekends. Staffing often drops on weekends — this figure reveals whether the facility maintains adequate coverage outside of weekday hours. 4h 9m per day ▲ 36% State avg: 3h 3m per day · National avg: 3h 26m per day
Physical Therapist Info Hours per resident per day provided by licensed Physical Therapists (PTs) or PT Assistants. PT services help residents recover mobility after injury or illness and are especially important for post-acute (short-stay) rehabilitation. 2m per day ▼ 12% State avg: 2m per day · National avg: 4m per day
Weekend RN Info Registered nurse hours specifically on weekends. Facilities sometimes reduce RN presence on Saturdays and Sundays — a low weekend RN figure compared to weekday hours can indicate reduced clinical oversight when most administrative staff are absent. 9m per day ▼ 54% State avg: 20m per day · National avg: 29m per day

Capacity and availability

This home usually has availability

Higher occupancy than the Missouri average: 66.6%
Occupancy rate
72.7% Rank #168 / 434Occupancy rate — State benchmarkedThis home is ranked 168th out of 434 homes in Missouri. Shows this facility's occupancy rate versus the Missouri average, with its Statewide rank out of 434. Higher occupancy signals strong local demand and financial stability.Rankings are based only on facilities in Missouri that report data for that category. Facilities without available data are excluded from the ranking.Click the rank badge to see the full State ranking.Click here to see the full State ranking.
Avg. Length of Stay
75 days
Bed community size
120-bed community Rank #89 / 454Bed count — State benchmarkedThis home is ranked 89th out of 454 homes in Missouri. Shows this facility's certified or reported bed count compared to other Missouri facilities. Larger communities may offer more amenities, programs, and on-site services for residents and families.Rankings are based only on facilities in Missouri that report data for that category. Facilities without available data are excluded from the ranking.Click the rank badge to see the full State ranking.Click here to see the full State ranking.
A larger shared setting that may offer more common spaces and organized community services.
Walk Score
Walk Score: 20 / 100 Rank #451 / 563Walk Score — State benchmarkedThis home is ranked 451st out of 563 homes in Missouri. Shows how walkable this facility's neighborhood is compared to the average Walk Score across Missouri facilities. Higher scores benefit residents, families, and staff.Rankings are based only on facilities in Missouri that report data for that category. Facilities without available data are excluded from the ranking.Click the rank badge to see the full State ranking.Click here to see the full State ranking.
Car-dependent. Most errands require a car, with limited nearby walkable options.

Contact The Neighborhoods by TigerPlace

Staffing Data

Reporting period: October 1 – December 31, 2025 (Q4 2025). Source: CMS Payroll-Based Journal report.

Total staff 288
Employees 100
Contractors 188
Staff to resident ratio 3.16 : 1
87% more staff per resident than Missouri average
Missouri average ratio: 1.69 : 1 Missouri average ratio: 1.69 : 1See full Missouri ranking
Avg staff/day 61
Average shift 9.2 hours
14% better than Missouri average
Missouri average: 8.1 hours Missouri average shift: 8.1 hoursSee full Missouri ranking
Total staff hours (quarter) 51,484

Nursing staff breakdown

Q4 2025 · Oct 1 – Dec 31 More info This data comes from the CMS Payroll-Based Journal report covering October 1 – December 31, 2025.
Registered Nurse

Manages medical care and health needs.

RN Staff Info All 5 RN Staff are full-time employees. No contractors work on this role. 5
Average shift length Info Average shift length. Calculated as total hours divided by days worked and average staff per day. 10.2 hours
Licensed Practical Nurse

Assists with medical care and medications.

LPN Staff Info 64 total: 15 full-time employees and 49 contractors. 64
Average shift length Info Average shift length. Calculated as total hours divided by days worked and average staff per day. 10.6 hours
Certified Nursing Assistant

Helps with daily care and mobility.

CNA Staff Info 139 total: 46 full-time employees and 93 contractors. 139
Average shift length Info Average shift length. Calculated as total hours divided by days worked and average staff per day. 9.2 hours

Contractor staffing

Q4 2025 · Oct 1 – Dec 31 More info This data comes from the CMS Payroll-Based Journal report covering October 1 – December 31, 2025.

Total hours from contractors

27.2%

14,013 contractor hours this quarter

Certified Nursing Assistant: 93 Licensed Practical Nurse: 49 Medication Aide/Technician: 23 Speech Language Pathologist: 6 Physical Therapy Aide: 5 Physical Therapy Assistant: 5 Respiratory Therapy Technician: 3 Occupational Therapy Aide: 1 Nurse Practitioner: 1 Qualified Social Worker: 1 Occupational Therapy Assistant: 1

Staff by category

Q4 2025 · Oct 1 – Dec 31 More info This data comes from the CMS Payroll-Based Journal report covering October 1 – December 31, 2025.
Certified Nursing Assistant469313920,24692100%9.2
Licensed Practical Nurse1549649,94892100%10.6
Physical Therapist160167,27192100%9.3
Medication Aide/Technician623294,07992100%10.4
Registered Nurse5051,6288289%10.2
Speech Language Pathologist0661,4458592%6.9
RN Director of Nursing4041,3917885%9.3
Physical Therapy Aide0551,2396975%6.9
Mental Health Service Worker2021,0696571%8.8
Nurse Practitioner1125766470%8
Clinical Nurse Specialist1015307582%7.1
Administrator1014886166%8
Nurse Aide in Training1012904145%7.1
Occupational Therapy Aide0112614549%5.8
Respiratory Therapy Technician0332465762%4.3
Physical Therapy Assistant0552435459%4.2
Other Dietary Services Staff1012253336%6.8
Qualified Social Worker0111934751%4.1
Dental Services Staff101831213%6.9
Occupational Therapy Assistant0113233%10.8
139 Certified Nursing Assistant
% of Days 100%
64 Licensed Practical Nurse
% of Days 100%
16 Physical Therapist
% of Days 100%
29 Medication Aide/Technician
% of Days 100%
5 Registered Nurse
% of Days 89%
6 Speech Language Pathologist
% of Days 92%
4 RN Director of Nursing
% of Days 85%
5 Physical Therapy Aide
% of Days 75%
2 Mental Health Service Worker
% of Days 71%
2 Nurse Practitioner
% of Days 70%
1 Clinical Nurse Specialist
% of Days 82%
1 Administrator
% of Days 66%
1 Nurse Aide in Training
% of Days 45%
1 Occupational Therapy Aide
% of Days 49%
3 Respiratory Therapy Technician
% of Days 62%
5 Physical Therapy Assistant
% of Days 59%
1 Other Dietary Services Staff
% of Days 36%
1 Qualified Social Worker
% of Days 51%
1 Dental Services Staff
% of Days 13%
1 Occupational Therapy Assistant
% of Days 3%

Penalties and fines

Federal penalties imposed by CMS for regulatory violations, including civil money penalties (fines) and denials of payment for new Medicare/Medicaid admissions.

Source: CMS Penalties Database

No penalties in the past 3 years

No civil money penalties or payment denials were reported in the last 3 years.

Quality of care over time

These measures show how residents usually do over time at this home, based on health outcomes and preventive care.

High-risk clinical events score Info A composite score based on pressure ulcers, falls with injury, weight loss, walking ability decline, and activities of daily living decline. 9.7
11% better than Missouri average

Missouri average: 10.9

Functional decline score Info A composite score based on activities of daily living decline, walking ability decline, and incontinence. 19.5
In line with Missouri average

Missouri average: 19.5

Long-stay resident measures
Below average Missouri avg: 2.7 Info CMS star rating based on long-stay quality measure performance. 5 stars = significantly above average, 1 star = significantly below average.
Need for Help with Daily Activities Increased Info Percent of long-stay residents whose need for help with daily activities has increased 10.4%
47% better than Missouri average

Missouri average: 19.8%

Walking Ability Worsened Info Percent of long-stay residents whose ability to move independently worsened 21.4%
In line with Missouri average

Missouri average: 20.6%

Low Risk Residents with Bowel/Bladder Incontinence Info Percent of low risk long-stay residents who lose control of their bowels or bladder 26.8%
48% worse than Missouri average

Missouri average: 18.1%

Falls with Major Injury Info Percent of long-stay residents experiencing one or more falls with major injury 2.0%
52% better than Missouri average

Missouri average: 4.0%

High Risk Residents with Pressure Ulcers Info Percent of long-stay high risk residents with pressure ulcers 8.0%
60% worse than Missouri average

Missouri average: 5.0%

Urinary Tract Infection Info Percent of long-stay residents with a urinary tract infection 3.2%
17% worse than Missouri average

Missouri average: 2.7%

Lost Too Much Weight Info Percent of long-stay residents who lose too much weight 6.8%
22% worse than Missouri average

Missouri average: 5.6%

Depressive Symptoms Info Percent of long-stay residents who have depressive symptoms 0.0%
100% better than Missouri average

Missouri average: 12.8%

Antipsychotic Use Info Percent of long-stay residents who received an antipsychotic medication 26.7%
21% worse than Missouri average

Missouri average: 22.0%

Pneumococcal Vaccine Info Percent of long-stay residents assessed and appropriately given the pneumococcal vaccine 99.2%
16% better than Missouri average

Missouri average: 85.2%

Influenza Vaccine Info Percent of long-stay residents assessed and appropriately given the seasonal influenza vaccine 83.6%
8% worse than Missouri average

Missouri average: 90.9%

Hospitalizations per 1,000 days Info Number of hospitalizations per 1,000 long-stay resident days. 2.91
40% worse than Missouri average

Missouri average: 2.08

ED visits per 1,000 days Info Number of outpatient emergency department visits per 1,000 long-stay resident days. 1.23
48% better than Missouri average

Missouri average: 2.35

Short-stay resident measures
Average Missouri avg: 2.1 Info CMS star rating based on short-stay quality measure performance. 5 stars = much above average, 1 star = much below average.
Pneumococcal Vaccine Info Percent of short-stay residents assessed and appropriately given the pneumococcal vaccine 91.2%
37% better than Missouri average

Missouri average: 66.6%

Antipsychotic medication increase Info Percent of short-stay residents who newly received an antipsychotic medication 1.4%
37% better than Missouri average

Missouri average: 2.2%

Influenza Vaccine Info Percent of short-stay residents assessed and appropriately given the seasonal influenza vaccine 36.7%
42% worse than Missouri average

Missouri average: 63.5%

Re-hospitalized after SNF stay Info Percentage of short-stay residents who were re-hospitalized after their nursing home admission. 29.6%
17% worse than Missouri average

Missouri average: 25.3%

Emergency department visits Info Percentage of short-stay residents who had an outpatient emergency department visit. 17.7%
32% worse than Missouri average

Missouri average: 13.4%

Falls with major injury Info Percentage of SNF residents who experience falls with major injury during their stay. 0.0%
100% better than Missouri average

Missouri average: 0.8%

Ability to care for self at discharge Info Percentage of residents at or above expected ability to care for themselves at discharge. 59.2%
10% better than Missouri average

Missouri average: 53.7%

Successful return to home or community Info Rate of successful return to home or community from a skilled nursing facility. 66.6%
32% better than Missouri average

Missouri average: 50.6%

Breakdown by payment type

Medicare

46% of new residents, usually for short-term rehab.

Typical stay 26 days

Private pay

52% of new residents, often for short stays.

Typical stay 3 months

Medicaid

1% of new residents, often for long-term daily care.

Typical stay 4 - 5 years

Facility Characteristics

Source: CMS Long-Term Care Facility Characteristics (Data as of Jan 2026)

Total residents 91
Medicare
19
20.9% of residents
Medicaid
22
24.2% of residents
Private pay or other
50
54.9% of residents
Programs & Services
Residents Group

Residents meet regularly to discuss policies, care quality, and activities

Nurse Aide Training

State-approved Nurse Aide Training and Competency Evaluation Program on-site

Clinical Research

Conducts clinical research trials to develop and test new treatments

CCRC

Part of a Continuing Care Retirement Community offering multiple care levels

Active Resident Council

Organized group of residents that meets regularly to discuss facility policies, quality of life, and activities.

Finances and operations

Based on CMS SNF Cost Report for fiscal year ending in 12/2023.

For-profit
Corporation
Net patient revenue Info Net patient revenue — what the home actually collects for resident care, after contractual allowances, bad debt and discounts are subtracted from its gross charges (CMS cost report, Worksheet G-3). It covers resident care only; money the home earns from other sources is shown separately as "Other income."
$12.5M
Net patient income Info Net patient income: net patient revenue minus the home's total operating expenses. A positive figure means it earns more from resident care than it spends to deliver it; a negative figure means the opposite. It excludes non-operating "other income."
$386.1K
For-profit Corporation
Net patient revenue Info Net patient revenue — what the home actually collects for resident care, after contractual allowances, bad debt and discounts are subtracted from its gross charges (CMS cost report, Worksheet G-3). It covers resident care only; money the home earns from other sources is shown separately as "Other income."
$12.5M Rank #58 / 292Revenue — State benchmarkedThis home is ranked 58th out of 292 homes in Missouri. Shows this facility's annual revenue compared to the Missouri average. Higher revenue generally means more resources for staffing and capital — read alongside Payroll %.Rankings are based only on facilities in Missouri that report data for that category. Facilities without available data are excluded from the ranking.Click the rank badge to see the full State ranking.Click here to see the full State ranking.
Net patient income Info Net patient income: net patient revenue minus the home's total operating expenses. A positive figure means it earns more from resident care than it spends to deliver it; a negative figure means the opposite. It excludes non-operating "other income."
$386.1K
Other income Info Money the home earns outside of resident care — such as investments, grants, rentals and other non-operating sources (CMS cost report, Worksheet G-3). It is tracked separately from net patient revenue: it is not part of that figure, and it is not included in net patient income.
$1.3K
Payroll costs Info Staff salaries plus wage-related costs — benefits such as payroll taxes, health insurance and retirement — from the home's own accounting records (CMS cost report, Worksheet A). Contract or agency labor is counted separately, under other operating costs. Rank #58 / 292Payroll — State benchmarkedThis home is ranked 58th out of 292 homes in Missouri. Shows total annual staff payroll benchmarked to the Missouri average. Higher payroll investment relative to peers often signals better staffing and less reliance on cheaper contract labor.Rankings are based only on facilities in Missouri that report data for that category. Facilities without available data are excluded from the ranking.Click the rank badge to see the full State ranking.Click here to see the full State ranking.
$6.0M 48.1% of net patient revenue Info Payroll as a share of revenue: staff salaries and wage-related benefits divided by net patient revenue. A higher figure means more of each revenue dollar goes to staff pay. Rank #198 / 292Payroll % — State benchmarkedThis home is ranked 198th out of 292 homes in Missouri. Shows payroll as a percentage of revenue versus the Missouri average. Well-run Missouri facilities typically land around 60–71% — the top third Statewide. Below 25% may signal understaffing or heavy agency use — read with Staffing ratings.Rankings are based only on facilities in Missouri that report data for that category. Facilities without available data are excluded from the ranking.Click the rank badge to see the full State ranking.Click here to see the full State ranking.
Other operating costs Info Everything it costs to run the home apart from payroll — food, utilities, supplies, maintenance, contract labor and administration. Calculated as total operating expense minus payroll (staff salaries and wage-related benefits).
$6.1M
Total costs Info The home's total operating expense for the year — all the costs of running it, salaries included (CMS cost report, Worksheet G-3).
$12.1M

What does this home offer?

Pets allowed icon
Pets allowed icon

Pets Allowed

Room sizes icon
Room sizes icon

Room Sizes: 220 / 265 sq. ft.

Housing options icon

Housing Options: Studio

Building type icon
Building type icon

Building Type: Single-story

Transportation services icon

Transportation Services

Fitness and recreation icon

Fitness and Recreation

Who this home usually serves

TYPE OF STAY

Mix of rehab and long-term care

This home supports both short-term rehab and long-term care, with residents staying for a wide range of durations.

Most new residents arrive under private pay (52% of admissions), and a typical private pay stay runs around 3 months.

Admissions
425 total

Coverage residents most often arrive under.

Medicare 46%
Private pay 52%
Medicaid 1%
Discharges
423 total

Coverage residents most often leave under.

Medicare 40%
Private pay 55%
Medicaid 5%

Places of interest near The Neighborhoods by TigerPlace

Address 4.5 miles from city center Info Estimated distance in miles from Columbia's city center to The Neighborhoods by TigerPlace's address, calculated via Google Maps.

Calculate Travel Distance to The Neighborhoods by TigerPlace

Add your location

Address

Compare Nursing Homes around Columbia

The information below is reported by the Missouri Department of Health and Senior Services, Division of Regulation and Licensure.

4 facilities compared · CMS & MO Dept. of Health data

Columbia Post Acute
NH
Columbia
70
Facility 70
MO AVG 97
Rank #305 / 454
95.7%
Facility 95.7%
MO AVG 66.6%
Rank #16 / 434
+44%
3.58
Facility 3.58
MO AVG 3.74
Rank #161 / 282
+49%-4%
$0
Facility $0
MO AVG $76.9k
Rank #1 / 289
13
Facility 13
MO AVG 36.5
Rank #34 / 287
3.3
Facility 3.3
MO AVG 5.7
Rank #34 / 287
165-
98
Facility 98
MO AVG 45
Rank #1 / 563
Mainstreeidence Developments LLC
$12.8M
Facility $12.8M
MO AVG $8.4M
Rank #8 / 292
$6.5M
Facility $6.5M
MO AVG $3.3M
Rank #43 / 292
51%
Facility 51%
MO AVG 45.6%
Rank #288 / 292
265868
Heritage Hall
NH
HC
Centralia
60
Facility 60
MO AVG 97
Rank #343 / 454
59.8%
Facility 59.8%
MO AVG 66.6%
Rank #278 / 434
-10%
3.30
Facility 3.30
MO AVG 3.74
Rank #206 / 282
-23%-12%
$0
Facility $0
MO AVG $76.9k
Rank #1 / 289
7
Facility 7
MO AVG 36.5
Rank #7 / 287
1.8
Facility 1.8
MO AVG 5.7
Rank #5 / 287
-42-
30
Facility 30
MO AVG 45
Rank #386 / 563
Christina Redmond
$3.7M
Facility $3.7M
MO AVG $8.4M
Rank #256 / 292
$2.0M
Facility $2.0M
MO AVG $3.3M
Rank #253 / 292
54.4%
Facility 54.4%
MO AVG 45.6%
Rank #148 / 292
265385
The Neighborhoods by TigerPlace
NH
HC
Columbia
120
Facility 120
MO AVG 97
Rank #89 / 454
72.7%
Facility 72.7%
MO AVG 66.6%
Rank #168 / 434
+9%
4.93
Facility 4.93
MO AVG 3.74
Rank #35 / 282
-78%+32%
$85.1k
Facility $85.1k
MO AVG $76.9k
Rank #259 / 289
28
Facility 28
MO AVG 36.5
Rank #125 / 287
4.0
Facility 4.0
MO AVG 5.7
Rank #77 / 287
492-
20
Facility 20
MO AVG 45
Rank #451 / 563
Lisa Byergo
$12.5M
Facility $12.5M
MO AVG $8.4M
Rank #58 / 292
$6.0M
Facility $6.0M
MO AVG $3.3M
Rank #58 / 292
48.1%
Facility 48.1%
MO AVG 45.6%
Rank #198 / 292
265840
The Villa at Blue Ridge
NH
HC
Columbia
97
Facility 97
MO AVG 97
Rank #197 / 454
86.6%
Facility 86.6%
MO AVG 66.6%
Rank #66 / 434
+30%
4.71
Facility 4.71
MO AVG 3.74
Rank #41 / 282
-45%+26%
$0
Facility $0
MO AVG $76.9k
Rank #1 / 289
29
Facility 29
MO AVG 36.5
Rank #133 / 287
4.1
Facility 4.1
MO AVG 5.7
Rank #90 / 287
189A+
98
Facility 98
MO AVG 45
Rank #1 / 563
Karin Borning
$5.1M
Facility $5.1M
MO AVG $8.4M
Rank #179 / 292
$2.8M
Facility $2.8M
MO AVG $3.3M
Rank #119 / 292
55.2%
Facility 55.2%
MO AVG 45.6%
Rank #23 / 292
265251

Financial Assistance for
Nursing Home in Missouri

The Neighborhoods by TigerPlace is located in Columbia, Missouri.
Here are the financial assistance programs available to residents in Missouri.

Get Financial aid guidance

Aged and Disabled Waiver

Missouri Medicaid A&D Waiver

Age 65+ or disabled
General Missouri resident, Medicaid- eligible, nursing home-level care need.
Income Limits (2025) ~$2,829/month 300% FBR, individual
Asset Limits $2,000 (individual), $3,000 (couple).
MO

Rural access prioritized.

Benefits
Personal care (5-7 hours/day) Respite (240 hours/year) Adult day care (~$65/day) Home health services

Missouri Supplemental Nursing Care (SNC)

MO SNC

Age 65+
General Missouri resident, in approved facility.
Income Limits ~$1,215/month individual
Asset Limits $2,000 individual
MO

Supplements SSI; facility-based only.

Benefits
Monthly cash payment (~$156-$292/month) for care costs

Structured Family Caregiving Waiver (SFCW)

Missouri Structured Family Caregiving Waiver

Age 65+
General Missouri resident, MO HealthNet-eligible, NFLOC, dementia diagnosis, live with caregiver.
Income Limits (2025) ~$2,901/month (300% FBR, individual); QIT required.
Asset Limits $5,909.25 (individual), $11,818.45 (couple).
MO

Caregiver must be family; small program size.

Benefits
Cash stipend ($1,000-$1,500/month) to family caregiver Respite Training Supplies ($500/year)

MO HealthNet Aged, Blind, and Disabled (ABD)

Missouri MO HealthNet ABD

Age 65+ or disabled
General Missouri resident, MO HealthNet-eligible, needs help with 1+ ADL.
Income Limits (2025) ~$1,690/month (individual, projected); spenddown allowed.
Asset Limits $5,909.25 (individual), $11,818.45 (couple).
MO

Less intensive than waivers; statewide access.

Benefits
Personal care (2-4 hours/day) Homemaker services Limited respite Medical equipment

Medicare Savings Program (MSP)

Missouri Medicare Savings Program

Age 65+ or disabled
General Missouri resident, Medicare Part A/B.
Income Limits (2025) ~$2,510/month (QMB), ~$3,380/month (SLMB), ~$3,598/month (QI)—individual.
Asset Limits $9,430 (individual), $14,130 (couple).
MO

Three tiers; no waitlist; includes Extra Help for Part D.

Benefits
Covers Part B premiums ($174.70/month) Deductibles ($240/year) Copays (~20%)

Missouri Caregiver Program (Customized Caregiver Training & Relief)

Missouri Caregiver Program

Age
General Caregivers of 60+ with dementia, Missouri resident, functional needs (2+ ADLs).
Income Limits (2025) No strict cap; prioritizes low-income ~$24,980/year individual
Asset Limits Not assessed; need-based.
MO

Administered via AAAs and Alzheimer’s Association; rural focus.

Benefits
Respite (4-6 hours/week) Training Assistive tech ($500/year) Supplies

VA Aid and Attendance (A&A) and Housebound Benefits

Missouri VA Aid and Attendance/Housebound

Age 65+ or disabled veteran/spouse
General Missouri resident, wartime service, need for ADL help (A&A) or homebound.
Income Limits (2025) Net income < ~$1,984/month (veteran with dependent, A&A); pension offsets income.
Asset Limits ~$155,356 net worth limit
MO

High veteran demand in rural/urban areas.

Benefits
Cash (~$1,433-$2,642/month veteran, ~$951-$1,318 spouse) for care costs (e.g., in-home, assisted living)

Frequently Asked Questions about The Neighborhoods by TigerPlace

Is The Neighborhoods by TigerPlace in a walkable area?

The Neighborhoods by TigerPlace has a walk score of 20. Car-dependent. Most errands require a car, with limited nearby walkable options.

What is the occupancy rate at The Neighborhoods by TigerPlace?

The Neighborhoods by TigerPlace's occupancy is 72.7%.

Does The Neighborhoods by TigerPlace operate as a for-profit or non-profit?

The Neighborhoods by TigerPlace is registered as a for-profit.

Are there photos of The Neighborhoods by TigerPlace?

Yes — there are 4 photos of The Neighborhoods by TigerPlace in the photo gallery on this page.

What is the address of The Neighborhoods by TigerPlace?

The Neighborhoods by TigerPlace is located at 3003 Falling Leaf Ct, Columbia, MO 65201.

What is the phone number of The Neighborhoods by TigerPlace?

(573) 256-4620 will put you in contact with the team at The Neighborhoods by TigerPlace.

Is The Neighborhoods by TigerPlace Medicare or Medicaid certified?

Yes — The Neighborhoods by TigerPlace is a CMS-certified provider of Medicare and Medicaid.

Guides for Better Senior Living

Care Cost Calculator: See Prices in Your Area

Nursing Home Data Explorer

Don’t Wait Too Long: 7 Red Flag Signs Your Parent Needs Assisted Living Now

The True Cost of Assisted Living in 2025 – And How Families Are Paying For It

Understanding Senior Living Costs: Pricing Models, Discounts & Financial Assistance