Spokane Veterans Home
Nursing Home & Assisted Living · Spokane, WA
CMS overall rating Info CMS (the Centers for Medicare & Medicaid Services) is the federal agency that rates nursing home quality. Its Overall Rating runs from 1 to 5 stars, combining health inspections, staffing, and quality measures, with inspections weighted most heavily.

Spokane Veterans Home

Nursing Home & Assisted Living · Spokane, WA
CMS overall rating Info CMS (the Centers for Medicare & Medicaid Services) is the federal agency that rates nursing home quality. Its Overall Rating runs from 1 to 5 stars, combining health inspections, staffing, and quality measures, with inspections weighted most heavily.
Calculator: See prices in your area
Spokane Veterans Home accepts Medicare, Medicaid, and private pay.

Overview of Spokane Veterans Home

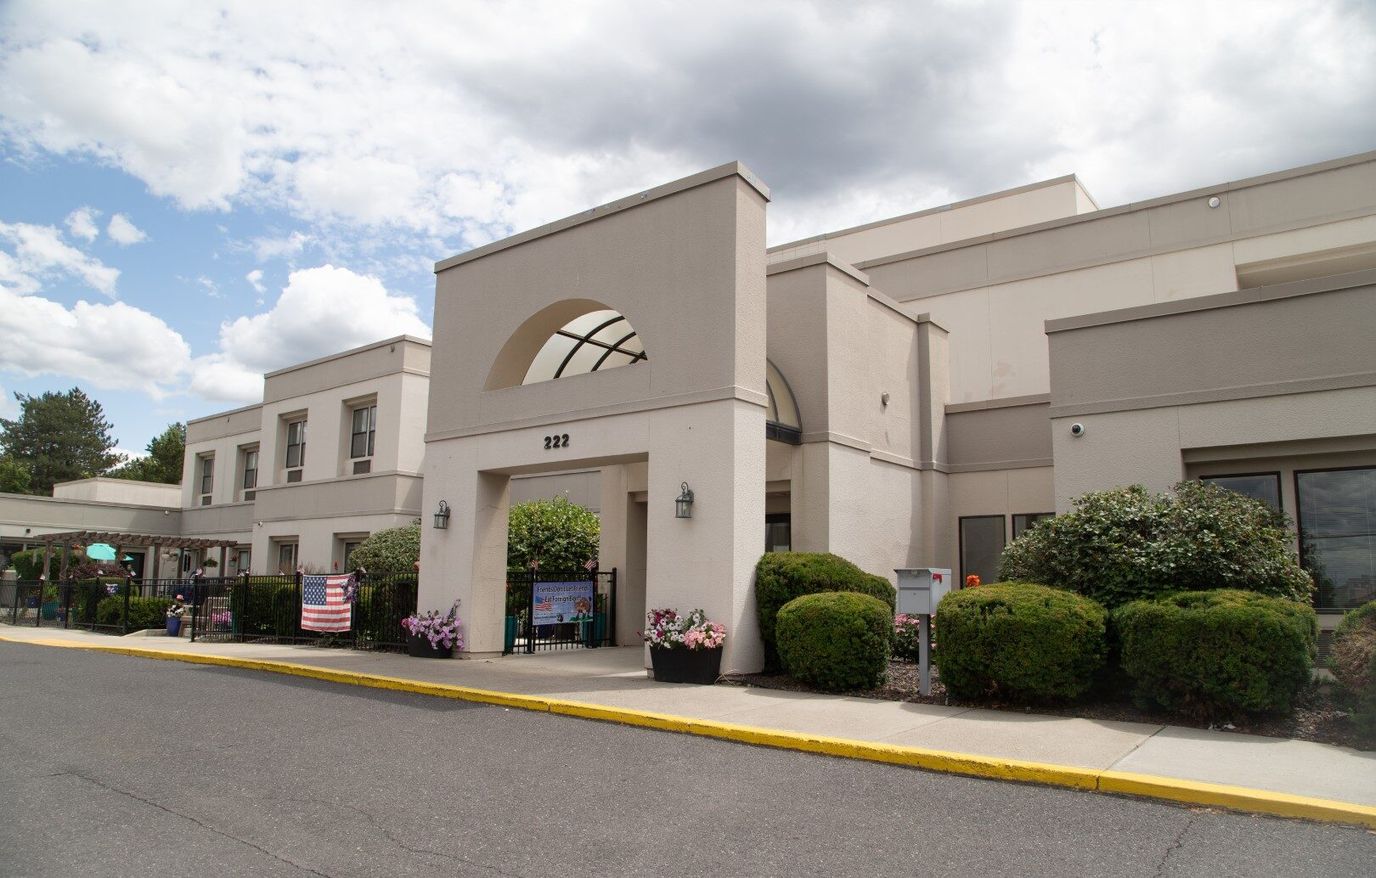
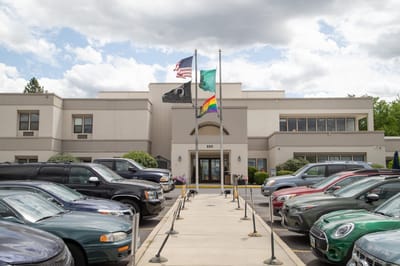
Experience a better quality of life at Spokane Veterans Home, a dedicated community in Spokane, WA, offering assisted living. Focusing on Veterans’ welfare, the community provides top-tier care tailored to their unique needs 24/7. Here, residents enjoy a hassle-free lifestyle with housekeeping and laundry services.

Residents enjoy a variety of exciting events and enriching programs that aim to keep them active and socially connected. The community also provides physical and occupational therapy to improve residents’ living experiences. Delicious and well-balanced meals are available for residents’ dietary needs and preferences. The community’s nurturing and welcoming environment creates the ideal setting for residents to thrive in retirement.

(509) 344-5770

Quality ratings

Measured by Centers for Medicare & Medicaid Services (CMS)

Overall rating Info The Overall CMS Rating combines results from health inspections, staffing levels and quality measures. Health inspections carry the most weight. Staffing and quality scores can increase or decrease the final rating based on performance compared to state and national standards.
▲ 55.0% Above WA avg. ▲ 55.0% Above WA avg.WA average: 3.2Click the badge to see the full State ranking.Click here to see the full State ranking.
Health Inspection Info Based on the results of the facility's three most recent standard inspections and any complaint investigations. CMS reviews the number, scope, and severity of deficiencies, with more recent findings weighted more heavily.
▲ 42.1% Above WA avg. ▲ 42.1% Above WA avg.WA average: 2.8Click the badge to see the full State ranking.Click here to see the full State ranking.
Staffing Info Measures average nursing staff hours per resident per day, including Registered Nurses (RNs) and total nursing staff. Ratings are adjusted based on the level of care residents require and are compared to state and national benchmarks.
▲ 46.1% Above WA avg. ▲ 46.1% Above WA avg.WA average: 3.4Click the badge to see the full State ranking.Click here to see the full State ranking.
Quality Measures Info Based on clinical and physical health indicators reported to CMS, such as hospital readmissions, falls, pressure ulcers, and improvements in mobility. These measures reflect how well residents' health needs are being managed.
▲ 27.2% Above WA avg. ▲ 27.2% Above WA avg.WA average: 3.9Click the badge to see the full State ranking.Click here to see the full State ranking.

Staffing hours breakdown

Info Daily nursing hours per resident by staff type, reported to CMS. Higher is generally better — compare this facility to state and national averages to see where staffing stands.

Hours per resident per day — compared to Washington state averages

Total nursing care / resident Info This home is ranked 38th out of 90 homes in Washington for nurse hours. Total adjusted nursing hours per resident per day, combining RN, LPN, and aide time. CMS adjusts this for case-mix so facilities can be fairly compared.
4h 10m per day
Rank #38 / 90Nurse hours — State benchmarkedThis home is ranked 38th out of 90 homes in Washington. Shows adjusted nurse hours per resident per day benchmarked to the Washington average, with a ranking across 90 Washington facilities. More hours mean more direct care. The national average is about 3.5 hrs; below 3.0 is a red flag.Rankings are based only on facilities in Washington that report data for that category. Facilities without available data are excluded from the ranking.Click the rank badge to see the full State ranking.Click here to see the full State ranking.
This facility Washington avg (4h 13m per day)
vs Washington avg
-2%

4 of 6 metrics below state avg

Standout metric Weekend RN is +97% above state avg
Staff typeHours / Day / Residentvs state avg
Registered Nurse (RN) Info RNs hold the highest nursing license and can assess residents, interpret test results, and direct care plans. More RN hours per day often signals stronger clinical oversight and faster response to health changes. 1h 30m per day ▲ 70% State avg: 53m per day · National avg: 41m per day
LPN / LVN Info Licensed Practical Nurses (LPNs) or Licensed Vocational Nurses (LVNs) deliver routine hands-on care — medication administration, wound dressing, and monitoring vital signs. They work under RN supervision and make up a large share of daily bedside care. 1m per day ▼ 97% State avg: 49m per day · National avg: 52m per day
Nurse Aide Info Certified Nurse Aides (CNAs) provide the most direct day-to-day assistance: bathing, dressing, feeding, and mobility. Nurse aide hours are typically the largest staffing category and directly affect residents' quality of life. 2h 31m per day ▼ 6% State avg: 2h 41m per day · National avg: 2h 20m per day
Weekend Total Nursing Info Combined nursing hours (RN + LPN + Nurse Aide) per resident per day on weekends. Staffing often drops on weekends — this figure reveals whether the facility maintains adequate coverage outside of weekday hours. 3h 35m per day ▼ 5% State avg: 3h 47m per day · National avg: 3h 26m per day
Physical Therapist Info Hours per resident per day provided by licensed Physical Therapists (PTs) or PT Assistants. PT services help residents recover mobility after injury or illness and are especially important for post-acute (short-stay) rehabilitation. 3m per day ▼ 38% State avg: 5m per day · National avg: 4m per day
Weekend RN Info Registered nurse hours specifically on weekends. Facilities sometimes reduce RN presence on Saturdays and Sundays — a low weekend RN figure compared to weekday hours can indicate reduced clinical oversight when most administrative staff are absent. 1h 15m per day ▲ 97% State avg: 38m per day · National avg: 28m per day

Capacity and availability

This home usually has limited availability

Higher occupancy than the Washington average: 72.5%
Occupancy rate
93.3% Rank #33 / 310Occupancy rate — State benchmarkedThis home is ranked 33rd out of 310 homes in Washington. Shows this facility's occupancy rate versus the Washington average, with its Statewide rank out of 310. Higher occupancy signals strong local demand and financial stability.Rankings are based only on facilities in Washington that report data for that category. Facilities without available data are excluded from the ranking.Click the rank badge to see the full State ranking.Click here to see the full State ranking.
Avg. Length of Stay
308 days
Bed community size
100-bed community Rank #93 / 366Bed count — State benchmarkedThis home is ranked 93rd out of 366 homes in Washington. Shows this facility's certified or reported bed count compared to other Washington facilities. Larger communities may offer more amenities, programs, and on-site services for residents and families.Rankings are based only on facilities in Washington that report data for that category. Facilities without available data are excluded from the ranking.Click the rank badge to see the full State ranking.Click here to see the full State ranking.
A larger shared setting that may offer more common spaces and organized community services.
Walk Score
Walk Score: 77 / 100 Rank #97 / 628Walk Score — State benchmarkedThis home is ranked 97th out of 628 homes in Washington. Shows how walkable this facility's neighborhood is compared to the average Walk Score across Washington facilities. Higher scores benefit residents, families, and staff.Rankings are based only on facilities in Washington that report data for that category. Facilities without available data are excluded from the ranking.Click the rank badge to see the full State ranking.Click here to see the full State ranking.
Very walkable. Most errands can be accomplished on foot, and many essentials are within a short walk.

Contact Spokane Veterans Home

Staffing Data

Reporting period: October 1 – December 31, 2025 (Q4 2025). Source: CMS Payroll-Based Journal report.

Total staff 128
Employees 117
Contractors 11
Staff to resident ratio 1.28 : 1
31% fewer staff per resident than Washington average
Washington average ratio: 1.86 : 1 Washington average ratio: 1.86 : 1See full Washington ranking
Avg staff/day 58
Average shift 8.3 hours
0% compared with Washington average
Washington average: 8.1 hours Washington average shift: 8.1 hoursSee full Washington ranking
Total staff hours (quarter) 44,520

Nursing staff breakdown

Q4 2025 · Oct 1 – Dec 31 More info This data comes from the CMS Payroll-Based Journal report covering October 1 – December 31, 2025.
Registered Nurse

Manages medical care and health needs.

RN Staff Info All 33 RN Staff are full-time employees. No contractors work on this role. 33
Average shift length Info Average shift length. Calculated as total hours divided by days worked and average staff per day. 8.6 hours
Licensed Practical Nurse

Assists with medical care and medications.

LPN Staff Info All 1 LPN Staff are full-time employees. No contractors work on this role. 1
Average shift length Info Average shift length. Calculated as total hours divided by days worked and average staff per day. 7.7 hours
Certified Nursing Assistant

Helps with daily care and mobility.

CNA Staff Info All 59 CNA Staff are full-time employees. No contractors work on this role. 59
Average shift length Info Average shift length. Calculated as total hours divided by days worked and average staff per day. 8.6 hours

Contractor staffing

Q4 2025 · Oct 1 – Dec 31 More info This data comes from the CMS Payroll-Based Journal report covering October 1 – December 31, 2025.

Total hours from contractors

6.4%

2,836 contractor hours this quarter

Speech Language Pathologist: 3 Physical Therapy Aide: 2 Physical Therapy Assistant: 2 Medical Director: 1 Respiratory Therapy Technician: 1 Qualified Social Worker: 1 Other Physician: 1

Staff by category

Q4 2025 · Oct 1 – Dec 31 More info This data comes from the CMS Payroll-Based Journal report covering October 1 – December 31, 2025.
Certified Nursing Assistant5905922,50092100%8.6
Registered Nurse330339,05292100%8.6
Clinical Nurse Specialist9093,96992100%8.4
Occupational Therapy Assistant5052,1376368%9.2
Dietitian3031,2148896%8
Mental Health Service Worker2026486267%8
Administrator1015046267%8.1
Other Dietary Services Staff1014966267%8
Speech Language Pathologist0334806470%7.1
Physical Therapy Aide0224766368%7.3
Respiratory Therapy Technician0114645863%8
Qualified Social Worker0114465964%7.6
Occupational Therapy Aide1014085155%8
Nurse Practitioner1013844953%7.8
Other Physician0113726267%6
Medical Director0113123942%8
Physical Therapy Assistant0222866368%4.5
Licensed Practical Nurse1012162830%7.7
Dental Services Staff1011562022%7.8
59 Certified Nursing Assistant
% of Days 100%
33 Registered Nurse
% of Days 100%
9 Clinical Nurse Specialist
% of Days 100%
5 Occupational Therapy Assistant
% of Days 68%
3 Dietitian
% of Days 96%
2 Mental Health Service Worker
% of Days 67%
1 Administrator
% of Days 67%
1 Other Dietary Services Staff
% of Days 67%
3 Speech Language Pathologist
% of Days 70%
2 Physical Therapy Aide
% of Days 68%
1 Respiratory Therapy Technician
% of Days 63%
1 Qualified Social Worker
% of Days 64%
1 Occupational Therapy Aide
% of Days 55%
1 Nurse Practitioner
% of Days 53%
1 Other Physician
% of Days 67%
1 Medical Director
% of Days 42%
2 Physical Therapy Assistant
% of Days 68%
1 Licensed Practical Nurse
% of Days 30%
1 Dental Services Staff
% of Days 22%

Penalties and fines

Federal penalties imposed by CMS for regulatory violations, including civil money penalties (fines) and denials of payment for new Medicare/Medicaid admissions.

Source: CMS Penalties Database

No penalties in the past 3 years

No civil money penalties or payment denials were reported in the last 3 years.

Quality of care over time

These measures show how residents usually do over time at this home, based on health outcomes and preventive care.

High-risk clinical events score Info A composite score based on pressure ulcers, falls with injury, weight loss, walking ability decline, and activities of daily living decline. 9.2
8% better than Washington average

Washington average: 10.0

Functional decline score Info A composite score based on activities of daily living decline, walking ability decline, and incontinence. 16.6
20% better than Washington average

Washington average: 20.9

Long-stay resident measures
Significantly above average Washington avg: 3.6 Info CMS star rating based on long-stay quality measure performance. 5 stars = significantly above average, 1 star = significantly below average.
Need for Help with Daily Activities Increased Info Percent of long-stay residents whose need for help with daily activities has increased 15.5%
6% better than Washington average

Washington average: 16.4%

Walking Ability Worsened Info Percent of long-stay residents whose ability to move independently worsened 18.1%
17% better than Washington average

Washington average: 21.8%

Low Risk Residents with Bowel/Bladder Incontinence Info Percent of low risk long-stay residents who lose control of their bowels or bladder 16.3%
33% better than Washington average

Washington average: 24.3%

Falls with Major Injury Info Percent of long-stay residents experiencing one or more falls with major injury 3.1%
17% worse than Washington average

Washington average: 2.6%

High Risk Residents with Pressure Ulcers Info Percent of long-stay high risk residents with pressure ulcers 4.3%
13% better than Washington average

Washington average: 4.9%

Urinary Tract Infection Info Percent of long-stay residents with a urinary tract infection 3.9%
124% worse than Washington average

Washington average: 1.7%

Lost Too Much Weight Info Percent of long-stay residents who lose too much weight 5.3%
9% better than Washington average

Washington average: 5.8%

Depressive Symptoms Info Percent of long-stay residents who have depressive symptoms 0.3%
98% better than Washington average

Washington average: 16.2%

Antipsychotic Use Info Percent of long-stay residents who received an antipsychotic medication 9.7%
33% better than Washington average

Washington average: 14.5%

Pneumococcal Vaccine Info Percent of long-stay residents assessed and appropriately given the pneumococcal vaccine 98.9%
In line with Washington average

Washington average: 96.2%

Influenza Vaccine Info Percent of long-stay residents assessed and appropriately given the seasonal influenza vaccine 100.0%
7% better than Washington average

Washington average: 93.8%

Hospitalizations per 1,000 days Info Number of hospitalizations per 1,000 long-stay resident days. 0.26
81% better than Washington average

Washington average: 1.38

ED visits per 1,000 days Info Number of outpatient emergency department visits per 1,000 long-stay resident days. 0.47
69% better than Washington average

Washington average: 1.51

Short-stay resident measures
Pneumococcal Vaccine Info Percent of short-stay residents assessed and appropriately given the pneumococcal vaccine 79.4%
10% worse than Washington average

Washington average: 88.1%

Antipsychotic medication increase Info Percent of short-stay residents who newly received an antipsychotic medication 0.0%
100% better than Washington average

Washington average: 1.4%

Influenza Vaccine Info Percent of short-stay residents assessed and appropriately given the seasonal influenza vaccine 94.4%
15% better than Washington average

Washington average: 82.0%

Falls with major injury Info Percentage of SNF residents who experience falls with major injury during their stay. 0.0%
100% better than Washington average

Washington average: 0.8%

Ability to care for self at discharge Info Percentage of residents at or above expected ability to care for themselves at discharge. 25.0%
53% worse than Washington average

Washington average: 53.7%

Breakdown by payment type

Medicare

23% of new residents, usually for short-term rehab.

Typical stay 1 - 2 months

Private pay

75% of new residents, often for short stays.

Typical stay 9 - 10 months

Medicaid

2% of new residents, often for long-term daily care.

Typical stay 8 years

Facility Characteristics

Source: CMS Long-Term Care Facility Characteristics (Data as of Jan 2026)

Total residents 100
Medicare
50
50% of residents
Medicaid
50
50% of residents
Programs & Services
Residents Group

Residents meet regularly to discuss policies, care quality, and activities

Active Resident Council

Organized group of residents that meets regularly to discuss facility policies, quality of life, and activities.

Finances and operations

Based on CMS SNF Cost Report for fiscal year ending in 06/2024.

Governmental community
Operated by city authorities.
Net patient revenue Info Net patient revenue — what the home actually collects for resident care, after contractual allowances, bad debt and discounts are subtracted from its gross charges (CMS cost report, Worksheet G-3). It covers resident care only; money the home earns from other sources is shown separately as "Other income."
$14.8M
Net patient income Info Net patient income: net patient revenue minus the home's total operating expenses. A positive figure means it earns more from resident care than it spends to deliver it; a negative figure means the opposite. It excludes non-operating "other income."
-$447.7K
Governmental community Operated by city authorities.
Net patient revenue Info Net patient revenue — what the home actually collects for resident care, after contractual allowances, bad debt and discounts are subtracted from its gross charges (CMS cost report, Worksheet G-3). It covers resident care only; money the home earns from other sources is shown separately as "Other income."
$14.8M Rank #73 / 94Revenue — State benchmarkedThis home is ranked 73rd out of 94 homes in Washington. Shows this facility's annual revenue compared to the Washington average. Higher revenue generally means more resources for staffing and capital — read alongside Payroll %.Rankings are based only on facilities in Washington that report data for that category. Facilities without available data are excluded from the ranking.Click the rank badge to see the full State ranking.Click here to see the full State ranking.
Net patient income Info Net patient income: net patient revenue minus the home's total operating expenses. A positive figure means it earns more from resident care than it spends to deliver it; a negative figure means the opposite. It excludes non-operating "other income."
-$447.7K
Other income Info Money the home earns outside of resident care — such as investments, grants, rentals and other non-operating sources (CMS cost report, Worksheet G-3). It is tracked separately from net patient revenue: it is not part of that figure, and it is not included in net patient income.
$55.0K
Payroll costs Info Staff salaries plus wage-related costs — benefits such as payroll taxes, health insurance and retirement — from the home's own accounting records (CMS cost report, Worksheet A). Contract or agency labor is counted separately, under other operating costs. Rank #11 / 94Payroll — State benchmarkedThis home is ranked 11th out of 94 homes in Washington. Shows total annual staff payroll benchmarked to the Washington average. Higher payroll investment relative to peers often signals better staffing and less reliance on cheaper contract labor.Rankings are based only on facilities in Washington that report data for that category. Facilities without available data are excluded from the ranking.Click the rank badge to see the full State ranking.Click here to see the full State ranking.
$11.9M 80.4% of net patient revenue Info Payroll as a share of revenue: staff salaries and wage-related benefits divided by net patient revenue. A higher figure means more of each revenue dollar goes to staff pay. Rank #1 / 94Payroll % — State benchmarkedThis home is ranked 1st out of 94 homes in Washington. Shows payroll as a percentage of revenue versus the Washington average. Well-run Washington facilities typically land around 53–61% — the top third Statewide. Below 25% may signal understaffing or heavy agency use — read with Staffing ratings.Rankings are based only on facilities in Washington that report data for that category. Facilities without available data are excluded from the ranking.Click the rank badge to see the full State ranking.Click here to see the full State ranking.
Other operating costs Info Everything it costs to run the home apart from payroll — food, utilities, supplies, maintenance, contract labor and administration. Calculated as total operating expense minus payroll (staff salaries and wage-related benefits).
$3.3M
Total costs Info The home's total operating expense for the year — all the costs of running it, salaries included (CMS cost report, Worksheet G-3).
$15.2M

What does this home offer?

Building type icon
Building type icon

Building Type: 2-story

Beauty services icon

Beauty Services

Transportation services icon

Transportation Services

Social and recreational activities icon

Social and Recreational Activities

Who this home usually serves

TYPE OF STAY

Primarily short stays

Residents typically stay for brief periods, with frequent admissions and discharges throughout the year.

Most new residents arrive under private pay (75% of admissions), and a typical private pay stay runs around 9 - 10 months.

Admissions
122 total

Coverage residents most often arrive under.

Medicare 23%
Private pay 75%
Medicaid 2%
Discharges
111 total

Coverage residents most often leave under.

Medicare 18%
Private pay 74%
Medicaid 8%

Places of interest near Spokane Veterans Home

Address 1.2 miles from city center Info Estimated distance in miles from Spokane's city center to Spokane Veterans Home's address, calculated via Google Maps.

Calculate Travel Distance to Spokane Veterans Home

Add your location

Address

Compare Nursing Homes around Spokane

The information below is reported by the Washington Department of Social and Health Services, Residential Care Services.

2 facilities compared · CMS & WA Dept. of Health data

Spokane Veterans Home
NH
AL
Spokane (East Central)
100
Facility 100
WA AVG 82
Rank #93 / 366
93.3%
Facility 93.3%
WA AVG 72.5%
Rank #33 / 310
+29%
4.16
Facility 4.16
WA AVG 4.22
Rank #38 / 90
+80%-2%
$0
Facility $0
WA AVG $87.7k
Rank #1 / 92
48
Facility 48
WA AVG 48.9
Rank #45 / 92
4.8
Facility 4.8
WA AVG 6.9
Rank #23 / 92
197-
77
Facility 77
WA AVG 51
Rank #97 / 628
Washington State Department Of Vete
$14.8M
Facility $14.8M
WA AVG $13.2M
Rank #73 / 94
$11.9M
Facility $11.9M
WA AVG $5.7M
Rank #11 / 94
80.4%
Facility 80.4%
WA AVG 45.5%
Rank #1 / 94
505509
Rockwood South Hill
NH
AL
IL
MC
Spokane (Downtown Spokane)
90
Facility 90
WA AVG 82
Rank #134 / 366
77.8%
Facility 77.8%
WA AVG 72.5%
Rank #133 / 310
+7%
5.77
Facility 5.77
WA AVG 4.22
Rank #4 / 90
+104%+37%
$0
Facility $0
WA AVG $87.7k
Rank #1 / 92
48
Facility 48
WA AVG 48.9
Rank #45 / 92
12.0
Facility 12.0
WA AVG 6.9
Rank #83 / 92
-35-
96
Facility 96
WA AVG 51
Rank #15 / 628
Chris Bafus
$24.8M
Facility $24.8M
WA AVG $13.2M
Rank #6 / 94
$15.9M
Facility $15.9M
WA AVG $5.7M
Rank #6 / 94
64.3%
Facility 64.3%
WA AVG 45.5%
Rank #67 / 94
505033

Financial Assistance for
Nursing Home in Washington

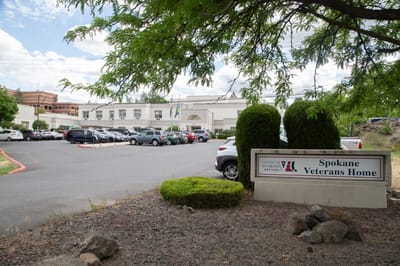
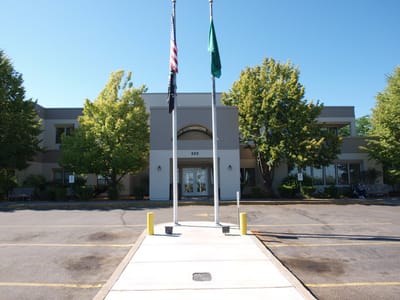
Spokane Veterans Home is located in Spokane, Washington.
Here are the financial assistance programs available to residents in Washington.

Get Financial aid guidance

Community Options Program Entry System (COPES)

WA Medicaid COPES

Age 65+ or disabled
General Washington resident, Medicaid-eligible, nursing home-level care need.
Income Limits (2025) ~$2,829/month 300% FBR, individual
Asset Limits $2,000 (individual), $3,000 (couple).
WA

High demand in urban areas (e.g., Seattle).

Benefits
Personal care (5-7 hours/day) Respite (240 hours/year) Adult day care ($70/day) Home modifications ($1,500 avg.)

Washington Family Caregiver Support Program

WA NFCSP

Age Caregiver of someone 60+ (or with dementia)
General Washington resident.
Income Limits No strict limit; prioritizes low-income.
Asset Limits Not applicable.
WA

High urban demand; rural outreach.

Benefits
In-home respite (4-6 hours/day) Adult day care (~$70/day) Short-term facility care (up to 5 days)

Community First Choice (CFC)

Washington Community First Choice

Age 65+ (or disabled 18+)
General WA resident, Medicaid-eligible, need help with 2+ ADLs/IADLs.
Income Limits (2025) ~$2,829/month; QIT optional.
Asset Limits $2,000 (individual), $3,000 (couple).
WA

Broader than COPES; serves ~20,000; self-directed option.

Benefits
Personal care (4-6 hours/day) Respite (~240 hours/year) Assistive devices Training Transportation

Older Americans Act (OAA) Services

Washington OAA Services

Age 60+
General WA resident; no income/asset limits.
Income Limits (2025) None; donations encouraged.
Asset Limits Not assessed.
WA

13 AAAs; includes Meals on Wheels; rural focus.

Benefits
Meals (~$5-$7/meal) Transportation Homemaker services (~4 hours/week) Respite (~5 days/year) Legal aid

Medicare Savings Program (MSP)

Washington Medicare Savings Program

Age 65+ or disabled
General WA resident, Medicare Part A/B.
Income Limits (2025) ~$2,510/month (QMB), ~$3,380/month (SLMB), ~$3,598/month (QI)—individual.
Asset Limits $9,430 (individual), $14,130 (couple).
WA

Includes Extra Help for Part D; no waitlist.

Benefits
Covers Part B premiums ($174.70/month) Deductibles ($240/year) Copays (~20%)

VA Aid and Attendance (A&A) and Housebound Benefits

Washington VA Aid and Attendance/Housebound

Age 65+ or disabled veteran/spouse
General WA resident, wartime service, ADL help (A&A) or homebound.
Income Limits (2025) Net income < ~$1,984/month (veteran with dependent, A&A); pension offsets income.
Asset Limits ~$155,356 net worth
WA

High veteran use; supports rural/urban needs.

Benefits
Cash (~$1,433-$2,642/month veteran, ~$951-$1,318 spouse) for care costs

Senior Citizens Property Tax Exemption

Washington Senior Property Tax Exemption

Age 61+ or disabled retiree
General WA resident, homeowner, income-based.
Income Limits (2025) ~$45,000-$70,000/year varies by county, e.g., King: $70,000
Asset Limits Not assessed; home value cap varies ~$250,000-$400,000
WA

Saves ~$500-$1,500/year; offered statewide.

Benefits
Tax exemption (~$500-$1,500/year depending on county)

Senior Farmers’ Market Nutrition Program (SFMNP)

Washington SFMNP

Age 60+
General WA resident, low-income.
Income Limits (2025) ~$2,322/month 185% FPL
Asset Limits Not assessed.
WA

Vouchers (~$80/season); serves ~20,000 via AAAs.

Benefits
Vouchers (~$80/season) for produce at farmers’ markets

Frequently Asked Questions about Spokane Veterans Home

What neighborhood is Spokane Veterans Home in?

Spokane Veterans Home is in the East Central neighborhood.

Is Spokane Veterans Home in a walkable area?

Spokane Veterans Home has a walk score of 77. Very walkable. Most errands can be accomplished on foot, and many essentials are within a short walk.

What is the occupancy rate at Spokane Veterans Home?

Spokane Veterans Home's occupancy is 93.3%.

Are there photos of Spokane Veterans Home?

Yes — there are 4 photos of Spokane Veterans Home in the photo gallery on this page.

What is the address of Spokane Veterans Home?

Spokane Veterans Home is located at 222 E 5Th Ave, Spokane, WA 99202.

What is the phone number of Spokane Veterans Home?

(509) 344-5770 will put you in contact with the team at Spokane Veterans Home.

Is Spokane Veterans Home Medicare or Medicaid certified?

Yes — Spokane Veterans Home is a CMS-certified provider of Medicare and Medicaid.

Guides for Better Senior Living

Care Cost Calculator: See Prices in Your Area

Nursing Home Data Explorer

Don’t Wait Too Long: 7 Red Flag Signs Your Parent Needs Assisted Living Now

The True Cost of Assisted Living in 2025 – And How Families Are Paying For It

Understanding Senior Living Costs: Pricing Models, Discounts & Financial Assistance