Explore Open Rooms
1 Contact details
2 What type of senior care service are you looking for?
3 What budget do you have in mind for senior care?
4 How soon do you need to find care?
5 Additional details

Thank you for your interest!

Our team will be in touch shortly to help with next steps.

Nursing Home in Clarksville

CMS overall rating Info The Overall CMS Rating combines results from health inspections, staffing levels and quality measures. Health inspections carry the most weight. Staffing and quality scores can increase or decrease the final rating based on performance compared to state and national standards.

Spring Meadows Health Care Center

Overview of Spring Meadows Health Care Center

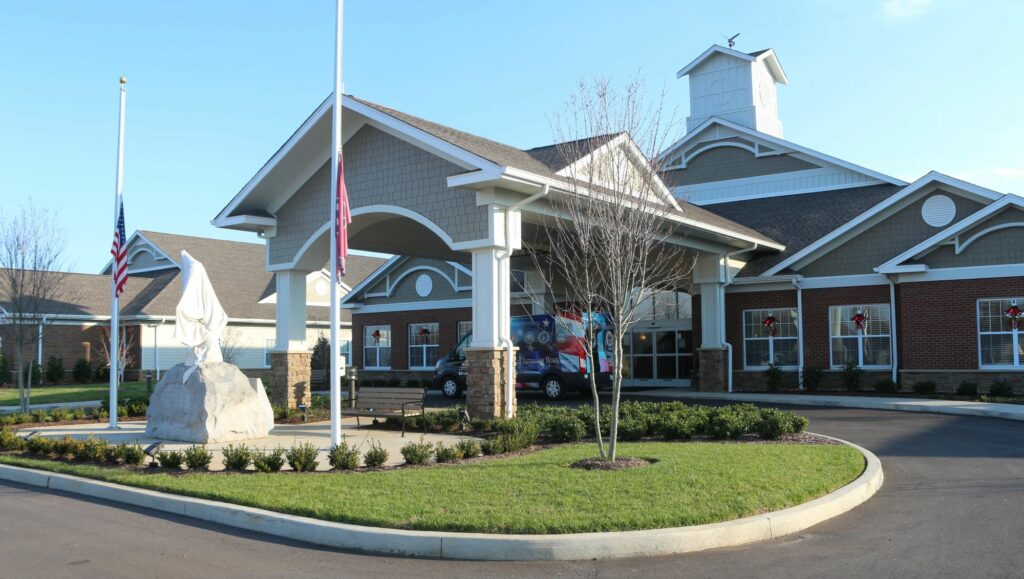
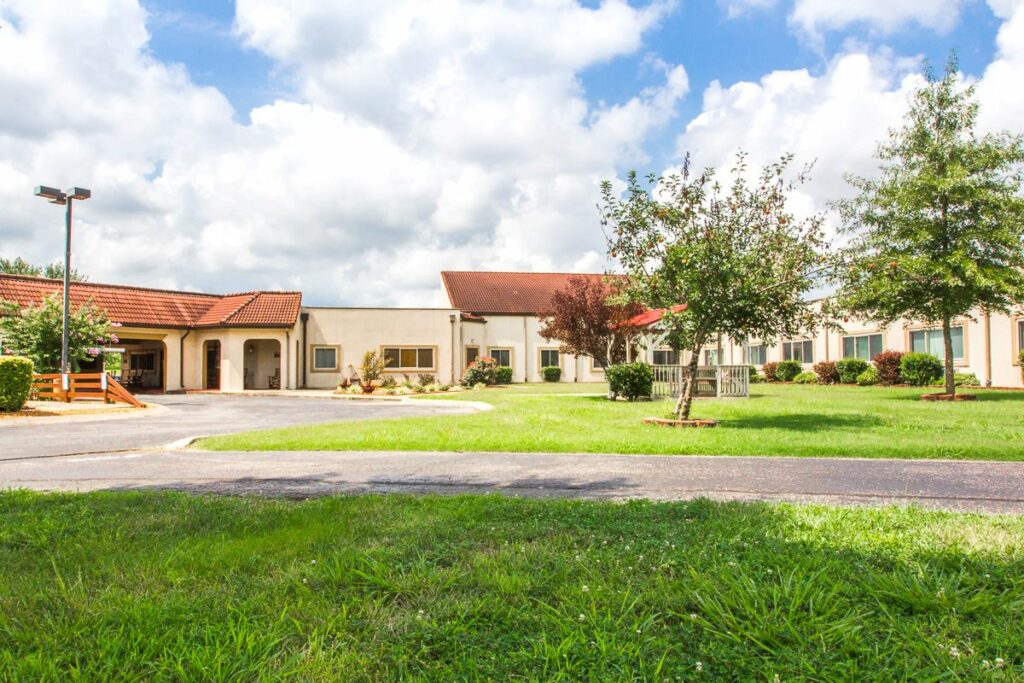
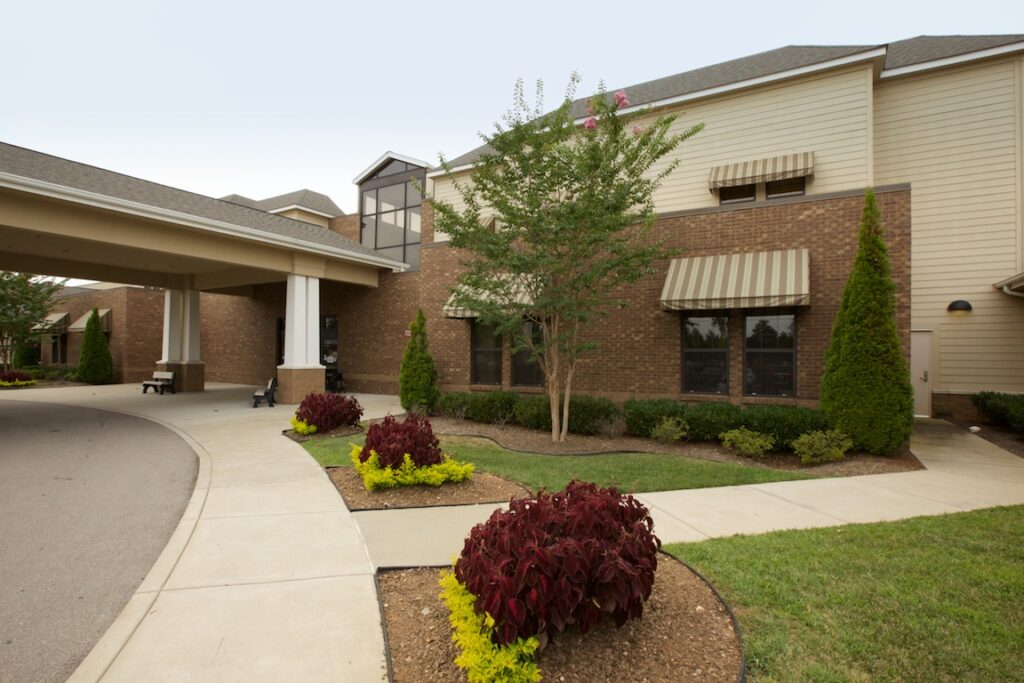
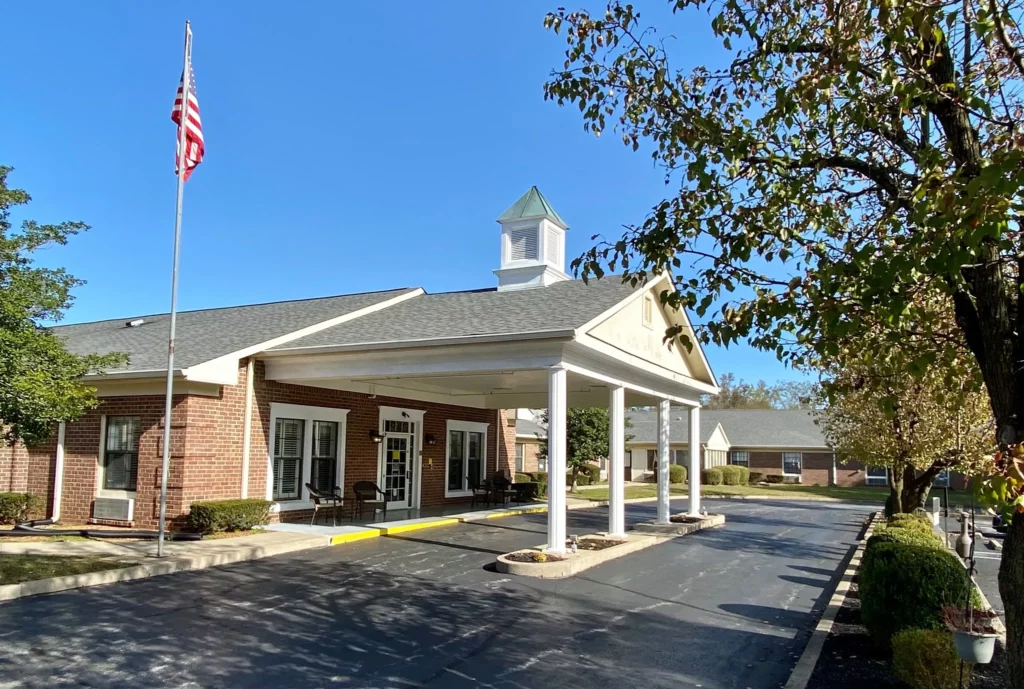
Spring Meadows Health Care Center is a community that proudly elevates the recovery experience of its residents. A premier nursing home has been awarded a list of accolades, some of which are from the U.S. News and World Report ranking them as one of the Best Nursing Homes in the country. As a short-term rehabilitation and long-term nursing home with memory care services, the professional care staff is committed to having residents get back on their feet as soon as possible.

(503) 397-0401

Quality ratings

Measured by Centers for Medicare & Medicaid Services (CMS)

Overall rating Info The Overall CMS Rating combines results from health inspections, staffing levels and quality measures. Health inspections carry the most weight. Staffing and quality scores can increase or decrease the final rating based on performance compared to state and national standards.
1/5
Tennessee average: 3.1/5
Health Inspection Info Based on the results of the facility's three most recent standard inspections and any complaint investigations. CMS reviews the number, scope, and severity of deficiencies, with more recent findings weighted more heavily.
1/5
Tennessee average: 2.9/5
Staffing Info Measures average nursing staff hours per resident per day, including Registered Nurses (RNs) and total nursing staff. Ratings are adjusted based on the level of care residents require and are compared to state and national benchmarks.
2/5
Tennessee average: 2.5/5
Quality Measures Info Based on clinical and physical health indicators reported to CMS, such as hospital readmissions, falls, pressure ulcers, and improvements in mobility. These measures reflect how well residents' health needs are being managed.
4/5
Tennessee average: 3.7/5

Nursing care per resident

Info This shows how many total hours of nursing staff time are available per resident each day. Higher numbers usually mean more staff support.
3h 13m per day

This home provides 12% less nursing time per resident than the Tennessee average.

Tennessee average: 3h 40m per day

Staffing hours breakdown

Info Hours of care per resident per day, broken down by staff type. Data from CMS Medicare.
Staff type Facility State avg National avg
Registered Nurse (RN) Info Registered nurse hours per resident per day. 25m per day 37m per day 41m per day
Nurse Aide Info Nurse aide hours per resident per day. 2h 1m per day 2h 9m per day 2h 21m per day
Total Nursing (Weekend) Info Total number of nurse staff hours per resident per day on weekends. 3h 12m per day 3h 21m per day 3h 26m per day
Physical Therapist Info Physical therapist staff hours per resident per day. 3m per day 5m per day 4m per day
RN (Weekend) Info Registered nurse hours per resident per day on weekends. 23m per day 25m per day 29m per day

Capacity and availability

Smaller home

May offer a more intimate, personalized care environment.

Total beds 32

This home is often near full

That suggests steady demand, but availability may be limited.

Higher demand than most homes in Tennessee
Occupancy rate 325%
Residents per day (avg) 111
Occupancy rate
325%
Residents per day (avg)
111

Who this home usually serves

TYPE OF STAY

Mostly short-term rehab stays

Most residents typically stay for a few weeks or months before returning home or moving on.

Might be optimal for
Short stays Recovery Medicare-covered care

Breakdown by payment type

Medicare

41% of new residents, usually for short-term rehab.

Typical stay 29 days

Private pay

36% of new residents, often for short stays.

Typical stay 1 - 2 months

Medicaid

23% of new residents, often for long-term daily care.

Typical stay 1 years

Finances and operations

Privately-owned community
Operated by a business corporation.
Home revenue
$13.5M
Profit
$1.1M
Privately-owned community Operated by a business corporation.
Home revenue
$13.5M
Profit
$1.1M
Payroll costs Info The portion of the home's budget spent on staff, including nurses, caregivers, and other employees who support care and operations.
$5.6M
41.3% of revenue
Other operating costs Info All remaining costs needed to run the home, such as food, utilities, building maintenance, supplies and administrative expenses.
$6.8M
Total costs $12.4M
Bed community size
32-bed community
A moderately sized community that may balance personal attention with shared amenities and social activities.
Years in operation
39 years in operation
A longer operating history, which may indicate experience navigating regulations and delivering ongoing care.
Walk Score
Walk Score: 22 / 100
Car-dependent. Most errands require a car, with limited nearby walkable options.
BBB Rating
BBB Rating: A+ (Not Accredited)
An independent rating from the Better Business Bureau based on factors such as complaint history, transparency, and business practices.
How BBB ratings work

About this community

Occupancy

Occupancy rate
325%
40% higher than Tennessee average

Tennessee average: 72%

Occupied beds
104 / 32
Average residents 82 per day

License Details

Facility TypeAssisted Care Living Facility
StatusFacility Closed
ExpirationJune 30, 2000

Additional Licensing Details

License Number00000132
CMS Certification Number445402

Ownership & Operating Entity

Spring Meadows Health Care Center is legally operated by Spring Meadows Retirement Village, and administrated by Shannon R. Jones.

Types of Care at Spring Meadows Health Care Center

Skilled Nursing

Contact Spring Meadows Health Care Center

Inspection History

In Tennessee, the Department of Health, Division of Health Care Facilities performs unannounced inspections and investigations to ensure facilities provide high-quality resident care.

5 visits/inspections

1 visits/inspections triggered by complaints

2 routine inspections

Results

5 with issues

0 without issues

Tennessee average: 9 complaint visits

Latest inspection

Date July 11, 2024
Annual Inspection

24 deficiencies

Deficiencies indicate regulatory issues. A higher number implies the facility had several areas requiring improvement.

Tennessee average: 17 deficiencies

Health Inspection History

Inspections
Total health inspections 5

Tennessee average 3.5


Last Health inspection on Jul 2024

Total health citations 23

Tennessee average 15.4

Citations per inspection
4.6

Tennessee average 4.39


Health citations are formal notices following inspections when they fail to comply with safety and care standards.

20 of 23 citations resulted from standard inspections; 2 of 23 resulted from complaint investigations; and 1 of 23 came from combined inspections (standard and complaint).

Breakdown of citation severity (last 3 years)
Critical Health citations More info 6
445% worse than Tennessee average

Tennessee average: 1.1


Serious Health citations More info 0
100% better than Tennessee average

Tennessee average: 0.6

6 critical citations More info Tennessee average: 1.1

0 serious citations More info Tennessee average: 0.6

17 moderate citations More info Tennessee average: 13.7

0 minor citations More info Tennessee average: 0.1
Citations history (last 3 years)
Infection Control moderate citation Info Issues related to preventing and controlling infections, including hygiene practices and safety protocols. Jul 11, 2024
Corrected

Nursing Services moderate citation Info Issues related to the availability and quality of nursing staff and the care they provide. Jul 11, 2024
Corrected

Quality of Care moderate citation Info Issues related to how well residents receive appropriate treatment and support for their medical and daily care needs. Jul 11, 2024
Corrected

Care Planning moderate citation Info Issues related to creating and updating personalized care plans for residents based on their needs and conditions. Jul 11, 2024
Corrected

Compare Nursing Homes around Clarksville The information below is reported by the Tennessee Department of Health, Division of Health Care Facilities.

4 facilities compared · CMS & TN Dept. of Health data · Updated Apr 2026

Filter by care type
Tennessee State Veterans‘ Home – Clarksville
NH

Nursing Home Licensed facility providing 24/7 skilled nursing care for residents with complex, ongoing medical needs. Staffed by RNs, LPNs, and CNAs. Inspected and star-rated annually by CMS. Accepts Medicare (short-term rehab) and Medicaid (long-term care).

Clarksville
108
96.7%
+32%
-
-
-
0
7
2.3
2
102
-
0
Tennessee State Veterans' Homes Board
$15.9M
$6.5M
41.1%
445524
Signature HealthCARE of Clarksville
NH

Nursing Home Licensed facility providing 24/7 skilled nursing care for residents with complex, ongoing medical needs. Staffed by RNs, LPNs, and CNAs. Inspected and star-rated annually by CMS. Accepts Medicare (short-term rehab) and Medicaid (long-term care).

Clarksville
120
43.5%
-40%
3.44
-13%
-5%
1
12
4.0
1
88
-
17
Lp Re I Holdings Llc
$15.6M
$3.7M
23.8%
445448
AHC Clarksville
NH

Nursing Home Licensed facility providing 24/7 skilled nursing care for residents with complex, ongoing medical needs. Staffed by RNs, LPNs, and CNAs. Inspected and star-rated annually by CMS. Accepts Medicare (short-term rehab) and Medicaid (long-term care).

Clarksville
113
91.7%
+26%
3.06
+3%
-16%
0
21
7.0
0
99
-
21
Dufour, Juanita
$15.1M
$4.8M
31.5%
445455
Spring Meadows Health Care Center
NH

Nursing Home Licensed facility providing 24/7 skilled nursing care for residents with complex, ongoing medical needs. Staffed by RNs, LPNs, and CNAs. Inspected and star-rated annually by CMS. Accepts Medicare (short-term rehab) and Medicaid (long-term care).

Clarksville
121
92.6%
+27%
3.22
+73%
-11%
1
23
4.6
6
111
A+
22
Spring Meadows Retirement Village
$12.6M
$5.6M
44.3%
445402

Places of interest near Spring Meadows Health Care Center

Address 6.0 miles from city center — 1.95 miles to nearest hospital (DaVita Clarksville Dialysis)

Calculate Travel Distance to Spring Meadows Health Care Center

Add your location

Address

Staffing Data (Q2 2025)

This data corresponds to Q2 2025 and is based on CMS Payroll-Based Journal.

Total staff 245
Employees 130
Contractors 115
Staff to resident ratio 2.38:1
33% better than Tennessee average

Tennessee average ratio: 1.79:1

Avg staff/day 56
Average shift 7.8 hours
6% worse than Tennessee average

Tennessee average: 8.3 hours

Total staff hours (quarter) 39,641
Nursing staff breakdown
Registered Nurse

Manages medical care and health needs.

Total count 37
Average shift length Info Average shift length. Calculated as total hours divided by days worked and average staff per day. 8.4 hours

This role is partially covered by contractors.

Licensed Practical Nurse

Assists with medical care and medications.

Total count 56
Average shift length Info Average shift length. Calculated as total hours divided by days worked and average staff per day. 8.1 hours

This role is partially covered by contractors.

Certified Nursing Assistant

Helps with daily care and mobility.

Total count 112
Average shift length Info Average shift length. Calculated as total hours divided by days worked and average staff per day. 8 hours

This role is partially covered by contractors.

Contractor staffing

Total hours from contractors

9.4%

3,724 contractor hours this quarter

Certified Nursing Assistant: 52 Licensed Practical Nurse: 33 Registered Nurse: 30
Staff by category
Certified Nursing Assistant605211220,76491100%8
Licensed Practical Nurse2333566,15091100%8.1
Registered Nurse730373,34191100%8.4
RN Director of Nursing5052,5478391%8.4
Other Dietary Services Staff4041,17691100%7.6
Physical Therapy Aide5057208796%5.7
Speech Language Pathologist6066958088%4.6
Clinical Nurse Specialist5056846470%8
Qualified Social Worker3035396875%6.7
Nurse Practitioner1015276673%8
Qualified Activities Professional1014936369%7.8
Mental Health Service Worker1014886268%7.9
Dietitian1014806066%8
Administrator1014725965%8
Respiratory Therapy Technician4043607582%3.8
Physical Therapy Assistant3032076571%3.1
112 Certified Nursing Assistant
% of Days 100%
56 Licensed Practical Nurse
% of Days 100%
37 Registered Nurse
% of Days 100%
5 RN Director of Nursing
% of Days 91%
4 Other Dietary Services Staff
% of Days 100%
5 Physical Therapy Aide
% of Days 96%
6 Speech Language Pathologist
% of Days 88%
5 Clinical Nurse Specialist
% of Days 70%
3 Qualified Social Worker
% of Days 75%
1 Nurse Practitioner
% of Days 73%
1 Qualified Activities Professional
% of Days 69%
1 Mental Health Service Worker
% of Days 68%
1 Dietitian
% of Days 66%
1 Administrator
% of Days 65%
4 Respiratory Therapy Technician
% of Days 82%
3 Physical Therapy Assistant
% of Days 71%

Facility Characteristics

Source: CMS Long-Term Care Facility Characteristics (Data as of Jan 2026)

Total census
103 residents
Residents by payment source
Medicare
5 residents (4.9%)
Medicaid
90 residents (87.4%)
Private pay or other
8 residents (7.8%)
Programs & Services
Residents' Group

Residents meet regularly to discuss policies, care quality, and activities

Active Resident Council

Organized group of residents that meets regularly to discuss facility policies, quality of life, and activities.

Quality of care over time

These measures show how residents usually do over time at this home, based on health outcomes and preventive care.

High-risk clinical events score Info A composite score based on pressure ulcers, falls with injury, weight loss, walking ability decline, and activities of daily living decline. 11.9
13% worse than Tennessee average

Tennessee average: 10.5

Functional decline score Info A composite score based on activities of daily living decline, walking ability decline, and incontinence. 26.7
37% worse than Tennessee average

Tennessee average: 19.5

Long-stay resident measures
Significantly above average Tennessee avg: 3.9 Info CMS star rating based on long-stay quality measure performance. 5 stars = significantly above average, 1 star = significantly below average.
Need for Help with Daily Activities Increased Info Percent of long-stay residents whose need for help with daily activities has increased 17.1%
7% worse than Tennessee average

Tennessee average: 16.0%

Walking Ability Worsened Info Percent of long-stay residents whose ability to move independently worsened 30.8%
42% worse than Tennessee average

Tennessee average: 21.7%

Low Risk Residents with Bowel/Bladder Incontinence Info Percent of low risk long-stay residents who lose control of their bowels or bladder 32.1%
55% worse than Tennessee average

Tennessee average: 20.7%

Falls with Major Injury Info Percent of long-stay residents experiencing one or more falls with major injury 2.9%
20% better than Tennessee average

Tennessee average: 3.7%

High Risk Residents with Pressure Ulcers Info Percent of long-stay high risk residents with pressure ulcers 1.2%
78% better than Tennessee average

Tennessee average: 5.4%

Urinary Tract Infection Info Percent of long-stay residents with a urinary tract infection 0.3%
87% better than Tennessee average

Tennessee average: 2.1%

Lost Too Much Weight Info Percent of long-stay residents who lose too much weight 7.4%
17% worse than Tennessee average

Tennessee average: 6.3%

Depressive Symptoms Info Percent of long-stay residents who have depressive symptoms 3.6%
67% better than Tennessee average

Tennessee average: 11.0%

Antipsychotic Use Info Percent of long-stay residents who received an antipsychotic medication 17.5%
6% worse than Tennessee average

Tennessee average: 16.5%

Pneumococcal Vaccine Info Percent of long-stay residents assessed and appropriately given the pneumococcal vaccine 99.7%
11% better than Tennessee average

Tennessee average: 89.9%

Influenza Vaccine Info Percent of long-stay residents assessed and appropriately given the seasonal influenza vaccine 100.0%
6% better than Tennessee average

Tennessee average: 94.5%

Hospitalizations per 1,000 days Info Number of hospitalizations per 1,000 long-stay resident days. 0.76
52% better than Tennessee average

Tennessee average: 1.58

ED visits per 1,000 days Info Number of outpatient emergency department visits per 1,000 long-stay resident days. 1.07
32% better than Tennessee average

Tennessee average: 1.57

Short-stay resident measures
Above average Tennessee avg: 3.4 Info CMS star rating based on short-stay quality measure performance. 5 stars = much above average, 1 star = much below average.
Pneumococcal Vaccine Info Percent of short-stay residents assessed and appropriately given the pneumococcal vaccine 87.3%
10% better than Tennessee average

Tennessee average: 79.7%

Antipsychotic medication increase Info Percent of short-stay residents who newly received an antipsychotic medication 0.4%
75% better than Tennessee average

Tennessee average: 1.7%

Influenza Vaccine Info Percent of short-stay residents assessed and appropriately given the seasonal influenza vaccine 83.1%
In line with Tennessee average

Tennessee average: 79.8%

Re-hospitalized after SNF stay Info Percentage of short-stay residents who were re-hospitalized after their nursing home admission. 21.6%
In line with Tennessee average

Tennessee average: 22.2%

Emergency department visits Info Percentage of short-stay residents who had an outpatient emergency department visit. 11.8%
5% worse than Tennessee average

Tennessee average: 11.2%

Falls with major injury Info Percentage of SNF residents who experience falls with major injury during their stay. 0.0%
100% better than Tennessee average

Tennessee average: 0.8%

Ability to care for self at discharge Info Percentage of residents at or above expected ability to care for themselves at discharge. 56.1%
5% better than Tennessee average

Tennessee average: 53.7%

Successful return to home or community Info Rate of successful return to home or community from a skilled nursing facility. 46.7%
8% worse than Tennessee average

Tennessee average: 50.6%

Penalties and fines

Federal penalties imposed by CMS for regulatory violations, including civil money penalties (fines) and denials of payment for new Medicare/Medicaid admissions.

Source: CMS Penalties Database (Data as of Jan 2026)

Total fines amount $18K
79% lower than Tennessee average

Tennessee average: $86K

Number of fines 1
43% fewer fines than Tennessee average

Tennessee average: 1.7

Payment Denials Info Serious action where Medicare and/or Medicaid temporarily stops payments for new residents until issues are fixed. 0
100% fewer payment denials than Tennessee average

Tennessee average: 0.5

Fines amount comparison
This facility $18K
Tennessee average $86K
Penalty History

Penalties are imposed by CMS for violations of federal nursing home regulations.

Civil Money Penalty Info Fines imposed for noncompliance, which can be assessed per day or per instance of violation. Apr 26, 2023
$18K

Last updated: Jan 2026

Guides for Better Senior Living

Care Cost Calculator: See Prices in Your Area

Nursing Home Data Explorer

Don’t Wait Too Long: 7 Red Flag Signs Your Parent Needs Assisted Living Now

The True Cost of Assisted Living in 2025 – And How Families Are Paying For It

Understanding Senior Living Costs: Pricing Models, Discounts & Financial Assistance

Financial Aid for Tennessee Seniors

Get financial aid guidance

CHOICES Program

TN Medicaid CHOICES

Age 65+ or disabled, Tennessee resident, Medicaid-eligible, nursing home-level care need.

~$2,829/month (300% FBR, individual).

$2,000 (individual), $3,000 (couple).

Managed care model; high rural demand.

Tennessee Options for Community Living

TN Options

Age 60+, Tennessee resident, at risk of nursing home.

~$2,000/month (individual, varies).

$5,000 (individual).

Limited funding; rural/urban balance.

Medicare Savings Program (MSP)

Tennessee Medicare Savings Program

Age 65+ or disabled, TN resident, Medicare Part A/B.

~$2,510/month (QMB), ~$3,380/month (SLMB), ~$3,598/month (QI)—individual.

$9,430 (individual), $14,130 (couple).

Three tiers; includes Extra Help for Part D; no waitlist.

Low-Income Home Energy Assistance Program (LIHEAP)

Tennessee LIHEAP

Age 60+ prioritized, TN resident, low-income household.

~$3,970/month (individual, 185% FPL).

Not assessed; income-focused.

Covers gas, electric, propane; emergency aid available.

Family Caregiver Support Program (FCSP)

Tennessee Family Caregiver Support Program

Caregivers of 60+ needing care or 55+ caregivers of others; TN resident; functional needs (2+ ADLs).

No strict cap; prioritizes low-income (~$24,980/year).

Not assessed; need-based.

Includes grandparent caregivers; high rural demand.

Senior Community Service Employment Program (SCSEP)

Tennessee SCSEP

Age 55+, unemployed, low-income, TN resident.

~$1,983/month (125% FPL).

Not specified; income-focused.

Priority for veterans, rural residents; AARP/Goodwill partnership.

VA Aid and Attendance (A&A) and Housebound Benefits

Tennessee VA Aid and Attendance/Housebound

Age 65+ or disabled veteran/spouse, TN resident, wartime service, need for ADL help (A&A) or homebound.

Net income < ~$1,984/month (veteran with dependent, A&A); pension offsets income.

~$155,356 (net worth limit).

High veteran population; supports rural/urban care needs.

Elderly Nutrition Program

Tennessee Elderly Nutrition Program

Age 60+, TN resident; no income limit but prioritizes low-income.

None; donations encouraged.

Not assessed.

Serves ~50,000 annually; 200+ congregate sites plus Meals on Wheels.

Property Tax Relief Program

Tennessee Property Tax Relief Program

Age 65+, TN resident, homeowner/renter (or widow/er 50+, disabled 18+).

~$45,000/year (household, excludes half of Social Security).

Not assessed; income-focused.

Rebates up to $1,000; serves ~100,000 annually.