AHC Clarksville
CMS overall rating Info CMS (the Centers for Medicare & Medicaid Services) is the federal agency that rates nursing home quality. Its Overall Rating runs from 1 to 5 stars, combining health inspections, staffing, and quality measures, with inspections weighted most heavily.

AHC Clarksville

CMS overall rating Info CMS (the Centers for Medicare & Medicaid Services) is the federal agency that rates nursing home quality. Its Overall Rating runs from 1 to 5 stars, combining health inspections, staffing, and quality measures, with inspections weighted most heavily.
Calculator: See prices in your area
AHC Clarksville accepts Medicare, Medicaid, and private pay.

Overview of Ahc Clarksville

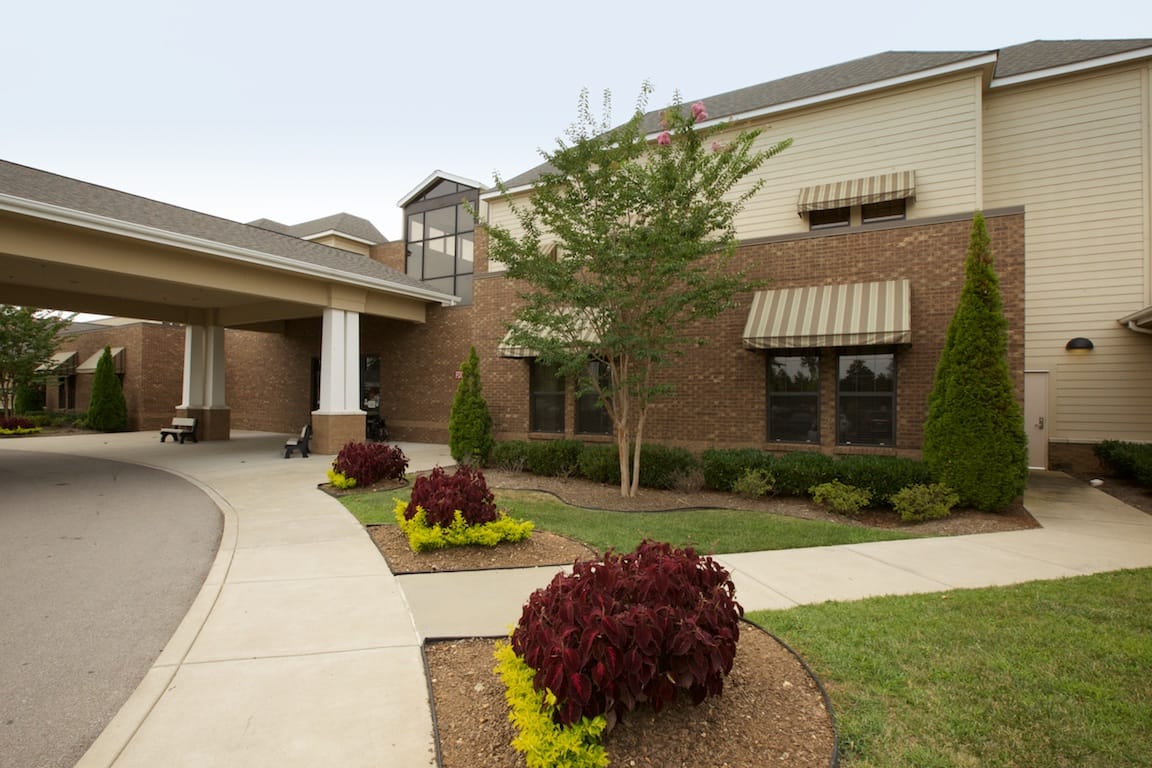
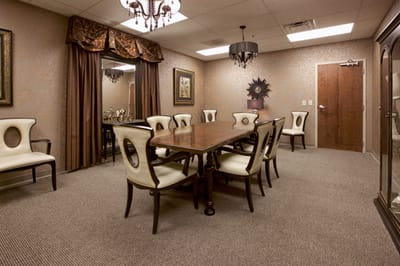
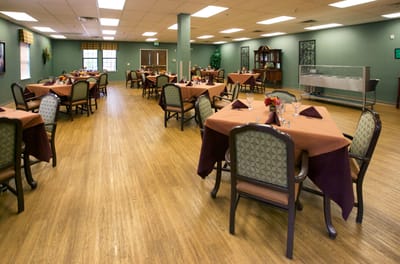
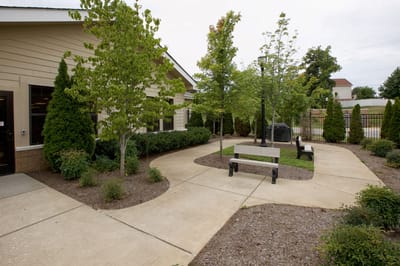
The American Health Communities (AHC) Cumberland is Clarksville’s skilled nursing and rehabilitation home. Quality nursing homes aim to change the meaning of recovery for seniors through the exceptional care delivered by their patient-friendly staff to offer the best care possible for their residents. Ahc Clarksville strives to have all its residents experience the comprehensive and exemplary care offered.

The community boasts its Collaborative Care Plans that offer physicians, nurses, therapists, dietary specialists, and social workers who are directly involved in the holistic care of each resident. Speech, physical, and occupational needs are also provided, and outpatient rehabilitation services are available.

Quality ratings

Measured by Centers for Medicare & Medicaid Services (CMS)

Overall rating Info The Overall CMS Rating combines results from health inspections, staffing levels and quality measures. Health inspections carry the most weight. Staffing and quality scores can increase or decrease the final rating based on performance compared to state and national standards.
▼ 29.4% Below TN avg. ▼ 29.4% Below TN avg.TN average: 2.8Click the badge to see the full State ranking.Click here to see the full State ranking.
Health Inspection Info Based on the results of the facility's three most recent standard inspections and any complaint investigations. CMS reviews the number, scope, and severity of deficiencies, with more recent findings weighted more heavily.
▼ 28.2% Below TN avg. ▼ 28.2% Below TN avg.TN average: 2.8Click the badge to see the full State ranking.Click here to see the full State ranking.
Staffing Info Measures average nursing staff hours per resident per day, including Registered Nurses (RNs) and total nursing staff. Ratings are adjusted based on the level of care residents require and are compared to state and national benchmarks.
▲ 24.2% Above TN avg. ▲ 24.2% Above TN avg.TN average: 2.4Click the badge to see the full State ranking.Click here to see the full State ranking.
Quality Measures Info Based on clinical and physical health indicators reported to CMS, such as hospital readmissions, falls, pressure ulcers, and improvements in mobility. These measures reflect how well residents' health needs are being managed.
▼ 12.8% Below TN avg. ▼ 12.8% Below TN avg.TN average: 3.4Click the badge to see the full State ranking.Click here to see the full State ranking.

Staffing hours breakdown

Info Daily nursing hours per resident by staff type, reported to CMS. Higher is generally better — compare this facility to state and national averages to see where staffing stands.

Hours per resident per day — compared to Tennessee state averages

Total nursing care / resident Info This home is ranked 152nd out of 192 homes in Tennessee for nurse hours. Total adjusted nursing hours per resident per day, combining RN, LPN, and aide time. CMS adjusts this for case-mix so facilities can be fairly compared.
3h 4m per day
Rank #152 / 192Nurse hours — State benchmarkedThis home is ranked 152nd out of 192 homes in Tennessee. Shows adjusted nurse hours per resident per day benchmarked to the Tennessee average, with a ranking across 192 Tennessee facilities. More hours mean more direct care. The national average is about 3.5 hrs; below 3.0 is a red flag.Rankings are based only on facilities in Tennessee that report data for that category. Facilities without available data are excluded from the ranking.Click the rank badge to see the full State ranking.Click here to see the full State ranking.
This facility Tennessee avg (3h 38m per day)
vs Tennessee avg
-16%

0 of 6 metrics below state avg

Standout metric Weekend RN is +77% above state avg
Staff typeHours / Day / Residentvs state avg
Registered Nurse (RN) Info RNs hold the highest nursing license and can assess residents, interpret test results, and direct care plans. More RN hours per day often signals stronger clinical oversight and faster response to health changes. 45m per day ▲ 22% State avg: 37m per day · National avg: 41m per day
LPN / LVN Info Licensed Practical Nurses (LPNs) or Licensed Vocational Nurses (LVNs) deliver routine hands-on care — medication administration, wound dressing, and monitoring vital signs. They work under RN supervision and make up a large share of daily bedside care. 1h 28m per day ▲ 34% State avg: 1h 6m per day · National avg: 52m per day
Nurse Aide Info Certified Nurse Aides (CNAs) provide the most direct day-to-day assistance: bathing, dressing, feeding, and mobility. Nurse aide hours are typically the largest staffing category and directly affect residents' quality of life. 2h 52m per day ▲ 33% State avg: 2h 9m per day · National avg: 2h 21m per day
Weekend Total Nursing Info Combined nursing hours (RN + LPN + Nurse Aide) per resident per day on weekends. Staffing often drops on weekends — this figure reveals whether the facility maintains adequate coverage outside of weekday hours. 4h 53m per day ▲ 46% State avg: 3h 21m per day · National avg: 3h 26m per day
Physical Therapist Info Hours per resident per day provided by licensed Physical Therapists (PTs) or PT Assistants. PT services help residents recover mobility after injury or illness and are especially important for post-acute (short-stay) rehabilitation. 5m per day ■ Avg State avg: 5m per day · National avg: 4m per day
Weekend RN Info Registered nurse hours specifically on weekends. Facilities sometimes reduce RN presence on Saturdays and Sundays — a low weekend RN figure compared to weekday hours can indicate reduced clinical oversight when most administrative staff are absent. 44m per day ▲ 77% State avg: 25m per day · National avg: 29m per day

Capacity and availability

This home usually has limited availability

Higher occupancy than the Tennessee average: 73%
Occupancy rate
91.7% Rank #49 / 319Occupancy rate — State benchmarkedThis home is ranked 49th out of 319 homes in Tennessee. Shows this facility's occupancy rate versus the Tennessee average, with its Statewide rank out of 319. Higher occupancy signals strong local demand and financial stability.Rankings are based only on facilities in Tennessee that report data for that category. Facilities without available data are excluded from the ranking.Click the rank badge to see the full State ranking.Click here to see the full State ranking.
Avg. Length of Stay
128 days
Bed community size
113-bed community Rank #115 / 426Bed count — State benchmarkedThis home is ranked 115th out of 426 homes in Tennessee. Shows this facility's certified or reported bed count compared to other Tennessee facilities. Larger communities may offer more amenities, programs, and on-site services for residents and families.Rankings are based only on facilities in Tennessee that report data for that category. Facilities without available data are excluded from the ranking.Click the rank badge to see the full State ranking.Click here to see the full State ranking.
A larger shared setting that may offer more common spaces and organized community services.
Walk Score
Walk Score: 21 / 100 Rank #372 / 553Walk Score — State benchmarkedThis home is ranked 372nd out of 553 homes in Tennessee. Shows how walkable this facility's neighborhood is compared to the average Walk Score across Tennessee facilities. Higher scores benefit residents, families, and staff.Rankings are based only on facilities in Tennessee that report data for that category. Facilities without available data are excluded from the ranking.Click the rank badge to see the full State ranking.Click here to see the full State ranking.
Car-dependent. Most errands require a car, with limited nearby walkable options.

Contact AHC Clarksville

Staffing Data

Reporting period: October 1 – December 31, 2025 (Q4 2025). Source: CMS Payroll-Based Journal report.

Total staff 226
Employees 115
Contractors 111
Staff to resident ratio 2.38 : 1
36% more staff per resident than Tennessee average
Tennessee average ratio: 1.75 : 1 Tennessee average ratio: 1.75 : 1See full Tennessee ranking
Avg staff/day 62
Average shift 9.7 hours
17% better than Tennessee average
Tennessee average: 8.3 hours Tennessee average shift: 8.3 hoursSee full Tennessee ranking
Total staff hours (quarter) 55,143

Nursing staff breakdown

Q4 2025 · Oct 1 – Dec 31 More info This data comes from the CMS Payroll-Based Journal report covering October 1 – December 31, 2025.
Registered Nurse

Manages medical care and health needs.

RN Staff Info 17 total: 6 full-time employees and 11 contractors. 17
Average shift length Info Average shift length. Calculated as total hours divided by days worked and average staff per day. 10.5 hours
Licensed Practical Nurse

Assists with medical care and medications.

LPN Staff Info 66 total: 27 full-time employees and 39 contractors. 66
Average shift length Info Average shift length. Calculated as total hours divided by days worked and average staff per day. 9.8 hours
Certified Nursing Assistant

Helps with daily care and mobility.

CNA Staff Info 116 total: 55 full-time employees and 61 contractors. 116
Average shift length Info Average shift length. Calculated as total hours divided by days worked and average staff per day. 10.1 hours

Contractor staffing

Q4 2025 · Oct 1 – Dec 31 More info This data comes from the CMS Payroll-Based Journal report covering October 1 – December 31, 2025.

Total hours from contractors

37.1%

20,444 contractor hours this quarter

Certified Nursing Assistant: 61 Licensed Practical Nurse: 39 Registered Nurse: 11

Staff by category

Q4 2025 · Oct 1 – Dec 31 More info This data comes from the CMS Payroll-Based Journal report covering October 1 – December 31, 2025.
Certified Nursing Assistant556111627,18592100%10.1
Licensed Practical Nurse27396613,32892100%9.8
Registered Nurse611175,91692100%10.5
Physical Therapy Aide7071,4867177%7.2
Speech Language Pathologist4041,1877177%6.7
Physical Therapy Assistant3038326571%8.1
Respiratory Therapy Technician3037907683%6.5
Clinical Nurse Specialist1016876773%10.3
RN Director of Nursing2026186975%7.9
Dental Services Staff1015566368%8.8
Dietitian1015456368%8.7
Administrator1015126470%8
Nurse Practitioner1015126470%8
Other Dietary Services Staff1014976065%8.3
Qualified Social Worker2024926470%7.5
116 Certified Nursing Assistant
% of Days 100%
66 Licensed Practical Nurse
% of Days 100%
17 Registered Nurse
% of Days 100%
7 Physical Therapy Aide
% of Days 77%
4 Speech Language Pathologist
% of Days 77%
3 Physical Therapy Assistant
% of Days 71%
3 Respiratory Therapy Technician
% of Days 83%
1 Clinical Nurse Specialist
% of Days 73%
2 RN Director of Nursing
% of Days 75%
1 Dental Services Staff
% of Days 68%
1 Dietitian
% of Days 68%
1 Administrator
% of Days 70%
1 Nurse Practitioner
% of Days 70%
1 Other Dietary Services Staff
% of Days 65%
2 Qualified Social Worker
% of Days 70%

Penalties and fines

Federal penalties imposed by CMS for regulatory violations, including civil money penalties (fines) and denials of payment for new Medicare/Medicaid admissions.

Source: CMS Penalties Database

No penalties in the past 3 years

No civil money penalties or payment denials were reported in the last 3 years.

Quality of care over time

These measures show how residents usually do over time at this home, based on health outcomes and preventive care.

High-risk clinical events score Info A composite score based on pressure ulcers, falls with injury, weight loss, walking ability decline, and activities of daily living decline. 8.3
20% better than Tennessee average

Tennessee average: 10.5

Functional decline score Info A composite score based on activities of daily living decline, walking ability decline, and incontinence. 18.4
6% better than Tennessee average

Tennessee average: 19.5

Long-stay resident measures
Average Tennessee avg: 3.7 Info CMS star rating based on long-stay quality measure performance. 5 stars = significantly above average, 1 star = significantly below average.
Need for Help with Daily Activities Increased Info Percent of long-stay residents whose need for help with daily activities has increased 9.3%
42% better than Tennessee average

Tennessee average: 16.0%

Walking Ability Worsened Info Percent of long-stay residents whose ability to move independently worsened 21.1%
In line with Tennessee average

Tennessee average: 21.7%

Low Risk Residents with Bowel/Bladder Incontinence Info Percent of low risk long-stay residents who lose control of their bowels or bladder 24.9%
20% worse than Tennessee average

Tennessee average: 20.7%

Falls with Major Injury Info Percent of long-stay residents experiencing one or more falls with major injury 1.5%
60% better than Tennessee average

Tennessee average: 3.7%

High Risk Residents with Pressure Ulcers Info Percent of long-stay high risk residents with pressure ulcers 6.8%
24% worse than Tennessee average

Tennessee average: 5.4%

Urinary Tract Infection Info Percent of long-stay residents with a urinary tract infection 1.8%
13% better than Tennessee average

Tennessee average: 2.1%

Lost Too Much Weight Info Percent of long-stay residents who lose too much weight 3.0%
52% better than Tennessee average

Tennessee average: 6.3%

Depressive Symptoms Info Percent of long-stay residents who have depressive symptoms 17.8%
61% worse than Tennessee average

Tennessee average: 11.0%

Antipsychotic Use Info Percent of long-stay residents who received an antipsychotic medication 18.6%
13% worse than Tennessee average

Tennessee average: 16.5%

Pneumococcal Vaccine Info Percent of long-stay residents assessed and appropriately given the pneumococcal vaccine 67.2%
25% worse than Tennessee average

Tennessee average: 89.9%

Influenza Vaccine Info Percent of long-stay residents assessed and appropriately given the seasonal influenza vaccine 90.9%
In line with Tennessee average

Tennessee average: 94.5%

Hospitalizations per 1,000 days Info Number of hospitalizations per 1,000 long-stay resident days. 2.01
27% worse than Tennessee average

Tennessee average: 1.58

ED visits per 1,000 days Info Number of outpatient emergency department visits per 1,000 long-stay resident days. 1.27
19% better than Tennessee average

Tennessee average: 1.57

Short-stay resident measures
Average Tennessee avg: 3.4 Info CMS star rating based on short-stay quality measure performance. 5 stars = much above average, 1 star = much below average.
Pneumococcal Vaccine Info Percent of short-stay residents assessed and appropriately given the pneumococcal vaccine 61.3%
23% worse than Tennessee average

Tennessee average: 79.7%

Antipsychotic medication increase Info Percent of short-stay residents who newly received an antipsychotic medication 1.8%
8% worse than Tennessee average

Tennessee average: 1.7%

Influenza Vaccine Info Percent of short-stay residents assessed and appropriately given the seasonal influenza vaccine 66.5%
17% worse than Tennessee average

Tennessee average: 79.8%

Re-hospitalized after SNF stay Info Percentage of short-stay residents who were re-hospitalized after their nursing home admission. 22.1%
In line with Tennessee average

Tennessee average: 22.2%

Emergency department visits Info Percentage of short-stay residents who had an outpatient emergency department visit. 8.4%
25% better than Tennessee average

Tennessee average: 11.2%

Falls with major injury Info Percentage of SNF residents who experience falls with major injury during their stay. 0.8%
In line with Tennessee average

Tennessee average: 0.8%

Ability to care for self at discharge Info Percentage of residents at or above expected ability to care for themselves at discharge. 69.6%
30% better than Tennessee average

Tennessee average: 53.7%

Successful return to home or community Info Rate of successful return to home or community from a skilled nursing facility. 46.6%
8% worse than Tennessee average

Tennessee average: 50.6%

Breakdown by payment type

Medicare

38% of new residents, usually for short-term rehab.

Typical stay 1 months

Private pay

55% of new residents, often for short stays.

Typical stay 1 - 2 months

Medicaid

7% of new residents, often for long-term daily care.

Typical stay 4 years

Facility Characteristics

Source: CMS Long-Term Care Facility Characteristics (Data as of Jan 2026)

Total residents 95
Medicare
12
12.6% of residents
Medicaid
62
65.3% of residents
Private pay or other
21
22.1% of residents
Programs & Services
Residents Group

Residents meet regularly to discuss policies, care quality, and activities

Active Resident Council

Organized group of residents that meets regularly to discuss facility policies, quality of life, and activities.

Finances and operations

Based on CMS SNF Cost Report for fiscal year ending in 12/2023.

For-profit
Corporation
Net patient revenue Info Net patient revenue — what the home actually collects for resident care, after contractual allowances, bad debt and discounts are subtracted from its gross charges (CMS cost report, Worksheet G-3). It covers resident care only; money the home earns from other sources is shown separately as "Other income."
$11.3M
Net patient income Info Net patient income: net patient revenue minus the home's total operating expenses. A positive figure means it earns more from resident care than it spends to deliver it; a negative figure means the opposite. It excludes non-operating "other income."
-$3.0M
For-profit Corporation
Net patient revenue Info Net patient revenue — what the home actually collects for resident care, after contractual allowances, bad debt and discounts are subtracted from its gross charges (CMS cost report, Worksheet G-3). It covers resident care only; money the home earns from other sources is shown separately as "Other income."
$11.3M Rank #47 / 196Revenue — State benchmarkedThis home is ranked 47th out of 196 homes in Tennessee. Shows this facility's annual revenue compared to the Tennessee average. Higher revenue generally means more resources for staffing and capital — read alongside Payroll %.Rankings are based only on facilities in Tennessee that report data for that category. Facilities without available data are excluded from the ranking.Click the rank badge to see the full State ranking.Click here to see the full State ranking.
Net patient income Info Net patient income: net patient revenue minus the home's total operating expenses. A positive figure means it earns more from resident care than it spends to deliver it; a negative figure means the opposite. It excludes non-operating "other income."
-$3.0M
Other income Info Money the home earns outside of resident care — such as investments, grants, rentals and other non-operating sources (CMS cost report, Worksheet G-3). It is tracked separately from net patient revenue: it is not part of that figure, and it is not included in net patient income.
$2.1M
Payroll costs Info Staff salaries plus wage-related costs — benefits such as payroll taxes, health insurance and retirement — from the home's own accounting records (CMS cost report, Worksheet A). Contract or agency labor is counted separately, under other operating costs. Rank #105 / 196Payroll — State benchmarkedThis home is ranked 105th out of 196 homes in Tennessee. Shows total annual staff payroll benchmarked to the Tennessee average. Higher payroll investment relative to peers often signals better staffing and less reliance on cheaper contract labor.Rankings are based only on facilities in Tennessee that report data for that category. Facilities without available data are excluded from the ranking.Click the rank badge to see the full State ranking.Click here to see the full State ranking.
$5.4M 48.3% of net patient revenue Info Payroll as a share of revenue: staff salaries and wage-related benefits divided by net patient revenue. A higher figure means more of each revenue dollar goes to staff pay. Rank #184 / 196Payroll % — State benchmarkedThis home is ranked 184th out of 196 homes in Tennessee. Shows payroll as a percentage of revenue versus the Tennessee average. Well-run Tennessee facilities typically land around 50–60% — the top third Statewide. Below 25% may signal understaffing or heavy agency use — read with Staffing ratings.Rankings are based only on facilities in Tennessee that report data for that category. Facilities without available data are excluded from the ranking.Click the rank badge to see the full State ranking.Click here to see the full State ranking.
Other operating costs Info Everything it costs to run the home apart from payroll — food, utilities, supplies, maintenance, contract labor and administration. Calculated as total operating expense minus payroll (staff salaries and wage-related benefits).
$8.9M
Total costs Info The home's total operating expense for the year — all the costs of running it, salaries included (CMS cost report, Worksheet G-3).
$14.3M

Who this home usually serves

TYPE OF STAY

Mix of rehab and long-term care

This home supports both short-term rehab and long-term care, with residents staying for a wide range of durations.

Most new residents arrive under private pay (55% of admissions), and a typical private pay stay runs around 1 - 2 months.

Admissions
297 total

Coverage residents most often arrive under.

Medicare 38%
Private pay 55%
Medicaid 7%
Discharges
296 total

Coverage residents most often leave under.

Medicare 38%
Private pay 50%
Medicaid 12%

Places of interest near AHC Clarksville

Address 5.8 miles from city center Info Estimated distance in miles from Clarksville's city center to AHC Clarksville's address, calculated via Google Maps.

Calculate Travel Distance to AHC Clarksville

Add your location

Address

Compare Nursing Homes around Clarksville

The information below is reported by the Tennessee Department of Health, Division of Health Care Facilities.

4 facilities compared · CMS & TN Dept. of Health data

Tennessee State Veterans‘ Home – Clarksville
NH
Clarksville (Arrowood Drive)
108
Facility 108
TN AVG 88
Rank #123 / 426
96.7%
Facility 96.7%
TN AVG 73%
Rank #22 / 319
+32%- -26%-
$0
Facility $0
TN AVG $90.9k
Rank #1 / 198
7
Facility 7
TN AVG 15.4
Rank #34 / 196
2.3
Facility 2.3
TN AVG 4.4
Rank #27 / 196
2100-
0
Facility 0
TN AVG 34
Rank #531 / 553
Tennessee State Veterans' Homes Board
$16.4M
Facility $16.4M
TN AVG $11.5M
Rank #64 / 196
$8.2M
Facility $8.2M
TN AVG $4.6M
Rank #23 / 196
50.2%
Facility 50.2%
TN AVG 41%
Rank #13 / 196
445524
AHC Clarksville
NH
Clarksville
113
Facility 113
TN AVG 88
Rank #115 / 426
91.7%
Facility 91.7%
TN AVG 73%
Rank #49 / 319
+26%
3.06
Facility 3.06
TN AVG 3.63
Rank #152 / 192
-15%-16%
$0
Facility $0
TN AVG $90.9k
Rank #1 / 198
21
Facility 21
TN AVG 15.4
Rank #143 / 196
7.0
Facility 7.0
TN AVG 4.4
Rank #173 / 196
-103-
21
Facility 21
TN AVG 34
Rank #372 / 553
Juanita Dufour
$11.3M
Facility $11.3M
TN AVG $11.5M
Rank #47 / 196
$5.4M
Facility $5.4M
TN AVG $4.6M
Rank #105 / 196
48.3%
Facility 48.3%
TN AVG 41%
Rank #184 / 196
445455
Spring Meadows Health Care Center
NH
MC
Clarksville
32
Facility 32
TN AVG 88
Rank #406 / 426
100.0%
Facility 100.0%
TN AVG 73%
Rank #1 / 319
+37%
3.22
Facility 3.22
TN AVG 3.63
Rank #133 / 192
+34%-11%
$0
Facility $0
TN AVG $90.9k
Rank #1 / 198
23
Facility 23
TN AVG 15.4
Rank #153 / 196
4.6
Facility 4.6
TN AVG 4.4
Rank #108 / 196
6112A+
22
Facility 22
TN AVG 34
Rank #369 / 553
Spring Meadows Retirement Village
$12.1M
Facility $12.1M
TN AVG $11.5M
Rank #86 / 196
$6.3M
Facility $6.3M
TN AVG $4.6M
Rank #68 / 196
52%
Facility 52%
TN AVG 41%
Rank #61 / 196
445402
Signature HealthCARE of Clarksville
NH
RC
Clarksville
46
Facility 46
TN AVG 88
Rank #371 / 426
43.5%
Facility 43.5%
TN AVG 73%
Rank #158 / 319
-40%
3.44
Facility 3.44
TN AVG 3.63
Rank #97 / 192
+44%-5%
$63.1k
Facility $63.1k
TN AVG $90.9k
Rank #172 / 198
12
Facility 12
TN AVG 15.4
Rank #76 / 196
4.0
Facility 4.0
TN AVG 4.4
Rank #82 / 196
190-
17
Facility 17
TN AVG 34
Rank #402 / 553
LP Re I Holdings LLC
$12.1M
Facility $12.1M
TN AVG $11.5M
Rank #63 / 196
$4.3M
Facility $4.3M
TN AVG $4.6M
Rank #98 / 196
35.3%
Facility 35.3%
TN AVG 41%
Rank #159 / 196
445448

Financial Assistance for
Nursing Home in Tennessee

AHC Clarksville is located in Clarksville, Tennessee.
Here are the financial assistance programs available to residents in Tennessee.

Get Financial aid guidance

CHOICES Program

TN Medicaid CHOICES

Age 65+ or disabled
General Tennessee resident, Medicaid-eligible, nursing home-level care need.
Income Limits (2025) ~$2,829/month 300% FBR, individual
Asset Limits $2,000 (individual), $3,000 (couple).
TN

Managed care model; high rural demand.

Benefits
Personal care (5-7 hours/day) Respite (240 hours/year) Adult day care ($65/day) Home modifications ($1,500 avg.)

Tennessee Options for Community Living

TN Options

Age 60+
General Tennessee resident, at risk of nursing home.
Income Limits ~$2,000/month individual, varies
Asset Limits $5,000 individual
TN

Limited funding; rural/urban balance.

Benefits
In-home care (3-5 hours/week) Respite (up to 10 days/year) Transportation (~5 trips/month)

Medicare Savings Program (MSP)

Tennessee Medicare Savings Program

Age 65+ or disabled
General TN resident, Medicare Part A/B.
Income Limits (2025) ~$2,510/month (QMB), ~$3,380/month (SLMB), ~$3,598/month (QI)—individual.
Asset Limits $9,430 (individual), $14,130 (couple).
TN

Three tiers; includes Extra Help for Part D; no waitlist.

Benefits
Covers Part B premiums ($174.70/month) Deductibles ($240/year) Copays (~20%)

Family Caregiver Support Program (FCSP)

Tennessee Family Caregiver Support Program

Age
General Caregivers of 60+ needing care or 55+ caregivers of others; TN resident; functional needs (2+ ADLs).
Income Limits (2025) No strict cap; prioritizes low-income ~$24,980/year
Asset Limits Not assessed; need-based.
TN

Includes grandparent caregivers; high rural demand.

Benefits
Respite (4-6 hours/week or 5 days/year) Adult day care ($60/day) Training Supplies (~$500/year)

VA Aid and Attendance (A&A) and Housebound Benefits

Tennessee VA Aid and Attendance/Housebound

Age 65+ or disabled veteran/spouse
General TN resident, wartime service, need for ADL help (A&A) or homebound.
Income Limits (2025) Net income < ~$1,984/month (veteran with dependent, A&A); pension offsets income.
Asset Limits ~$155,356 net worth limit
TN

High veteran population; supports rural/urban care needs.

Benefits
Cash (~$1,433-$2,642/month veteran, ~$951-$1,318 spouse) for care costs (e.g., in-home, assisted living)

Elderly Nutrition Program

Tennessee Elderly Nutrition Program

Age 60+
General TN resident; no income limit but prioritizes low-income.
Income Limits (2025) None; donations encouraged.
Asset Limits Not assessed.
TN

Serves ~50,000 annually; 200+ congregate sites plus Meals on Wheels.

Benefits
Congregate meals ($5-$7/meal value) at senior centers Home-delivered meals ($5-$7/meal)

Property Tax Relief Program

Tennessee Property Tax Relief Program

Age 65+
General TN resident, homeowner/renter (or widow/er 50+, disabled 18+).
Income Limits (2025) ~$45,000/year household, excludes half of Social Security
Asset Limits Not assessed; income-focused.
TN

Rebates up to $1,000; serves ~100,000 annually.

Benefits
Tax rebates (~$250-$1,000 based on income; e.g., $1,000 if income < $8,000)

Frequently Asked Questions about AHC Clarksville

Is AHC Clarksville in a walkable area?

AHC Clarksville has a walk score of 21. Car-dependent. Most errands require a car, with limited nearby walkable options.

What is the occupancy rate at AHC Clarksville?

AHC Clarksville's occupancy is 91.7%.

Does AHC Clarksville operate as a for-profit or non-profit?

AHC Clarksville is registered as a for-profit.

Are there photos of AHC Clarksville?

Yes — there are 5 photos of AHC Clarksville in the photo gallery on this page.

What is the address of AHC Clarksville?

AHC Clarksville is located at 900 Professional Park Dr, Clarksville, TN 37040.

What is the phone number of AHC Clarksville?

(931) 552-3002 will put you in contact with the team at AHC Clarksville.

Is AHC Clarksville Medicare or Medicaid certified?

Yes — AHC Clarksville is a CMS-certified provider of Medicare and Medicaid.

Guides for Better Senior Living

Care Cost Calculator: See Prices in Your Area

Nursing Home Data Explorer

Don’t Wait Too Long: 7 Red Flag Signs Your Parent Needs Assisted Living Now

The True Cost of Assisted Living in 2025 – And How Families Are Paying For It

Understanding Senior Living Costs: Pricing Models, Discounts & Financial Assistance