Occupancy rate
36%
Indiana average: 69%

We arrange tours, appointments, and even moving support so you don’t have to
Thank you for your interest!
Our team will be in touch shortly to help with next steps.
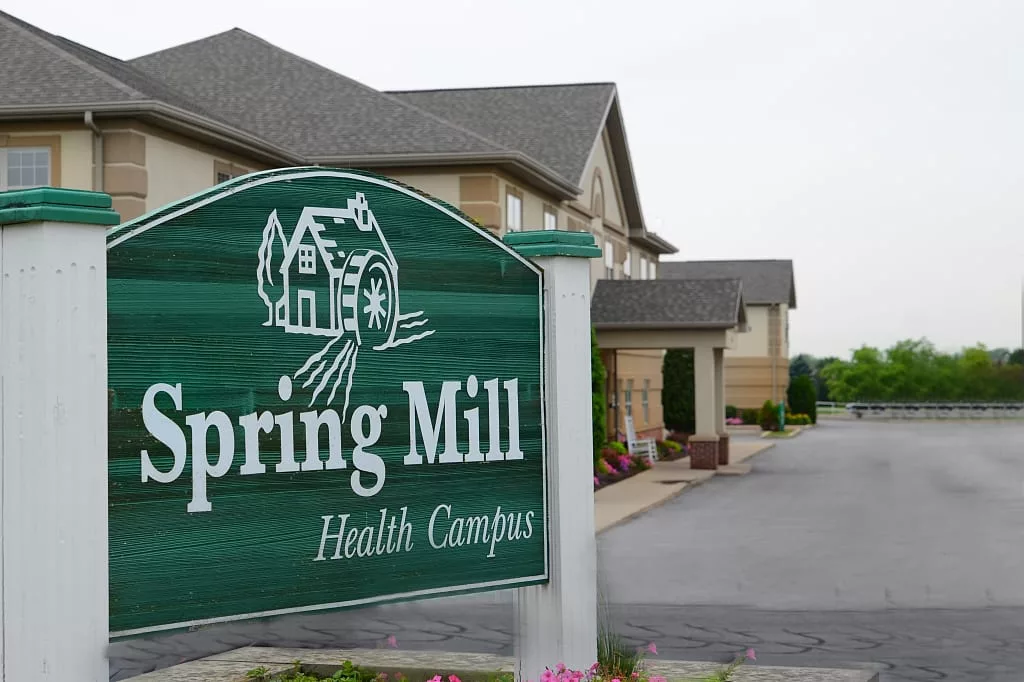

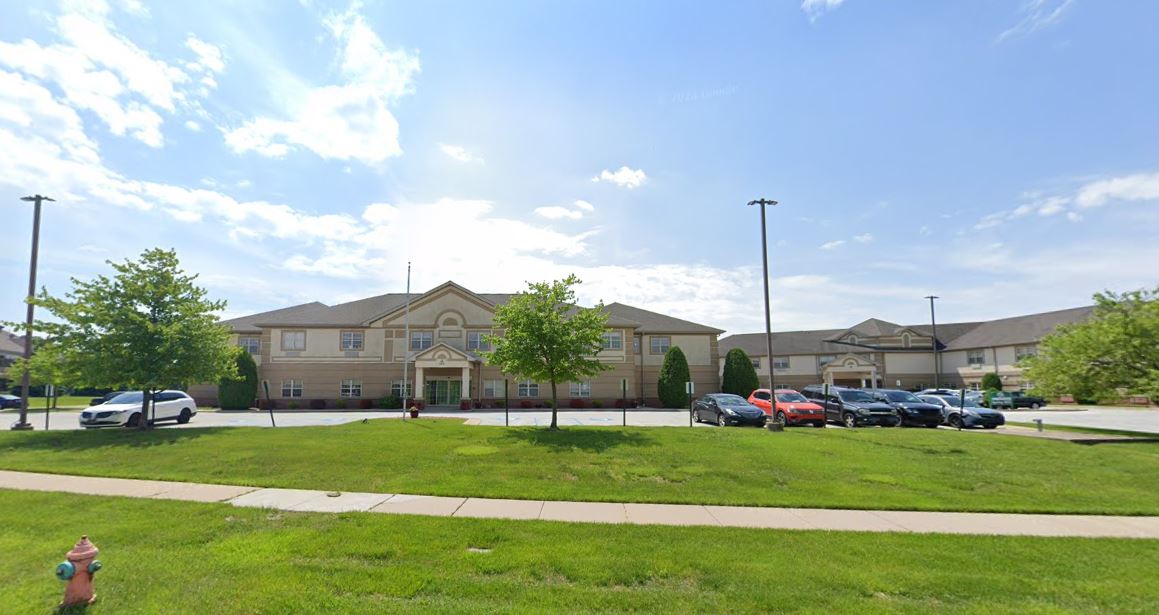


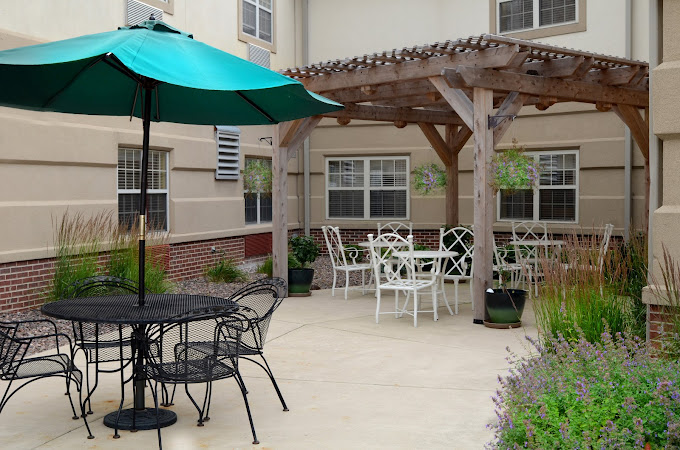

Spring Mill Health Campus provides a unique accommodation for the specific needs of assisted living, memory care, and skilled nursing residents. The upscale community celebrates each individual by promoting an independent lifestyle based on their terms. Seniors feel more comfortable and safe in a community they trust because meaningful relationships are built, and the staff genuinely provides excellent care.
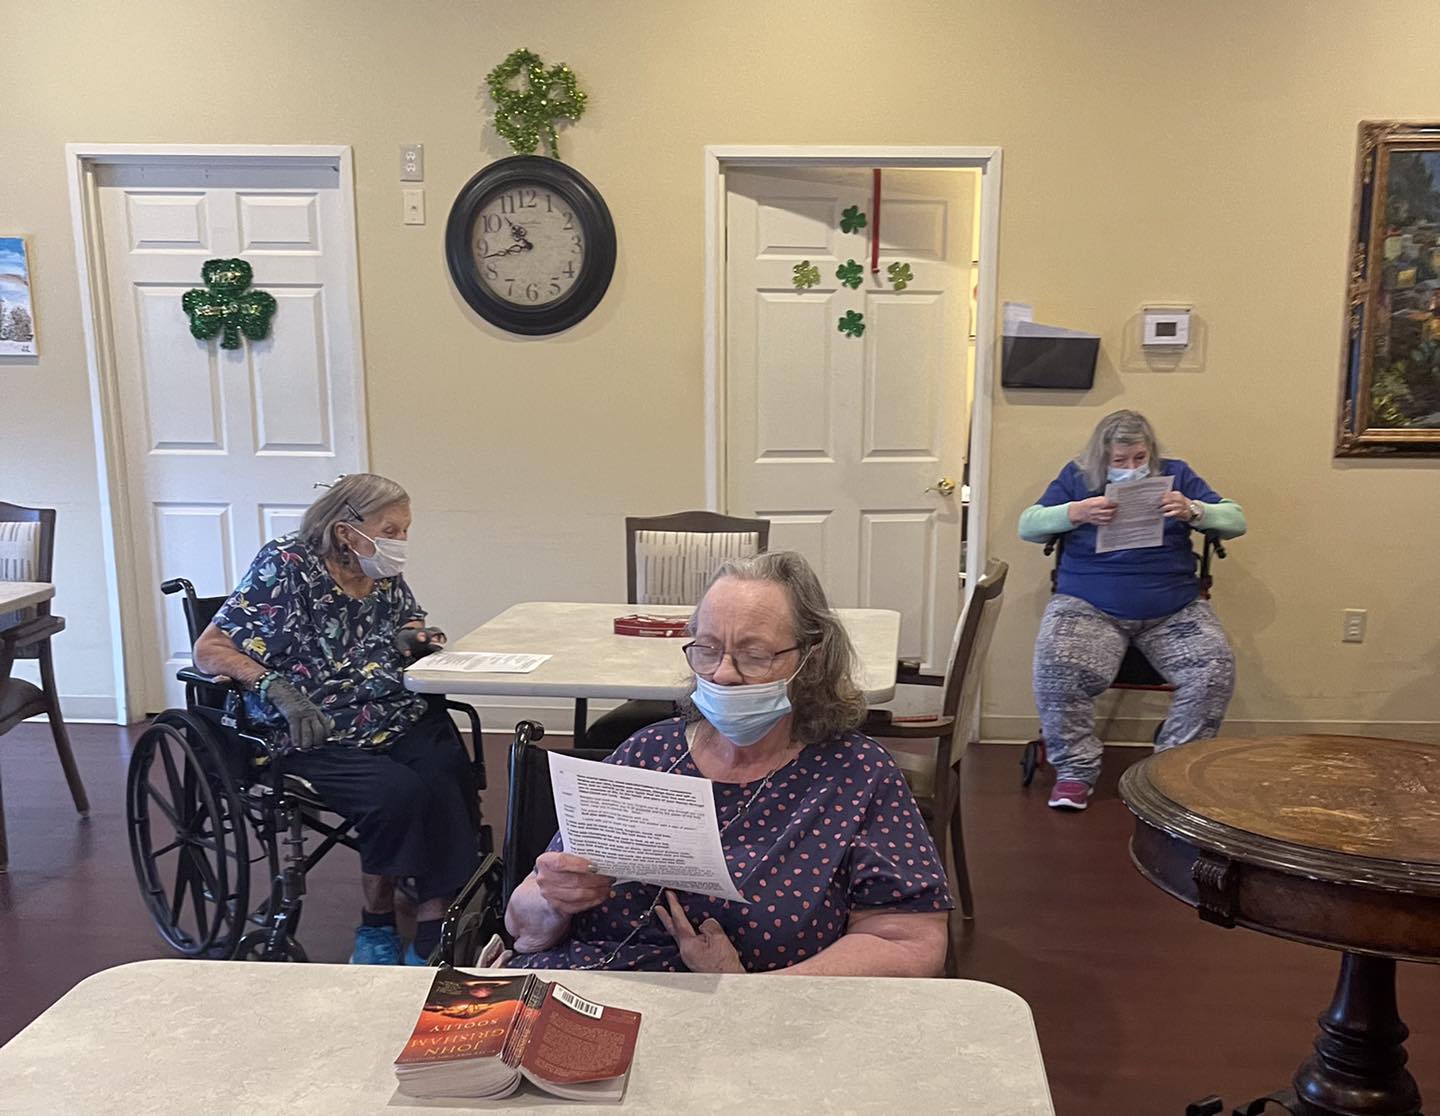
Spring Mill’s residential lifestyle is designed to cultivate growth and security, ensuring residents feel comfortable in their new cozy, home-like environment. A list of essential services offered for assisted living and memory care options includes ADLs, medication management, and stimulating activities. Skilled nursing and rehabilitative residents can experience state-of-the-art technologies that boost their recovery period with specialized medical attention and services.
Offers a balance of services and community atmosphere.
Lower occupancy suggests more openings may be available.
Most residents typically stay for a few weeks or months before returning home or moving on.
80% of new residents, usually for short-term rehab.
12% of new residents, often for short stays.
8% of new residents, often for long-term daily care.
Indiana average: 69%
Spring Mill Health Campus is legally operated by MAJOR HOSPITAL, and administrated by LAKEITHIA WEBB.
Key information about the people who lead and staff this community.
Pets Allowed: Yes, Pets Allowed
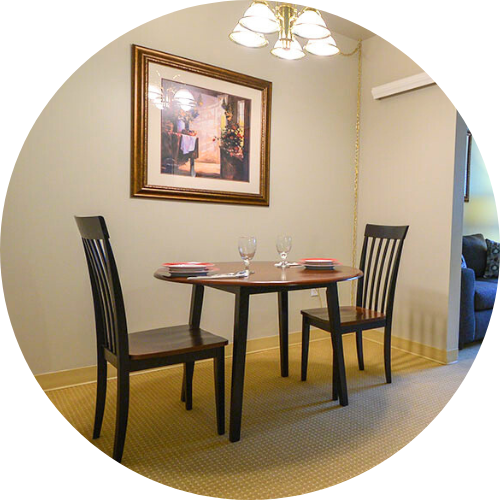
Housing Options: Private Rooms / Semi-Private Rooms
Building Type: Two-story
Transportation Services
Fitness and Recreation
In Indiana, the Department of Health, Division of Long Term Care is the primary regulatory body that performs onsite inspections and quality of care reviews for all licensed facilities.
14 visits/inspections triggered by complaints
3 with citations
6 without citations
Indiana average: 8 complaint visits
Indiana average: 3 inspections with citations
Formal expressions of dissatisfaction or concern made by residents, or their families regarding various aspects of the care, services, and environment provided.
Indiana average: 4 complaints
Citations indicate regulatory violations. A higher number implies the facility had several areas requiring improvement.
Indiana average: 26 citations
Deficiencies indicate regulatory issues. A higher number implies the facility had several areas requiring improvement.
The most recent inspection on April 1, 2025, found no deficiencies related to the complaint investigated. Earlier inspections showed a mixed pattern, with several citations related to resident care issues such as medication management, infection control, and documentation, as well as some Life Safety Code deficiencies involving fire safety and emergency preparedness. Complaint investigations were mostly unsubstantiated, though some were substantiated with deficiencies cited, particularly around care planning, medication orders, and resident rights. No fines, immediate jeopardy findings, or license actions were listed in the available reports. The overall trend suggests some improvement in compliance, with recent complaint investigations showing fewer deficiencies compared to earlier reports.
Indiana average 6
Last Health inspection on Jul 2025
Indiana average 25
Indiana average 4.12
Health citations are formal notices following inspections when they fail to comply with safety and care standards.
36 of 48 citations resulted from standard inspections; and 12 of 48 resulted from complaint investigations.
Indiana average: 0.2
Indiana average: 0.6
Data sourced from CMS Health Deficiencies reports. Citation severity codes range from A (least serious) to L (most serious). Immediate Jeopardy (J-L) citations indicate situations where the facility's noncompliance has placed residents at risk of death or serious harm.
Assisted Living A licensed, long-term care setting for seniors or individuals with disabilities who need help with daily activities — like bathing, dressing, and medication management — but not 24-hour skilled nursing. Offers housing, meals, and around-the-clock support while aiming to maximize resident independence.
Assisted Living A licensed, long-term care setting for seniors or individuals with disabilities who need help with daily activities — like bathing, dressing, and medication management — but not 24-hour skilled nursing. Offers housing, meals, and around-the-clock support while aiming to maximize resident independence.
Memory Care Secured, specialized care for people living with Alzheimer's or dementia. Staff trained in cognitive impairment, with higher staff-to-resident ratios and an environment designed to reduce confusion and wandering risk.
Nursing Home Licensed facility providing 24/7 skilled nursing care for residents with complex, ongoing medical needs. Staffed by RNs, LPNs, and CNAs. Inspected and star-rated annually by CMS. Accepts Medicare (short-term rehab) and Medicaid (long-term care).
Nursing Home Licensed facility providing 24/7 skilled nursing care for residents with complex, ongoing medical needs. Staffed by RNs, LPNs, and CNAs. Inspected and star-rated annually by CMS. Accepts Medicare (short-term rehab) and Medicaid (long-term care).
Assisted Living A licensed, long-term care setting for seniors or individuals with disabilities who need help with daily activities — like bathing, dressing, and medication management — but not 24-hour skilled nursing. Offers housing, meals, and around-the-clock support while aiming to maximize resident independence.
Independent Living Lifestyle-focused communities for older adults offering dining, activities, and transportation with minimal personal care. Best for active, independent seniors who want community without medical support.
Memory Care Secured, specialized care for people living with Alzheimer's or dementia. Staff trained in cognitive impairment, with higher staff-to-resident ratios and an environment designed to reduce confusion and wandering risk.
Assisted Living A licensed, long-term care setting for seniors or individuals with disabilities who need help with daily activities — like bathing, dressing, and medication management — but not 24-hour skilled nursing. Offers housing, meals, and around-the-clock support while aiming to maximize resident independence.
Nursing Home Licensed facility providing 24/7 skilled nursing care for residents with complex, ongoing medical needs. Staffed by RNs, LPNs, and CNAs. Inspected and star-rated annually by CMS. Accepts Medicare (short-term rehab) and Medicaid (long-term care).
Assisted Living A licensed, long-term care setting for seniors or individuals with disabilities who need help with daily activities — like bathing, dressing, and medication management — but not 24-hour skilled nursing. Offers housing, meals, and around-the-clock support while aiming to maximize resident independence.
Memory Care Secured, specialized care for people living with Alzheimer's or dementia. Staff trained in cognitive impairment, with higher staff-to-resident ratios and an environment designed to reduce confusion and wandering risk.
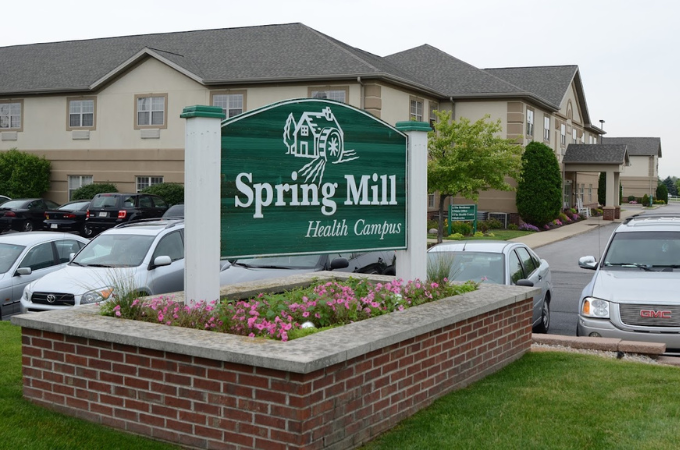
![]() 2.1 miles from city center — 0.17 miles to nearest hospital (Methodist Hospitals Southlake Campus)
2.1 miles from city center — 0.17 miles to nearest hospital (Methodist Hospitals Southlake Campus)
![]() 101 W 87th Ave, Merrillville, IN 46410
101 W 87th Ave, Merrillville, IN 46410
Add your location
This data corresponds to Q2 2025 and is based on CMS Payroll-Based Journal.
Indiana average ratio: 0.00:1
Indiana average: 7.7 hours
Manages medical care and health needs.
No contractors work on this role.
Assists with medical care and medications.
No contractors work on this role.
Helps with daily care and mobility.
No contractors work on this role.
Total hours from contractors
11 contractor hours this quarter
| Certified Nursing Assistant | 52 | 0 | 52 | 8,665 | 91 | 100% | 6.5 |
| Licensed Practical Nurse | 17 | 0 | 17 | 4,661 | 91 | 100% | 7.9 |
| Registered Nurse | 13 | 0 | 13 | 2,696 | 91 | 100% | 7.6 |
| RN Director of Nursing | 6 | 0 | 6 | 1,537 | 69 | 76% | 8 |
| Speech Language Pathologist | 4 | 0 | 4 | 1,248 | 72 | 79% | 7.7 |
| Other Dietary Services Staff | 7 | 0 | 7 | 1,169 | 88 | 97% | 5.6 |
| Physical Therapy Aide | 5 | 0 | 5 | 928 | 70 | 77% | 7.2 |
| Medication Aide/Technician | 3 | 0 | 3 | 831 | 73 | 80% | 7.9 |
| Administrator | 1 | 0 | 1 | 512 | 64 | 70% | 8 |
| Respiratory Therapy Technician | 4 | 0 | 4 | 509 | 70 | 77% | 6.8 |
| Nurse Practitioner | 1 | 0 | 1 | 496 | 62 | 68% | 8 |
| Physical Therapy Assistant | 3 | 0 | 3 | 473 | 65 | 71% | 7.3 |
| Dietitian | 1 | 0 | 1 | 460 | 62 | 68% | 7.4 |
| Qualified Social Worker | 3 | 0 | 3 | 128 | 37 | 41% | 3.3 |
| Occupational Therapy Assistant | 0 | 1 | 1 | 11 | 4 | 4% | 2.8 |
Source: CMS Long-Term Care Facility Characteristics (Data as of Jan 2026)
Residents meet regularly to discuss policies, care quality, and activities
Organized group of residents that meets regularly to discuss facility policies, quality of life, and activities.
Data sourced from CMS Long-Term Care Facility Characteristics quarterly report. Payer mix reflects the current resident census by primary payment source.
These measures show how residents usually do over time at this home, based on health outcomes and preventive care.
Indiana average: 8.0
Indiana average: 17.1
Indiana average: 12.0%
Indiana average: 14.4%
Indiana average: 24.6%
Indiana average: 3.9%
Indiana average: 4.4%
Indiana average: 1.2%
Indiana average: 5.7%
Indiana average: 24.1%
Indiana average: 12.4%
Indiana average: 93.7%
Indiana average: 95.4%
Indiana average: 1.60
Indiana average: 1.48
Indiana average: 81.7%
Indiana average: 1.4%
Indiana average: 79.0%
Indiana average: 22.4%
Indiana average: 10.5%
Indiana average: 0.8%
Indiana average: 53.7%
Indiana average: 50.6%
Quality measures are calculated from Minimum Data Set (MDS) assessments. For most measures, lower percentages indicate better care quality.
Historical financial and operational data for Spring Mill Health Campus based on CMS SNF Cost Reports.
Loading trend charts...
Care Cost Calculator: See Prices in Your Area
Nursing Home Data Explorer
Don’t Wait Too Long: 7 Red Flag Signs Your Parent Needs Assisted Living Now
The True Cost of Assisted Living in 2025 – And How Families Are Paying For It
Understanding Senior Living Costs: Pricing Models, Discounts & Financial Assistance

Touring a community? Use this expert-backed checklist to stay organized, ask the right questions, and find the perfect fit.
We'll send you a PDF version of the touring checklist.