


Total staff
197
Employees
197
Contractors
0
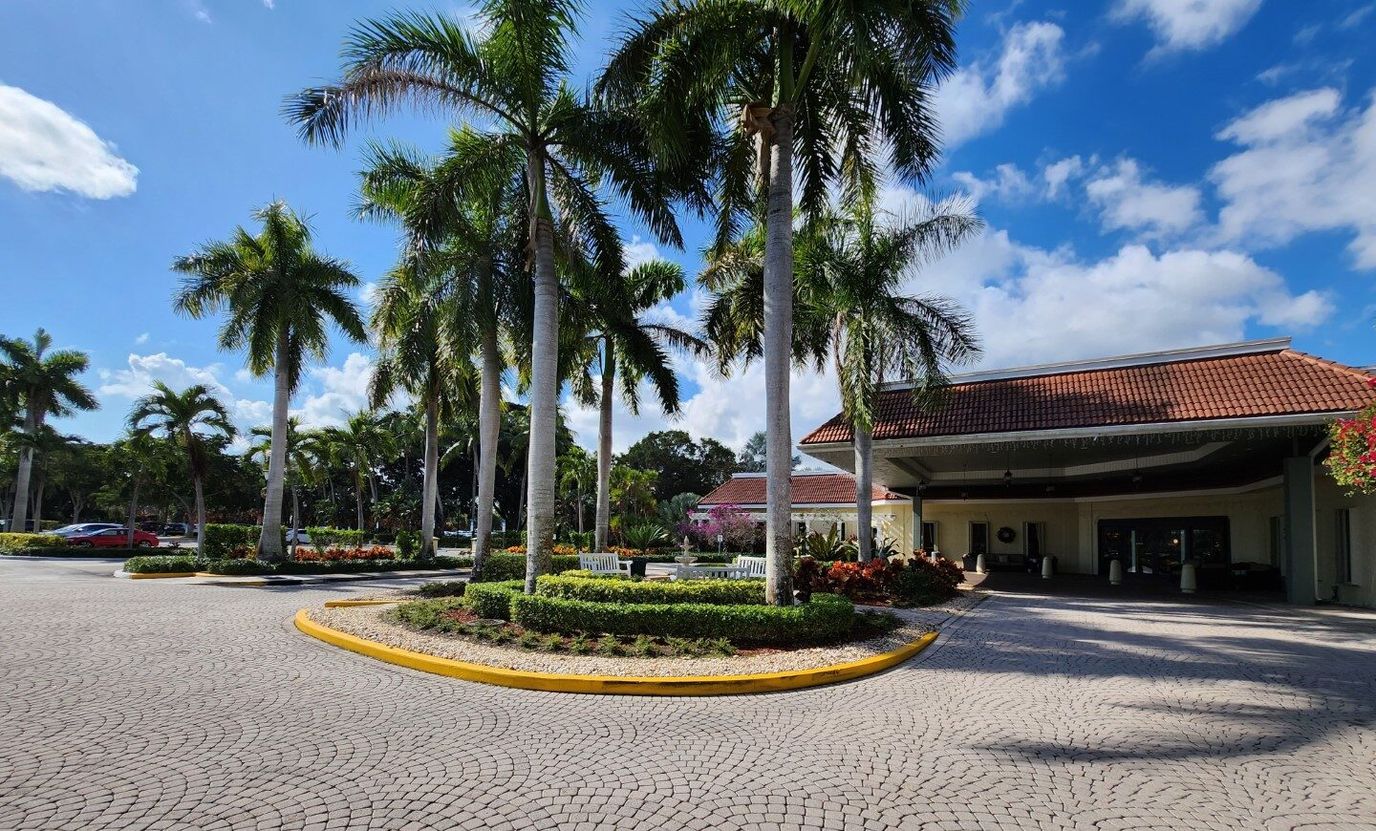
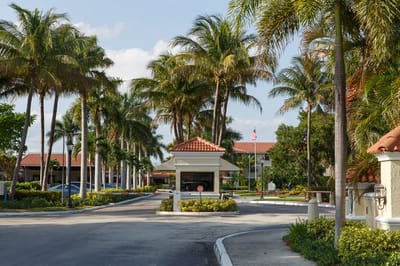
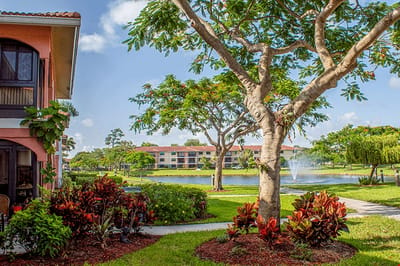
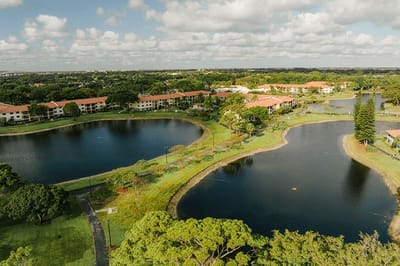
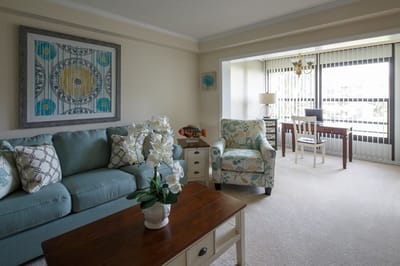
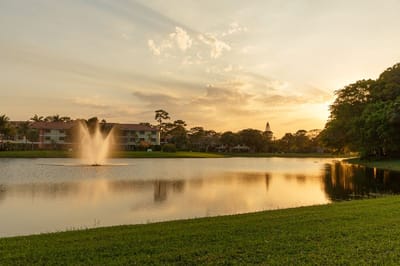
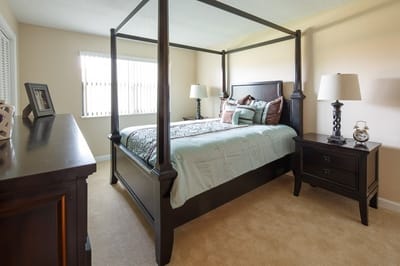
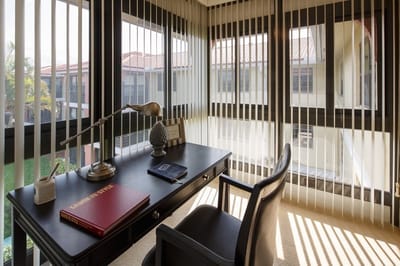
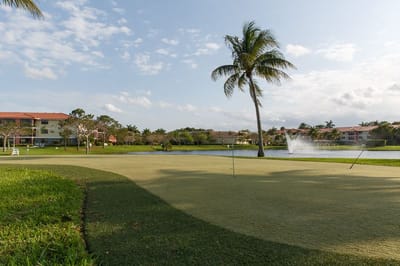
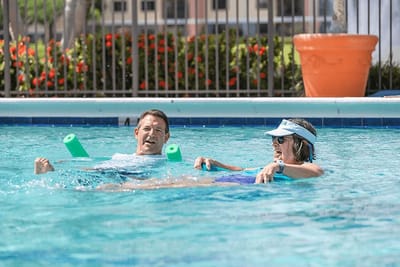
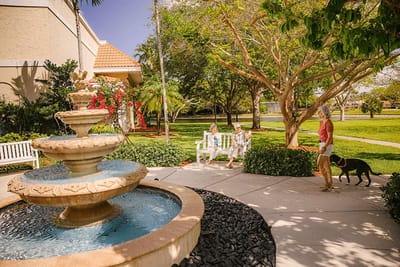


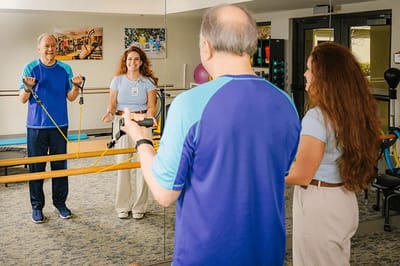


Conveniently set in the harmonious neighborhood of Boca Raton, FL, St. Andrews Estates is an exceptional community that offers independent living. The community also features Acts Life Care to provide residents with assisted living and skilled nursing. Residents enjoy a hassle-free living, as home maintenance and other chores are taken care of.
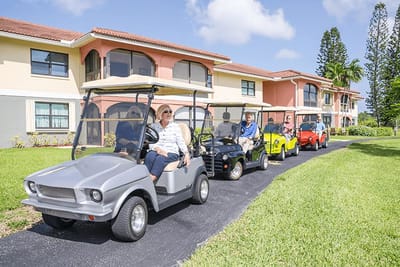
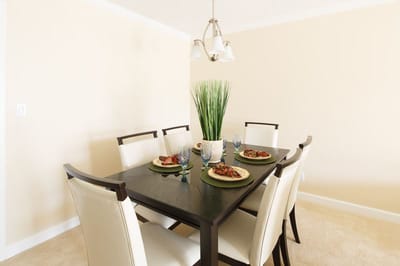
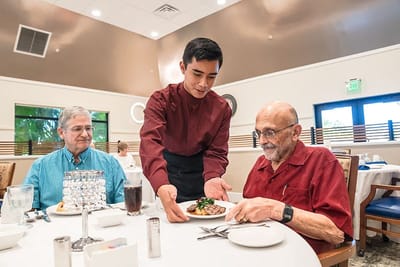
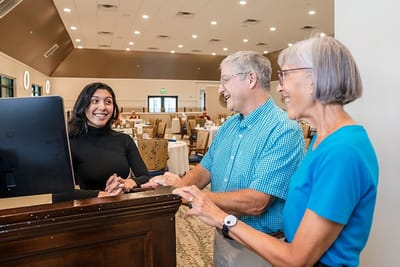
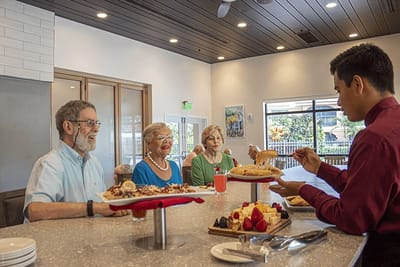
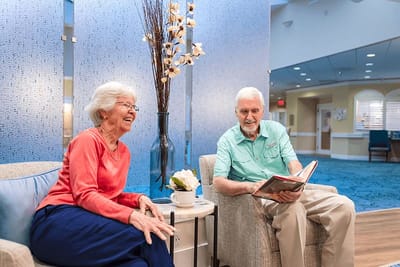
With a thoughtfully curated calendar of exciting events and stimulating programs, residents are encouraged to live an active and vibrant lifestyle. Mealtimes promote social interactions and satisfy dietary needs with delicious and healthy dining options. The community is ideal for those aiming to downsize in retirement, especially with its comprehensive services and extensive amenities.
| Staff type | Hours / Day / Resident | vs state avg |
|---|---|---|
|
Registered Nurse (RN)
| 43m per day | ▼ 3% State avg: 44m per day · National avg: 41m per day |
|
LPN / LVN
| 45m per day | ▼ 6% State avg: 47m per day · National avg: 52m per day |
|
Nurse Aide
| 2h 10m per day | ▼ 7% State avg: 2h 20m per day · National avg: 2h 20m per day |
|
Weekend Total Nursing
| 3h 15m per day | ▼ 8% State avg: 3h 32m per day · National avg: 3h 27m per day |
|
Physical Therapist
| 7m per day | ▲ 27% State avg: 6m per day · National avg: 4m per day |
|
Weekend RN
| 28m per day | ▼ 14% State avg: 32m per day · National avg: 29m per day |
Reporting period: October 1 – December 31, 2025 (Q4 2025). Source: CMS Payroll-Based Journal report.
Manages medical care and health needs.
Assists with medical care and medications.
Helps with daily care and mobility.
| Certified Nursing Assistant | 79 | 0 | 79 | 34,783 | 92 | 100% | 7.9 |
| Licensed Practical Nurse | 30 | 0 | 30 | 11,925 | 92 | 100% | 7.8 |
| Registered Nurse | 28 | 0 | 28 | 7,151 | 92 | 100% | 8.3 |
| Clinical Nurse Specialist | 8 | 0 | 8 | 3,775 | 89 | 97% | 7.6 |
| Dietitian | 7 | 0 | 7 | 3,312 | 92 | 100% | 8 |
| Occupational Therapy Aide | 9 | 0 | 9 | 3,058 | 91 | 99% | 7.4 |
| Respiratory Therapy Technician | 7 | 0 | 7 | 1,937 | 71 | 77% | 7.3 |
| Physical Therapy Assistant | 4 | 0 | 4 | 1,693 | 90 | 98% | 7 |
| Physical Therapy Aide | 8 | 0 | 8 | 1,557 | 89 | 97% | 6.9 |
| Mental Health Service Worker | 3 | 0 | 3 | 1,496 | 86 | 93% | 8 |
| Speech Language Pathologist | 6 | 0 | 6 | 1,489 | 92 | 100% | 6.7 |
| Qualified Activities Professional | 2 | 0 | 2 | 772 | 91 | 99% | 8.5 |
| Administrator | 1 | 0 | 1 | 520 | 65 | 71% | 8 |
| Nurse Practitioner | 1 | 0 | 1 | 440 | 55 | 60% | 8 |
| Qualified Social Worker | 2 | 0 | 2 | 352 | 64 | 70% | 5.5 |
| Other Social Services Staff | 2 | 0 | 2 | 99 | 13 | 14% | 7.1 |
Federal penalties imposed by CMS for regulatory violations, including civil money penalties (fines) and denials of payment for new Medicare/Medicaid admissions.
Source: CMS Penalties Database
No penalties in the past 3 years
No civil money penalties or payment denials were reported in the last 3 years.
These measures show how residents usually do over time at this home, based on health outcomes and preventive care.
Florida average: 7.4
Florida average: 12.4
Florida average: 10.5%
Florida average: 12.9%
Florida average: 13.5%
Florida average: 2.6%
Florida average: 5.4%
Florida average: 0.9%
Florida average: 6.0%
Florida average: 3.3%
Florida average: 8.0%
Florida average: 97.7%
Florida average: 99.2%
Florida average: 94.0%
Florida average: 1.5%
Florida average: 94.7%
Quality measures are calculated from Minimum Data Set (MDS) assessments. For most measures, lower percentages indicate better care quality.
51% of new residents, usually for short-term rehab.
36% of new residents, often for short stays.
13% of new residents, often for long-term daily care.
Source: CMS Long-Term Care Facility Characteristics (Data as of Jan 2026)
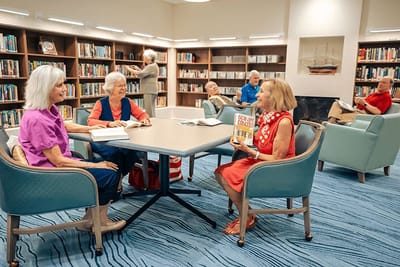
Residents meet regularly to discuss policies, care quality, and activities
Organized group of residents that meets regularly to discuss facility policies, quality of life, and activities.
Data sourced from CMS Long-Term Care Facility Characteristics quarterly report. Payer mix reflects the current resident census by primary payment source.
Historical financial and operational data for St. Andrews Estates from 2011–2023, based on CMS SNF Cost Reports.
Based on CMS SNF Cost Report for fiscal year ending in 12/2023.
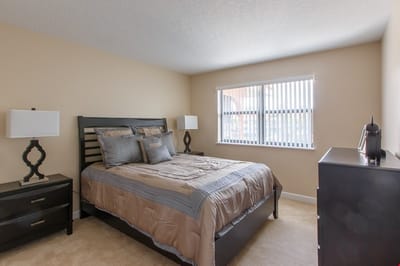
Housing Options: Studio / 1 Bed / 2 Bed
Building Type: 3-story
Swimming Pool
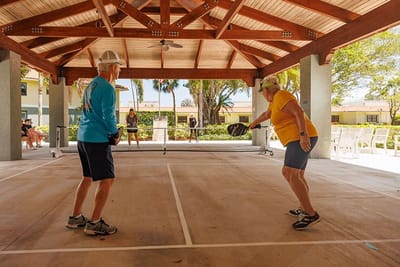
Exercise Programs
Social and Recreational Activities
Most residents typically stay for a few weeks or months before returning home or moving on.
Most new residents arrive under Medicare (51% of admissions), and a typical Medicare stay runs around 1 - 2 months.
Coverage residents most often arrive under.
Coverage residents most often leave under.
![]() 1.6 miles from city center
1.6 miles from city center
![]() Estimated distance in miles from Boca Raton's city center to St. Andrews Estates's address, calculated via Google Maps.
Estimated distance in miles from Boca Raton's city center to St. Andrews Estates's address, calculated via Google Maps.
Add your location
| St. Andrews Estates | IL NH | Boca Raton | - | 180
Facility
180
FL AVG
89
Rank
#56 / 1074 | - |
63
Facility
63
FL AVG
40
Rank
#309 / 1486 | Studio / 1 Bed / 2 Bed |
| Stratford Court of Boca Pointe | IL NH AL MC | Boca Raton (Boca Del Mar) | - | 60
Facility
60
FL AVG
89
Rank
#695 / 1074 | - |
33
Facility
33
FL AVG
40
Rank
#864 / 1486 | 1 Bed / 2 Bed |
| Edgewater at Boca Pointe | IL NH | Boca Raton (Boca Del Mar) | - | 60
Facility
60
FL AVG
89
Rank
#695 / 1074 | - |
22
Facility
22
FL AVG
40
Rank
#1056 / 1486 | 1 Bed / 2 Bed |
St. Andrews Estates is located in Boca Raton, Florida.
Here are the financial assistance programs available to residents in Florida.
St. Andrews Estates has a walk score of 63. Moderately walkable. Some errands can be accomplished on foot, with a mix of nearby amenities.
St. Andrews Estates's occupancy is 93.9%.
Yes — see the floorplan options available at St. Andrews Estates on this page.
St. Andrews Estates is registered as a for-profit.
Yes — there are 29 photos of St. Andrews Estates in the photo gallery on this page.
St. Andrews Estates is located at 6045 Verde Trail S, Boca Raton, FL 33433.
(561) 487-6200 will put you in contact with the team at St. Andrews Estates.
Care Cost Calculator: See Prices in Your Area
Nursing Home Data Explorer
Don’t Wait Too Long: 7 Red Flag Signs Your Parent Needs Assisted Living Now
The True Cost of Assisted Living in 2025 – And How Families Are Paying For It
Understanding Senior Living Costs: Pricing Models, Discounts & Financial Assistance


