St. Ann‘s Skilled Nursing & Therapy
CMS overall rating Info CMS (the Centers for Medicare & Medicaid Services) is the federal agency that rates nursing home quality. Its Overall Rating runs from 1 to 5 stars, combining health inspections, staffing, and quality measures, with inspections weighted most heavily.

St. Ann‘s Skilled Nursing & Therapy

CMS overall rating Info CMS (the Centers for Medicare & Medicaid Services) is the federal agency that rates nursing home quality. Its Overall Rating runs from 1 to 5 stars, combining health inspections, staffing, and quality measures, with inspections weighted most heavily.
Calculator: See prices in your area
St. Ann‘s Skilled Nursing & Therapy accepts Medicare, Medicaid, and private pay.

Overview of St. Ann‘s Skilled Nursing & Therapy

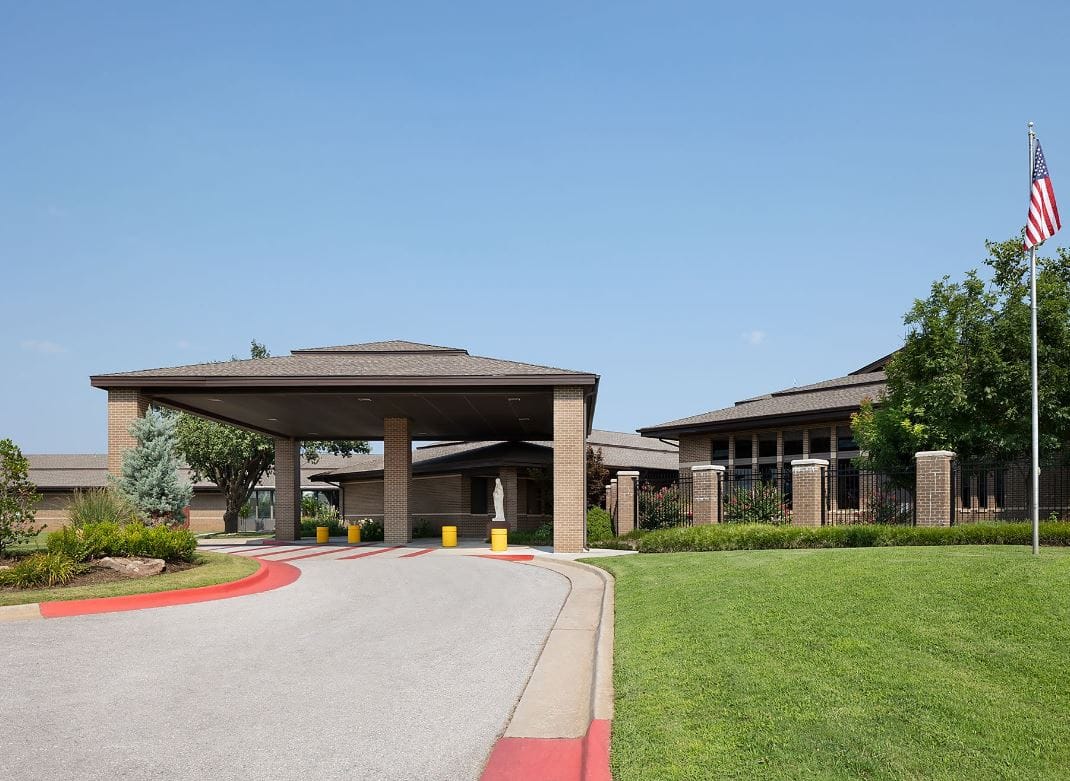
Settling in the quiet St. Ann Drive, Oklahoma City, OK is the distinct senior living community of St. Ann’s Skilled Nursing and Therapy that provides long-term care, skilled nursing, and therapy. With its long history of caring since 1949, the community is dedicated to improving seniors’ well-being by delivering top-tier care and assistance around the clock. Keep worries at bay with a team of kind and highly trained professionals lending extra support for seniors’ ever-changing needs.

Featuring a wide range of care services, residents and families can ease their minds knowing their loved ones are well-cared for. The community prepares meals according to residents’ nutritional requirements and tastes to ensure a delightful dining experience. St. Ann’s Skilled Nursing and Therapy is a good place to start your healing journey with its exceptional services and purposely designed amenities.

Quality ratings

Measured by Centers for Medicare & Medicaid Services (CMS)

Overall rating Info The Overall CMS Rating combines results from health inspections, staffing levels and quality measures. Health inspections carry the most weight. Staffing and quality scores can increase or decrease the final rating based on performance compared to state and national standards.
Health Inspection Info Based on the results of the facility's three most recent standard inspections and any complaint investigations. CMS reviews the number, scope, and severity of deficiencies, with more recent findings weighted more heavily.
Staffing Info Measures average nursing staff hours per resident per day, including Registered Nurses (RNs) and total nursing staff. Ratings are adjusted based on the level of care residents require and are compared to state and national benchmarks.
Quality Measures Info Based on clinical and physical health indicators reported to CMS, such as hospital readmissions, falls, pressure ulcers, and improvements in mobility. These measures reflect how well residents' health needs are being managed.

Staffing hours breakdown

Info Daily nursing hours per resident by staff type, reported to CMS. Higher is generally better — compare this facility to state and national averages to see where staffing stands.

Hours per resident per day — compared to state averages

Total nursing care / resident Info Total adjusted nursing hours per resident per day, combining RN, LPN, and aide time. CMS adjusts this for case-mix so facilities can be fairly compared.
4h 51m per day
Rank #18 / 51Nurse hours — State benchmarkedThis home is ranked 18th out of 51 homes in Oklahoma. Shows adjusted nurse hours per resident per day benchmarked to the Oklahoma average, with a ranking across 51 Oklahoma facilities. More hours mean more direct care. The national average is about 3.5 hrs; below 3.0 is a red flag.Rankings are based only on facilities in Oklahoma that report data for that category. Facilities without available data are excluded from the ranking.Click the rank badge to see the full State ranking.Click here to see the full State ranking.
vs avg

1 of 6 metrics below state avg

Standout metric Physical Therapist is +58% above state avg
Staff typeHours / Day / Residentvs state avg
Registered Nurse (RN) Info RNs hold the highest nursing license and can assess residents, interpret test results, and direct care plans. More RN hours per day often signals stronger clinical oversight and faster response to health changes. 23m per day ▲ 13% State avg: 20m per day · National avg: 41m per day
LPN / LVN Info Licensed Practical Nurses (LPNs) or Licensed Vocational Nurses (LVNs) deliver routine hands-on care — medication administration, wound dressing, and monitoring vital signs. They work under RN supervision and make up a large share of daily bedside care. 56m per day ■ Avg State avg: 56m per day · National avg: 52m per day
Nurse Aide Info Certified Nurse Aides (CNAs) provide the most direct day-to-day assistance: bathing, dressing, feeding, and mobility. Nurse aide hours are typically the largest staffing category and directly affect residents' quality of life. 2h 26m per day ▼ 5% State avg: 2h 34m per day · National avg: 2h 21m per day
Weekend Total Nursing Info Combined nursing hours (RN + LPN + Nurse Aide) per resident per day on weekends. Staffing often drops on weekends — this figure reveals whether the facility maintains adequate coverage outside of weekday hours. 3h 30m per day ■ Avg State avg: 3h 29m per day · National avg: 3h 26m per day
Physical Therapist Info Hours per resident per day provided by licensed Physical Therapists (PTs) or PT Assistants. PT services help residents recover mobility after injury or illness and are especially important for post-acute (short-stay) rehabilitation. 2m per day ▲ 58% State avg: 1m per day · National avg: 4m per day
Weekend RN Info Registered nurse hours specifically on weekends. Facilities sometimes reduce RN presence on Saturdays and Sundays — a low weekend RN figure compared to weekday hours can indicate reduced clinical oversight when most administrative staff are absent. 17m per day ■ Avg State avg: 17m per day · National avg: 29m per day

Capacity and availability

This home is often near full

Higher occupancy than the state average
Occupancy rate
124.1% Rank #1 / 132Occupancy rate — State benchmarkedThis home is ranked 1st out of 132 homes in Oklahoma. Shows this facility's occupancy rate versus the Oklahoma average, with its Statewide rank out of 132. Higher occupancy signals strong local demand and financial stability.Rankings are based only on facilities in Oklahoma that report data for that category. Facilities without available data are excluded from the ranking.Click the rank badge to see the full State ranking.Click here to see the full State ranking.
Avg. Length of Stay
75 days
Bed community size
120-bed community Rank #15 / 141Bed count — State benchmarkedThis home is ranked 15th out of 141 homes in Oklahoma. Shows this facility's certified or reported bed count compared to other Oklahoma facilities. Larger communities may offer more amenities, programs, and on-site services for residents and families.Rankings are based only on facilities in Oklahoma that report data for that category. Facilities without available data are excluded from the ranking.Click the rank badge to see the full State ranking.Click here to see the full State ranking.
A larger shared setting that may offer more common spaces and organized community services.
Walk Score
Walk Score: 28 / 100 Rank #131 / 208Walk Score — State benchmarkedThis home is ranked 131st out of 208 homes in Oklahoma. Shows how walkable this facility's neighborhood is compared to the average Walk Score across Oklahoma facilities. Higher scores benefit residents, families, and staff.Rankings are based only on facilities in Oklahoma that report data for that category. Facilities without available data are excluded from the ranking.Click the rank badge to see the full State ranking.Click here to see the full State ranking.
Somewhat walkable. A few nearby services may be reachable on foot, but most trips require transportation.

Contact St. Ann‘s Skilled Nursing & Therapy

Staffing Data

Reporting period: October 1 – December 31, 2025 (Q4 2025). Source: CMS Payroll-Based Journal report.

Total staff 185
Employees 130
Contractors 55
Staff to resident ratio 1.73 : 1
0% compared with State average

State average ratio: 0 : 0

Avg staff/day 59
Average shift 7.9 hours
0% compared with State average

State average: 0 hours

Total staff hours (quarter) 43,144

Nursing staff breakdown

Q4 2025 · Oct 1 – Dec 31 More info This data comes from the CMS Payroll-Based Journal report covering October 1 – December 31, 2025.
Registered Nurse

Manages medical care and health needs.

RN Staff Info All 16 RN Staff are full-time employees. No contractors work on this role. 16
Average shift length Info Average shift length. Calculated as total hours divided by days worked and average staff per day. 8.2 hours
Licensed Practical Nurse

Assists with medical care and medications.

LPN Staff Info All 28 LPN Staff are full-time employees. No contractors work on this role. 28
Average shift length Info Average shift length. Calculated as total hours divided by days worked and average staff per day. 8.2 hours
Certified Nursing Assistant

Helps with daily care and mobility.

CNA Staff Info All 48 CNA Staff are full-time employees. No contractors work on this role. 48
Average shift length Info Average shift length. Calculated as total hours divided by days worked and average staff per day. 8.8 hours

Contractor staffing

Q4 2025 · Oct 1 – Dec 31 More info This data comes from the CMS Payroll-Based Journal report covering October 1 – December 31, 2025.

Total hours from contractors

8.6%

3,708 contractor hours this quarter

Therapeutic Recreation Specialist: 16 Respiratory Therapy Technician: 9 Respiratory Therapist: 9 Physical Therapy Assistant: 8 Occupational Therapy Assistant: 7 Qualified Social Worker: 6

Staff by category

Q4 2025 · Oct 1 – Dec 31 More info This data comes from the CMS Payroll-Based Journal report covering October 1 – December 31, 2025.
Certified Nursing Assistant4804816,55292100%8.8
Medication Aide/Technician260267,78092100%7.9
Licensed Practical Nurse280286,93792100%8.2
Registered Nurse160163,28392100%8.2
RN Director of Nursing5052,3866672%8.1
Dietitian2021,0168390%7.9
Qualified Social Worker1679296975%7.2
Therapeutic Recreation Specialist016169198188%4.8
Respiratory Therapist19108647379%5.9
Administrator1015286672%8
Occupational Therapy Assistant0774885762%8
Nurse Practitioner1014806065%8
Mental Health Service Worker1014335762%7.6
Physical Therapy Assistant0882846470%4.1
Respiratory Therapy Technician0992657784%1.9
48 Certified Nursing Assistant
% of Days 100%
26 Medication Aide/Technician
% of Days 100%
28 Licensed Practical Nurse
% of Days 100%
16 Registered Nurse
% of Days 100%
5 RN Director of Nursing
% of Days 72%
2 Dietitian
% of Days 90%
7 Qualified Social Worker
% of Days 75%
16 Therapeutic Recreation Specialist
% of Days 88%
10 Respiratory Therapist
% of Days 79%
1 Administrator
% of Days 72%
7 Occupational Therapy Assistant
% of Days 62%
1 Nurse Practitioner
% of Days 65%
1 Mental Health Service Worker
% of Days 62%
8 Physical Therapy Assistant
% of Days 70%
9 Respiratory Therapy Technician
% of Days 84%

Penalties and fines

Federal penalties imposed by CMS for regulatory violations, including civil money penalties (fines) and denials of payment for new Medicare/Medicaid admissions.

Source: CMS Penalties Database

No penalties in the past 3 years

No civil money penalties or payment denials were reported in the last 3 years.

Quality of care over time

These measures show how residents usually do over time at this home, based on health outcomes and preventive care.

High-risk clinical events score Info A composite score based on pressure ulcers, falls with injury, weight loss, walking ability decline, and activities of daily living decline. 6.5
26% better than State average

State average: 8.9

Functional decline score Info A composite score based on activities of daily living decline, walking ability decline, and incontinence. 12.9
21% better than State average

State average: 16.3

Long-stay resident measures
Significantly above average State avg: 3.7 Info CMS star rating based on long-stay quality measure performance. 5 stars = significantly above average, 1 star = significantly below average.
Need for Help with Daily Activities Increased Info Percent of long-stay residents whose need for help with daily activities has increased 7.2%
50% better than State average

State average: 14.4%

Walking Ability Worsened Info Percent of long-stay residents whose ability to move independently worsened 11.9%
29% better than State average

State average: 16.8%

Low Risk Residents with Bowel/Bladder Incontinence Info Percent of low risk long-stay residents who lose control of their bowels or bladder 19.6%
10% worse than State average

State average: 17.8%

Falls with Major Injury Info Percent of long-stay residents experiencing one or more falls with major injury 4.7%
7% worse than State average

State average: 4.4%

High Risk Residents with Pressure Ulcers Info Percent of long-stay high risk residents with pressure ulcers 7.4%
42% worse than State average

State average: 5.2%

Urinary Tract Infection Info Percent of long-stay residents with a urinary tract infection 0.6%
80% better than State average

State average: 3.0%

Lost Too Much Weight Info Percent of long-stay residents who lose too much weight 1.5%
59% better than State average

State average: 3.7%

Depressive Symptoms Info Percent of long-stay residents who have depressive symptoms 0.0%
100% better than State average

State average: 3.3%

Antipsychotic Use Info Percent of long-stay residents who received an antipsychotic medication 6.4%
58% better than State average

State average: 15.5%

Pneumococcal Vaccine Info Percent of long-stay residents assessed and appropriately given the pneumococcal vaccine 100.0%
10% better than State average

State average: 90.6%

Influenza Vaccine Info Percent of long-stay residents assessed and appropriately given the seasonal influenza vaccine 97.8%
In line with State average

State average: 94.6%

Hospitalizations per 1,000 days Info Number of hospitalizations per 1,000 long-stay resident days. 1.72
25% better than State average

State average: 2.28

ED visits per 1,000 days Info Number of outpatient emergency department visits per 1,000 long-stay resident days. 3.04
In line with State average

State average: 2.91

Short-stay resident measures
Below average State avg: 2.9 Info CMS star rating based on short-stay quality measure performance. 5 stars = much above average, 1 star = much below average.
Pneumococcal Vaccine Info Percent of short-stay residents assessed and appropriately given the pneumococcal vaccine 99.4%
33% better than State average

State average: 75.0%

Antipsychotic medication increase Info Percent of short-stay residents who newly received an antipsychotic medication 0.6%
69% better than State average

State average: 2.0%

Influenza Vaccine Info Percent of short-stay residents assessed and appropriately given the seasonal influenza vaccine 84.8%
15% better than State average

State average: 74.0%

Re-hospitalized after SNF stay Info Percentage of short-stay residents who were re-hospitalized after their nursing home admission. 33.9%
26% worse than State average

State average: 27.0%

Emergency department visits Info Percentage of short-stay residents who had an outpatient emergency department visit. 19.7%
15% worse than State average

State average: 17.1%

Falls with major injury Info Percentage of SNF residents who experience falls with major injury during their stay. 1.9%
147% worse than State average

State average: 0.8%

Ability to care for self at discharge Info Percentage of residents at or above expected ability to care for themselves at discharge. 50.0%
7% worse than State average

State average: 53.7%

Successful return to home or community Info Rate of successful return to home or community from a skilled nursing facility. 49.8%
In line with State average

State average: 50.6%

Breakdown by payment type

Medicare

28% of new residents, usually for short-term rehab.

Typical stay 27 days

Private pay

52% of new residents, often for short stays.

Typical stay 1 - 2 months

Medicaid

20% of new residents, often for long-term daily care.

Typical stay 10 months

Facility Characteristics

Source: CMS Long-Term Care Facility Characteristics (Data as of Jan 2026)

Total residents 107
Medicare
7
6.5% of residents
Medicaid
69
64.5% of residents
Private pay or other
31
29% of residents
Programs & Services
Residents Group

Residents meet regularly to discuss policies, care quality, and activities

Nurse Aide Training

State-approved Nurse Aide Training and Competency Evaluation Program on-site

CCRC

Part of a Continuing Care Retirement Community offering multiple care levels

Active Resident Council

Organized group of residents that meets regularly to discuss facility policies, quality of life, and activities.

Finances and operations

Based on CMS SNF Cost Report for fiscal year ending in 12/2023.

For-profit
Operated by a business corporation.
Net patient revenue Info Net patient revenue — what the home actually collects for resident care, after contractual allowances, bad debt and discounts are subtracted from its gross charges (CMS cost report, Worksheet G-3). It covers resident care only; money the home earns from other sources is shown separately as "Other income."
$10.1M
Net patient income Info Net patient income: net patient revenue minus the home's total operating expenses. A positive figure means it earns more from resident care than it spends to deliver it; a negative figure means the opposite. It excludes non-operating "other income."
-$60.0K
For-profit Operated by a business corporation.
Net patient revenue Info Net patient revenue — what the home actually collects for resident care, after contractual allowances, bad debt and discounts are subtracted from its gross charges (CMS cost report, Worksheet G-3). It covers resident care only; money the home earns from other sources is shown separately as "Other income."
$10.1M Rank #24 / 55Revenue — State benchmarkedThis home is ranked 24th out of 55 homes in Oklahoma. Shows this facility's annual revenue compared to the Oklahoma average. Higher revenue generally means more resources for staffing and capital — read alongside Payroll %.Rankings are based only on facilities in Oklahoma that report data for that category. Facilities without available data are excluded from the ranking.Click the rank badge to see the full State ranking.Click here to see the full State ranking.
Net patient income Info Net patient income: net patient revenue minus the home's total operating expenses. A positive figure means it earns more from resident care than it spends to deliver it; a negative figure means the opposite. It excludes non-operating "other income."
-$60.0K
Other income Info Money the home earns outside of resident care — such as investments, grants, rentals and other non-operating sources (CMS cost report, Worksheet G-3). It is tracked separately from net patient revenue: it is not part of that figure, and it is not included in net patient income.
$3.0K
Payroll costs Info Staff salaries plus wage-related costs — benefits such as payroll taxes, health insurance and retirement — from the home's own accounting records (CMS cost report, Worksheet A). Contract or agency labor is counted separately, under other operating costs. Rank #22 / 55Payroll — State benchmarkedThis home is ranked 22nd out of 55 homes in Oklahoma. Shows total annual staff payroll benchmarked to the Oklahoma average. Higher payroll investment relative to peers often signals better staffing and less reliance on cheaper contract labor.Rankings are based only on facilities in Oklahoma that report data for that category. Facilities without available data are excluded from the ranking.Click the rank badge to see the full State ranking.Click here to see the full State ranking.
$5.2M 51.7% of net patient revenue Info Payroll as a share of revenue: staff salaries and wage-related benefits divided by net patient revenue. A higher figure means more of each revenue dollar goes to staff pay. Rank #23 / 55Payroll % — State benchmarkedThis home is ranked 23rd out of 55 homes in Oklahoma. Shows payroll as a percentage of revenue versus the Oklahoma average. Well-run Oklahoma facilities typically land around 55–61% — the top third Statewide. Below 25% may signal understaffing or heavy agency use — read with Staffing ratings.Rankings are based only on facilities in Oklahoma that report data for that category. Facilities without available data are excluded from the ranking.Click the rank badge to see the full State ranking.Click here to see the full State ranking.
Other operating costs Info Everything it costs to run the home apart from payroll — food, utilities, supplies, maintenance, contract labor and administration. Calculated as total operating expense minus payroll (staff salaries and wage-related benefits).
$4.9M
Total costs Info The home's total operating expense for the year — all the costs of running it, salaries included (CMS cost report, Worksheet G-3).
$10.2M

What does this home offer?

Building type icon
Building type icon

Building Type: Single-story

Who this home usually serves

TYPE OF STAY

Mix of rehab and long-term care

This home supports both short-term rehab and long-term care, with residents staying for a wide range of durations.

Most new residents arrive under private pay (52% of admissions), and a typical private pay stay runs around 1 - 2 months.

Admissions
398 total

Coverage residents most often arrive under.

Medicare 28%
Private pay 52%
Medicaid 20%
Discharges
482 total

Coverage residents most often leave under.

Medicare 18%
Private pay 82%

Places of interest near St. Ann‘s Skilled Nursing & Therapy

Address 9.8 miles from city center Info Estimated distance in miles from Oklahoma City's city center to St. Ann‘s Skilled Nursing & Therapy's address, calculated via Google Maps. — 3.76 miles to nearest hospital (Mercy Hospital Oklahoma City)

Calculate Travel Distance to St. Ann‘s Skilled Nursing & Therapy

Add your location

Address

Compare Nursing Homes around Oklahoma

The information below is reported by the Oklahoma State Department of Health, Protective Health Services.

St. Ann‘s Skilled Nursing & Therapy
NH
Oklahoma City (Eagle Hill) -120 - 28 -
Ignite Medical Resort Oklahoma City
NH
NC
PC
Oklahoma City (Central Oklahoma City) -75 - 52 -
Wilshire Nursing Skilled and Therapy
NH
NC
Oklahoma City (Northeast Oklahoma City) -56 - 12 -
Bellevue Health & Rehab Center
NH
HC
NC
PC
Oklahoma City (Central Oklahoma City) -142 - 44 -
Parc Place Medical Resort
NH
AL
IL
MC
Oklahoma City (Northeast Oklahoma City) -73 - 31 -

Frequently Asked Questions about St. Ann‘s Skilled Nursing & Therapy

What neighborhood is St. Ann‘s Skilled Nursing & Therapy in?

St. Ann‘s Skilled Nursing & Therapy is in the Eagle Hill neighborhood.

Is St. Ann‘s Skilled Nursing & Therapy in a walkable area?

St. Ann‘s Skilled Nursing & Therapy has a walk score of 28. Somewhat walkable. A few nearby services may be reachable on foot, but most trips require transportation.

What is the occupancy rate at St. Ann‘s Skilled Nursing & Therapy?

St. Ann‘s Skilled Nursing & Therapy's occupancy is 124.1%.

Does St. Ann‘s Skilled Nursing & Therapy operate as a for-profit or non-profit?

St. Ann‘s Skilled Nursing & Therapy is registered as a for-profit.

Are there photos of St. Ann‘s Skilled Nursing & Therapy?

Yes — there are 4 photos of St. Ann‘s Skilled Nursing & Therapy in the photo gallery on this page.

What is the address of St. Ann‘s Skilled Nursing & Therapy?

St. Ann‘s Skilled Nursing & Therapy is located at 9400 St Ann Dr, Oklahoma City, OK 73162.

What is the phone number of St. Ann‘s Skilled Nursing & Therapy?

(405) 728-7888 will put you in contact with the team at St. Ann‘s Skilled Nursing & Therapy.

Guides for Better Senior Living

Care Cost Calculator: See Prices in Your Area

Nursing Home Data Explorer

Don’t Wait Too Long: 7 Red Flag Signs Your Parent Needs Assisted Living Now

The True Cost of Assisted Living in 2025 – And How Families Are Paying For It

Understanding Senior Living Costs: Pricing Models, Discounts & Financial Assistance