Total health inspections
15
California average 12.5
Last Health inspection on Jul 2025

We arrange tours, appointments, and even moving support so you don’t have to
Thank you for your interest!
Our team will be in touch shortly to help with next steps.

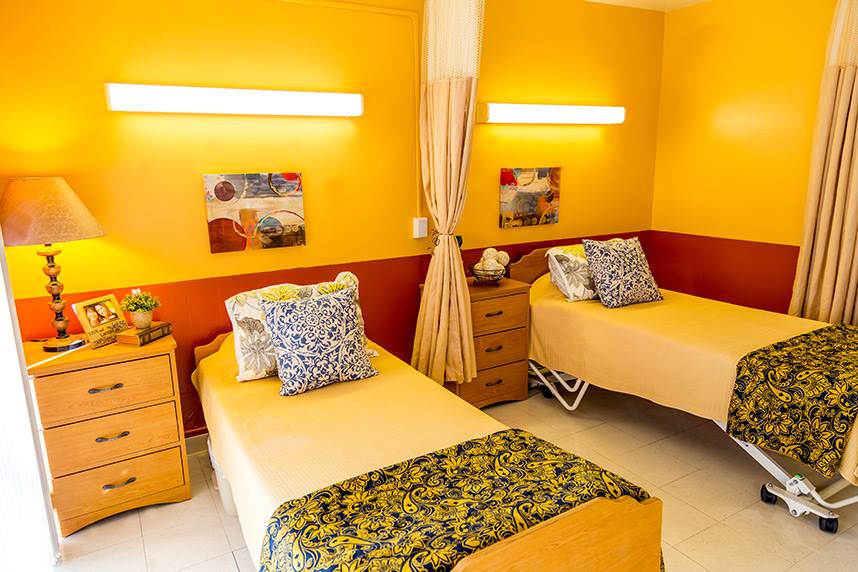

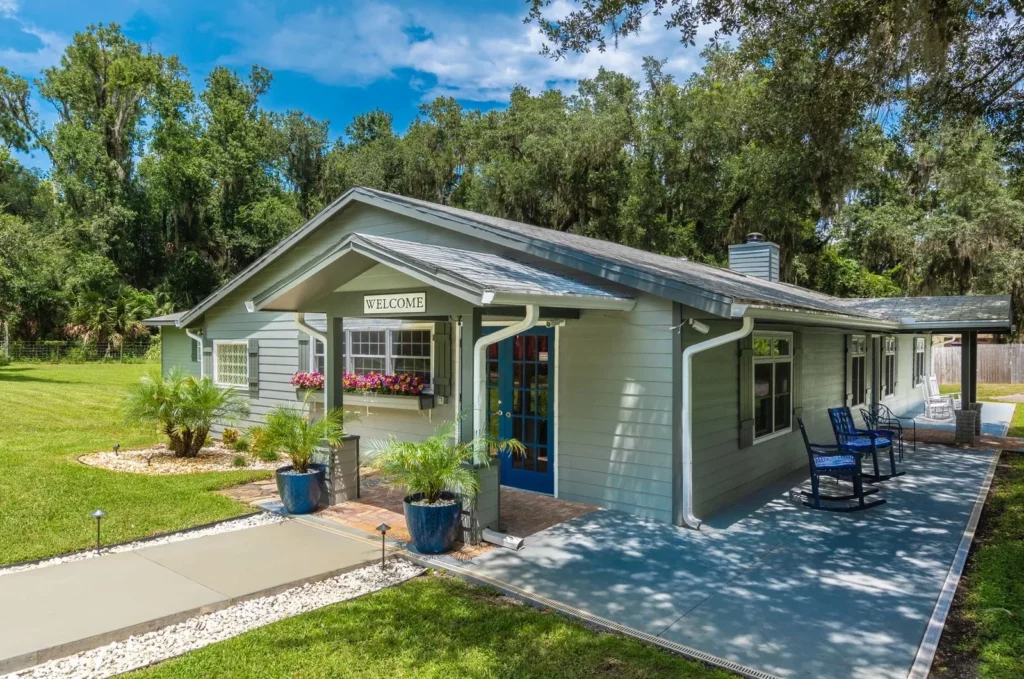
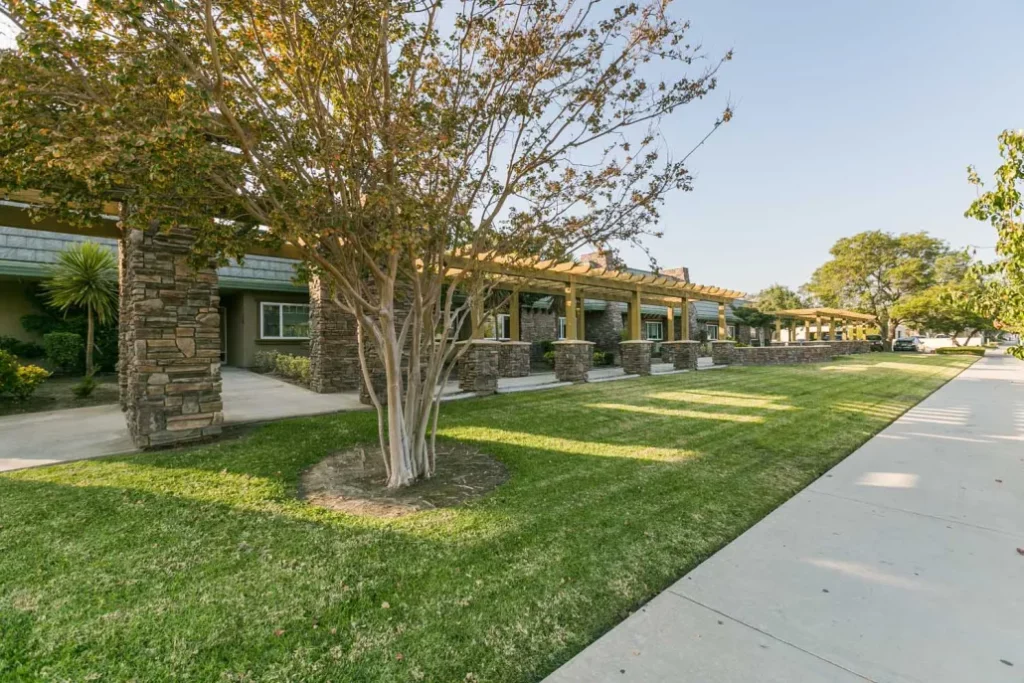
St. Edna Sub-acute and Rehabilitation Center, located in Santa Ana, California, is a 24-hour skilled nursing facility comprising 144 beds. Under the supervision of the Medical Director and the attending physician, St. Edna Sub-acute and Rehabilitation Center offers round-the-clock skilled nursing care, ensuring the provision of comprehensive, tailored treatment plans. These individualized care plans encompass progressive therapy strategies, all aimed at restoring patients to their previous levels of functioning, guided by a harmonized approach to clinical and rehabilitation care.
This dedicated healthcare establishment boasts a team of committed professionals whose primary mission is to aid patients in their recovery following surgery, injury, or severe illness. As an integrated team, their collective goal transcends mere expectations, aspiring to deliver exceptional rehabilitative therapy and nursing care standards. St. Edna Sub-acute and Rehabilitation Center is steadfast in empowering patients to attain their utmost functional potential, ultimately facilitating their transition to the least restrictive care setting possible.
Offers a balance of services and community atmosphere.
Occupancy is moderate, suggesting balanced demand.
Residents typically stay for brief periods, with frequent admissions and discharges throughout the year.
24% of new residents, usually for short-term rehab.
62% of new residents, often for short stays.
14% of new residents, often for long-term daily care.
In California, the Department of Social Services (for assisted living facilities) and the Department of Public Health (for nursing homes) conduct inspections to ensure resident safety and regulatory compliance.
California average 12.5
Last Health inspection on Jul 2025
California average 50.2
California average 4.65
Health citations are formal notices following inspections when they fail to comply with safety and care standards.
66 of 94 citations resulted from standard inspections; and 26 of 94 resulted from complaint investigations.
California average: 0.4
California average: 1
Data sourced from CMS Health Deficiencies reports. Citation severity codes range from A (least serious) to L (most serious). Immediate Jeopardy (J-L) citations indicate situations where the facility's noncompliance has placed residents at risk of death or serious harm.
Assisted Living A licensed, long-term care setting for seniors or individuals with disabilities who need help with daily activities — like bathing, dressing, and medication management — but not 24-hour skilled nursing. Offers housing, meals, and around-the-clock support while aiming to maximize resident independence.
Independent Living Lifestyle-focused communities for older adults offering dining, activities, and transportation with minimal personal care. Best for active, independent seniors who want community without medical support.
Memory Care Secured, specialized care for people living with Alzheimer's or dementia. Staff trained in cognitive impairment, with higher staff-to-resident ratios and an environment designed to reduce confusion and wandering risk.
Nursing Home Licensed facility providing 24/7 skilled nursing care for residents with complex, ongoing medical needs. Staffed by RNs, LPNs, and CNAs. Inspected and star-rated annually by CMS. Accepts Medicare (short-term rehab) and Medicaid (long-term care).
Nursing Home Licensed facility providing 24/7 skilled nursing care for residents with complex, ongoing medical needs. Staffed by RNs, LPNs, and CNAs. Inspected and star-rated annually by CMS. Accepts Medicare (short-term rehab) and Medicaid (long-term care).
Nursing Home Licensed facility providing 24/7 skilled nursing care for residents with complex, ongoing medical needs. Staffed by RNs, LPNs, and CNAs. Inspected and star-rated annually by CMS. Accepts Medicare (short-term rehab) and Medicaid (long-term care).
Nursing Home Licensed facility providing 24/7 skilled nursing care for residents with complex, ongoing medical needs. Staffed by RNs, LPNs, and CNAs. Inspected and star-rated annually by CMS. Accepts Medicare (short-term rehab) and Medicaid (long-term care).
![]() 3.4 miles from city center — 7.87 miles to nearest hospital (Orange County Heart Institute and Research Center)
3.4 miles from city center — 7.87 miles to nearest hospital (Orange County Heart Institute and Research Center)
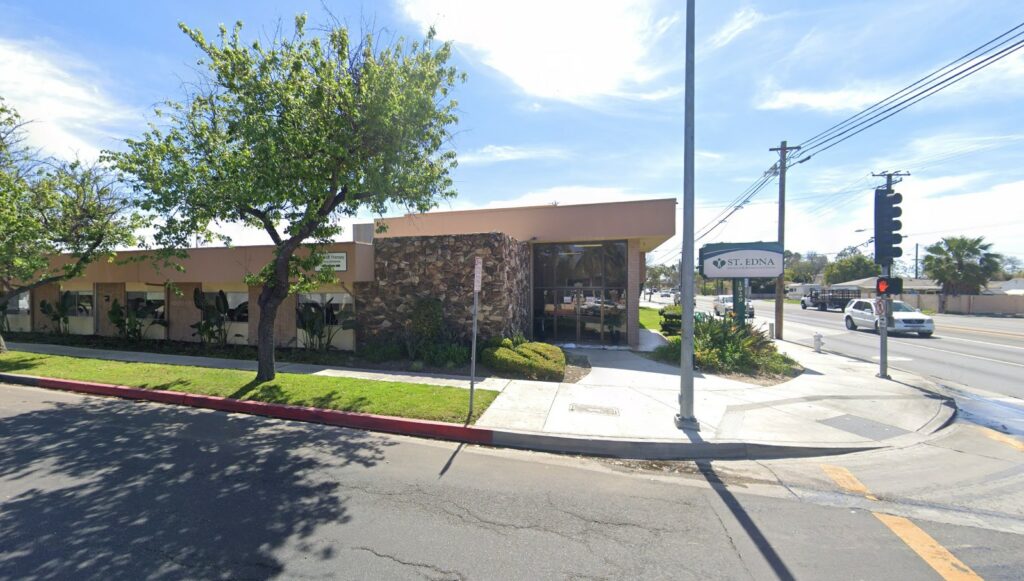
![]() 1929 N Fairview St, Santa Ana, CA 92706
1929 N Fairview St, Santa Ana, CA 92706
Add your location
This data corresponds to Q2 2025 and is based on CMS Payroll-Based Journal.
California average ratio: 0.00:1
California average: 7.7 hours
Manages medical care and health needs.
No contractors work on this role.
Assists with medical care and medications.
This role is partially covered by contractors.
Helps with daily care and mobility.
No contractors work on this role.
Total hours from contractors
3,453 contractor hours this quarter
| Certified Nursing Assistant | 85 | 0 | 85 | 31,272 | 91 | 100% | 7.4 |
| Licensed Practical Nurse | 25 | 1 | 26 | 10,471 | 91 | 100% | 8.1 |
| RN Director of Nursing | 7 | 0 | 7 | 2,946 | 70 | 77% | 8.3 |
| Registered Nurse | 11 | 0 | 11 | 2,846 | 91 | 100% | 7.4 |
| Other Dietary Services Staff | 4 | 0 | 4 | 1,360 | 91 | 100% | 7.5 |
| Physical Therapy Aide | 0 | 9 | 9 | 1,190 | 73 | 80% | 5.6 |
| Dental Services Staff | 2 | 0 | 2 | 981 | 64 | 70% | 8 |
| Speech Language Pathologist | 0 | 10 | 10 | 838 | 81 | 89% | 6.2 |
| Respiratory Therapy Technician | 0 | 9 | 9 | 717 | 80 | 88% | 4.9 |
| Administrator | 1 | 0 | 1 | 512 | 64 | 70% | 8 |
| Nurse Practitioner | 1 | 0 | 1 | 512 | 64 | 70% | 8 |
| Dietitian | 1 | 0 | 1 | 512 | 64 | 70% | 8 |
| Physical Therapy Assistant | 0 | 8 | 8 | 473 | 81 | 89% | 4.4 |
| Mental Health Service Worker | 1 | 0 | 1 | 456 | 57 | 63% | 8 |
| Qualified Social Worker | 0 | 2 | 2 | 180 | 31 | 34% | 5.6 |
| Clinical Nurse Specialist | 1 | 0 | 1 | 50 | 7 | 8% | 7.1 |
| Occupational Therapy Assistant | 0 | 1 | 1 | 46 | 6 | 7% | 7.7 |
Source: CMS Long-Term Care Facility Characteristics (Data as of Jan 2026)
Residents meet regularly to discuss policies, care quality, and activities
State-approved Nurse Aide Training and Competency Evaluation Program on-site
Organized group of residents that meets regularly to discuss facility policies, quality of life, and activities.
Data sourced from CMS Long-Term Care Facility Characteristics quarterly report. Payer mix reflects the current resident census by primary payment source.
These measures show how residents usually do over time at this home, based on health outcomes and preventive care.
California average: 6.6
California average: 11.3
California average: 11.1%
California average: 12.0%
California average: 11.3%
California average: 1.7%
California average: 5.0%
California average: 1.2%
California average: 4.2%
California average: 6.7%
California average: 10.1%
California average: 98.5%
California average: 98.2%
California average: 94.0%
California average: 1.5%
California average: 93.2%
Quality measures are calculated from Minimum Data Set (MDS) assessments. For most measures, lower percentages indicate better care quality.
Federal penalties imposed by CMS for regulatory violations, including civil money penalties (fines) and denials of payment for new Medicare/Medicaid admissions.
Source: CMS Penalties Database (Data as of Jan 2026)
California average: $55K
California average: 2.4
California average: 0.5
Penalties are imposed by CMS for violations of federal nursing home regulations.
Last updated: Jan 2026
Historical financial and operational data for St. Edna Sub-Acute and Rehabilitation Center based on CMS SNF Cost Reports.
Loading trend charts...
Care Cost Calculator: See Prices in Your Area
Nursing Home Data Explorer
Don’t Wait Too Long: 7 Red Flag Signs Your Parent Needs Assisted Living Now
The True Cost of Assisted Living in 2025 – And How Families Are Paying For It
Understanding Senior Living Costs: Pricing Models, Discounts & Financial Assistance

Touring a community? Use this expert-backed checklist to stay organized, ask the right questions, and find the perfect fit.
We'll send you a PDF version of the touring checklist.