Steere House Nursing & Rehabilitation Center

Nursing Home

Steere House Nursing & Rehabilitation Center

100 Borden St, Providence, RI 02903 View Map
Nursing Home
icon
Care Cost Calculator: See Prices in Your Area Care Cost Calculator: See Prices in Your Area icon
Overview of Steere House Nursing & Rehabilitation Center

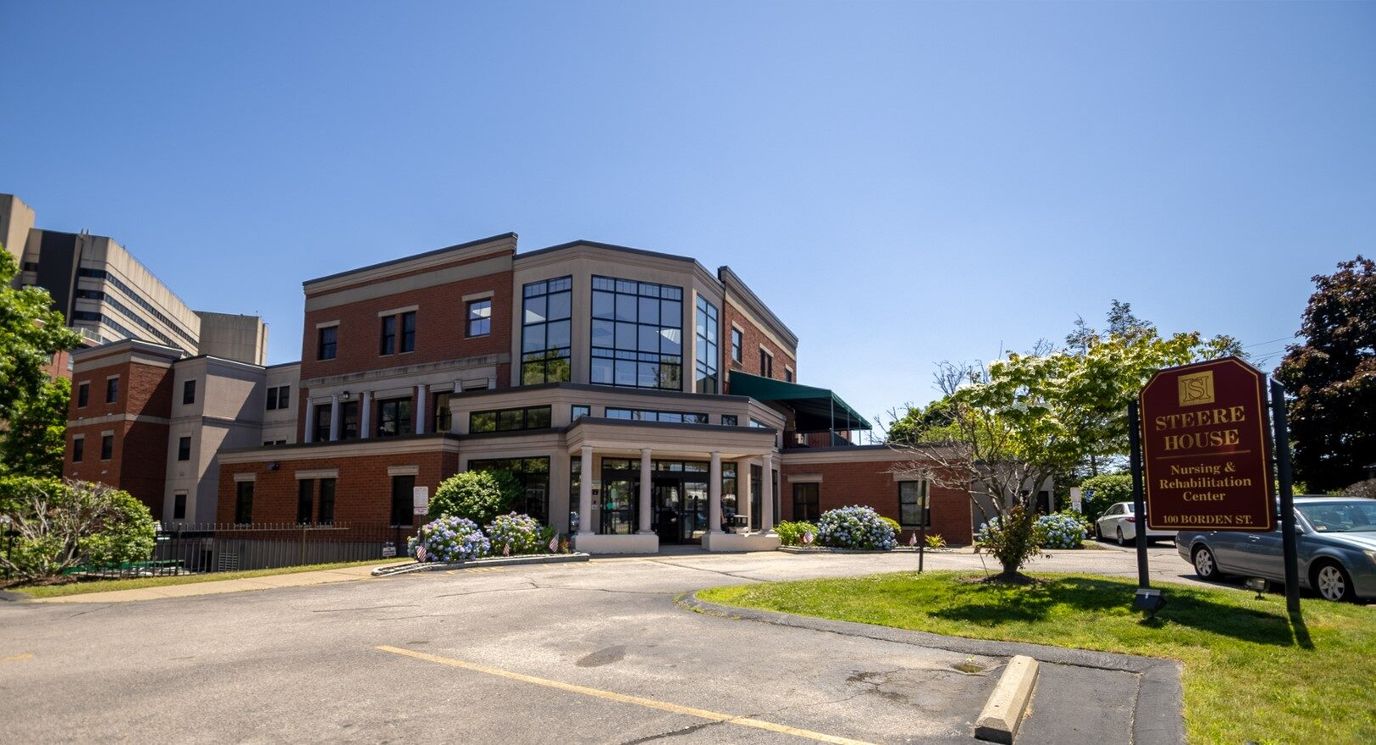
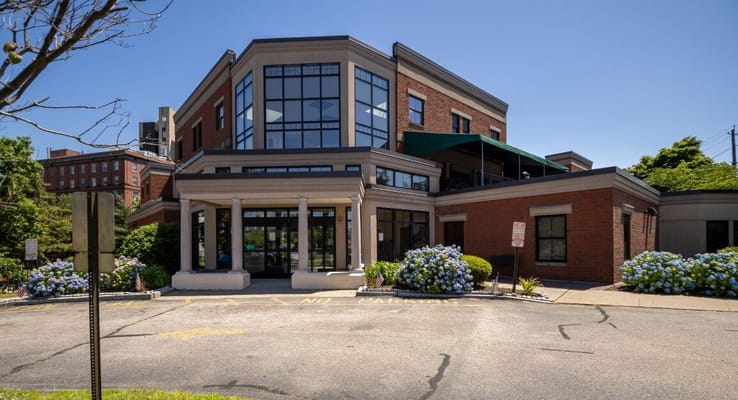
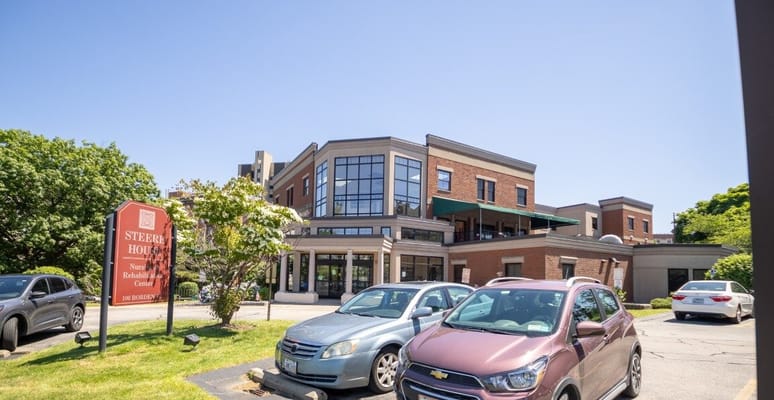
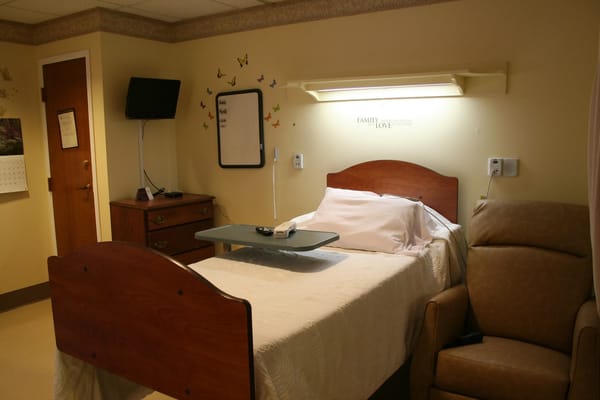
Tucked in the vibrant city of Providence, Rhode Island, the exquisite Steere House Nursing & Rehabilitation Center is a haven where life is cherished and celebrated every single day. Conveniently located near Route 95 and downtown Providence, families can easily access this beloved sanctuary for their loved ones. At the heart of this distinguished facility lies a three-story, 120-bed structure that emanates an atmosphere of positivity and compassion. With a rich history dating back to 1874, Steere House has been a beacon of exceptional care, leaving an indelible mark on the lives of those it serves. 
Steere House holds the prestigious certifications of Medicaid and Medicare, making it a trusted choice for comprehensive long-term care, memory care, and short-term rehabilitation services. Not only do they embrace a variety of insurance programs, but they also welcome private funds, ensuring that exceptional care is within reach for all. 

(401) 454-7970

Quality ratings

Measured by Centers for Medicare & Medicaid Services (CMS)

Overall rating Info Official CMS rating based on health inspections, staffing and quality measures.
4/5
Rhode Island average: 3.1/5
Health Inspection Info Official CMS rating based on deficiencies found during state health inspections.
3/5
Rhode Island average: 2.9/5
Staffing Info Official CMS rating based on nurse staffing hours per resident per day.
5/5
Rhode Island average: 3.5/5
Quality Measures Info Official CMS rating based on clinical outcomes for residents.
4/5
Rhode Island average: 3.2/5

Nursing care per resident

Info Average daily nursing hours per resident (adjusted for acuity). Higher values indicate more nursing time per resident.
5h 5m per day

This home provides 27% more nursing time per resident than the state average.

Rhode Island average: 4h 1m per day

Staffing hours breakdown

Info Hours of care per resident per day, broken down by staff type. Data from CMS Medicare.
Staff type Facility State avg National avg
Registered Nurse (RN) Info Registered nurse hours per resident per day. 54m per day 46m per day 41m per day
LPN / LVN Info Licensed Practical Nurse / Licensed Vocational Nurse hours per resident per day. 22m per day 29m per day 52m per day
Nurse Aide Info Nurse aide hours per resident per day. 3h 18m per day 2h 28m per day 2h 21m per day
Total Nursing (Weekend) Info Total number of nurse staff hours per resident per day on weekends. 4h 4m per day 3h 18m per day 3h 26m per day
Physical Therapist Info Physical therapist staff hours per resident per day. 2m per day 3m per day 4m per day
RN (Weekend) Info Registered nurse hours per resident per day on weekends. 42m per day 34m per day 29m per day

Capacity and availability

Medium-capacity home

Offers a balance of services and community atmosphere.

Total beds 120

This home usually has limited availability

Occupancy is moderate, suggesting balanced demand.

Similar demand to the Rhode Island average
Occupancy rate 86.9%
Residents per day (avg) 104
Occupancy rate
86.9%
Residents per day (avg)
104

Who this home usually serves

TYPE OF STAY

Mix of rehab and long-term care

This home supports both short-term rehab and long-term care, with residents staying for a wide range of durations.

Breakdown by payment type

Medicare

39% of new residents, usually for short-term rehab.

Typical stay 22 days

Private pay

55% of new residents, often for short stays.

Typical stay 2 - 3 months

Medicaid

6% of new residents, often for long-term daily care.

Typical stay 3 - 4 years

Finances and operations

Voluntary non-profit home
Other
Home revenue
$21.7M
Surplus of revenue
$443.2K
Voluntary non-profit home Other
Home revenue
$21,671,852.00
Surplus of revenue
$443,245.00
Payroll costs Info The portion of the home's budget spent on staff, including nurses, caregivers, and other employees who support care and operations.
$7.3M
33.7% of revenue
Other operating costs Info All remaining costs needed to run the home, such as food, utilities, building maintenance, supplies and administrative expenses.
$13.9M
Total costs $21.2M
Bed community size
120-bed community
A larger shared setting that may offer more common spaces and organized community services.
Walk Score
Walk Score: 77 / 100
Very walkable. Most errands can be accomplished on foot, and many essentials are within a short walk.
BBB Rating
BBB Rating: A+ (Not Accredited)
An independent rating from the Better Business Bureau based on factors such as complaint history, transparency, and business practices.
How BBB ratings work

About this community

Occupancy Rate
93%
Occupied Beds
111 of 120
Percentage of available beds currently in use by residents.
License Status
Active
Facility Type
Nursing Facility
License Date
October 18, 1909
License Expiration
December 31, 2026

Additional licensing details

License number: LTC00668
CMS Certification Number: 415091

Ownership & operating entity

Steere House Nursing & Rehabilitation Center is legally operated by JOSH SEGAL.

Type Of Units

Nursing Home
120 units
Total beds
120 units

Staffing

Key information about the people who lead and staff this community.

Leadership

Contact: Ms. Julie Richard, Executive Director

Contact Information

Fax: (401) 831-7570

Types of Care at Steere House Nursing & Rehabilitation Center

Nursing Home
Contact Steere House Nursing & Rehabilitation Center

Inspection History

In Rhode Island, the Department of Health, Center for Health Facilities Regulation is the primary authority for inspecting, licensing, and reporting on all long-term care facilities.

8 visits/inspections

3 visits/inspections triggered by complaints

3 other visits

Results

4 with issues

4 without issues

Latest inspection

Date:November 26, 2024
Type:Follow Up

23 deficiencies

Deficiencies indicate regulatory issues. A higher number implies the facility had several areas requiring improvement.

Compare Nursing Homes around Providence

The information below is reported by the Rhode Island Department of Health, Center for Health Facilities Regulation.
Steere House Nursing & Rehabilitation Center
SNF

Nursing Homes 24/7 care needed

Providence (Upper South Providence)
120
No
A+
77
OWENS, NORMA
86.9%
$17,966,843.00
$7,302,032.00
40.6%
104.30
4/5
5.0864
3/5
5/5
4/5
3
9
4
-7%
+27%
+4%
-
Bannister Center for Rehabilitation and Nursing
SNF

Nursing Homes 24/7 care needed

Providence (West End)
161
No
-
92
HEINEMAN, HENRY
71.2%
$13,693,977.00
$6,243,619.00
45.6%
153.10
2/5
2.8429
2/5
2/5
4/5
3
33
5
-50%
-29%
-15%
-
Elmhurst Rehabilitation & Healthcare Center
MC

Memory Care Specialized care for those with Memory Loss, Alzheimer's, or dementia, ensuring safety and support.

SNF

Nursing Homes 24/7 care needed

Providence (Elmhurst)
206
No
-
72
SEPE, ARMANI
81.4%
$22,995,000.00
$7,750,112.00
33.7%
180.80
-
4.0318
-
-
-
5
58
13
-16%
0%
-3%
-
Berkshire Place Nursing and Rehabilitation Center
HC

Hospice Care

SNF

Nursing Homes 24/7 care needed

RC

Respite Care

Providence (Wanskuck)
220
No
-
77
AMANDA THOMPSON, ADMINISTRATOR
-
-
-
-
-
-
-
-
-
-
-
-
-
-
-
-
-
Charlesgate Nursing Center
AL

Assisted Living For seniors needing help with daily tasks but not full-time nursing.

IL

Independent Living For self-sufficient seniors seeking community and minimal assistance.

SNF

Nursing Homes 24/7 care needed

Providence (Mount Hope)
120
No
A+
83
#N/A
-
$7,833,952.00
$4,235,056.00
54.1%
-
-
-
-
-
-
-
-
-
-
-
-
studio / 1 bed

Places of interest near Steere House Nursing & Rehabilitation Center

Address 1 mile from city center — 0.14 miles to nearest hospital (Women & Infants Hospital of Ri: Matook Sherry)

Address 100 Borden St, Providence, RI 02903

Calculate Travel Distance to Steere House Nursing & Rehabilitation Center

Add your location

Address

Staffing Data

Source: CMS Payroll-Based Journal (Q2 2025)

153
Total Staff
130
Employees
23
Contractors
49,601
Total Hours (Quarter)
74
Avg Staff/Day
7.4
Avg Shift (hrs)
Nursing Staff Breakdown
Role Count Avg Shift (hrs) Uses Contractors?
Registered Nurse208.2 No
Licensed Practical Nurse167.7 No
Certified Nursing Assistant687.3 No
Staff by Category
Administration
3 staff
5.1hs shift avg
Nursing Staff
122 staff
7.5hs shift avg
Physicians & Practitioners
6 staff
7.3hs shift avg
Therapy Services
19 staff
6.2hs shift avg
Activities & Recreation
0 staff
0hs shift avg
Social Services
1 staff
6.1hs shift avg
Dietary Services
1 staff
7.5hs shift avg
Other Services
1 staff
7.9hs shift avg
Contractor Analysis
7.4%
of total hours from contractors
3,657 contractor hours this quarter
Occupational Therapy Aide: 1 Physical Therapy Assistant: 5 Speech Language Pathologist: 5 Physical Therapy Aide: 3 Respiratory Therapy Technician: 4 Qualified Social Worker: 1 Medical Director: 2 Occupational Therapy Assistant: 1 Feeding Assistant: 1
Role Employees Contractors Total Staff Total Hours Days Worked % of Days Avg Shift (hrs)
Certified Nursing Assistant6806825,31091100%7.3
Registered Nurse200206,26891100%8.2
Medication Aide/Technician170175,62691100%7.9
Licensed Practical Nurse160165,00791100%7.7
Clinical Nurse Specialist5051,9767380%7.2
Speech Language Pathologist0558207886%5.8
Physical Therapy Assistant0557728088%6.1
Physical Therapy Aide0337617684%6.5
Administrator1014746167%7.8
Nurse Practitioner1014455965%7.5
Mental Health Service Worker1014265459%7.9
Dietitian1014135560%7.5
Respiratory Therapy Technician0444047380%5.5
Occupational Therapy Aide0113835055%7.7
Qualified Social Worker0113605965%6.1
Medical Director0221025156%2
Occupational Therapy Assistant0114989%6.1
Feeding Assistant011755%1.3

Health Inspection History

Inspections
Total health inspections 4

Rhode Island average 8.3


Last Health inspection on Nov 2024

Total health citations 9
Citations per inspection
2.25

Health citations are formal notices following inspections when they fail to comply with safety and care standards.

6 of 9 citations resulted from standard inspections; and 3 of 9 resulted from complaint investigations.

Breakdown of citation severity (last 3 years)
Critical Health citations More info 1
38% better than Rhode Island average

Rhode Island average: 1.6


Serious Health citations More info 3
76% worse than Rhode Island average

Rhode Island average: 1.7

1 critical citation More info Rhode Island average: 1.6

3 serious citations More info Rhode Island average: 1.7

5 moderate citations More info Rhode Island average: 24.3

0 minor citations More info Rhode Island average: 0.5
Citations history (last 3 years)
Infection Control moderate citation Nov 04, 2024
Corrected

Nutrition critical citation Nov 04, 2024
Corrected

Pharmacy moderate citation Nov 04, 2024
Corrected

Abuse/Neglect serious citation Jul 30, 2024
Corrected

Facility Characteristics

Source: CMS Long-Term Care Facility Characteristics (Data as of Jan 2026)

Ownership: Non-Profit Corporation
Resident Census by Payment Source
108 Total Residents
Medicare 12 (11.1%)
Medicaid 58 (53.7%)
Private Pay/Other 38 (35.2%)
Programs & Services
Residents' Group
Nurse Aide Training
Family Engagement

Active councils help families stay involved in care decisions and facility operations.

Quality of care over time

These measures show how residents usually do over time at this home, based on health outcomes and preventive care.

High-risk clinical events score Info A composite score based on pressure ulcers, falls with injury, weight loss, walking ability decline, and activities of daily living decline. 8.2
21% better than Rhode Island average

Rhode Island average: 10.3

Functional decline score Info A composite score based on activities of daily living decline, walking ability decline, and incontinence. 18.4
9% better than Rhode Island average

Rhode Island average: 20.2

Long-stay resident measures
Need for Help with Daily Activities Increased Info Percent of long-stay residents whose need for help with daily activities has increased 17.2%
12% better than Rhode Island average

Rhode Island average: 19.5%

Walking Ability Worsened Info Percent of long-stay residents whose ability to move independently worsened 14.2%
22% better than Rhode Island average

Rhode Island average: 18.2%

Low Risk Residents with Bowel/Bladder Incontinence Info Percent of low risk long-stay residents who lose control of their bowels or bladder 23.9%
5% worse than Rhode Island average

Rhode Island average: 22.9%

Falls with Major Injury Info Percent of long-stay residents experiencing one or more falls with major injury 2.2%
40% better than Rhode Island average

Rhode Island average: 3.7%

High Risk Residents with Pressure Ulcers Info Percent of long-stay high risk residents with pressure ulcers 5.1%
7% worse than Rhode Island average

Rhode Island average: 4.7%

Urinary Tract Infection Info Percent of long-stay residents with a urinary tract infection 1.9%
15% better than Rhode Island average

Rhode Island average: 2.3%

Lost Too Much Weight Info Percent of long-stay residents who lose too much weight 2.2%
59% better than Rhode Island average

Rhode Island average: 5.4%

Depressive Symptoms Info Percent of long-stay residents who have depressive symptoms 0.0%
100% better than Rhode Island average

Rhode Island average: 13.5%

Antipsychotic Use Info Percent of long-stay residents who received an antipsychotic medication 21.8%
In line with Rhode Island average

Rhode Island average: 21.5%

Pneumococcal Vaccine Info Percent of long-stay residents assessed and appropriately given the pneumococcal vaccine 97.2%
In line with Rhode Island average

Rhode Island average: 93.1%

Influenza Vaccine Info Percent of long-stay residents assessed and appropriately given the seasonal influenza vaccine 90.8%
5% worse than Rhode Island average

Rhode Island average: 95.3%

Hospitalizations per 1,000 days Info Number of hospitalizations per 1,000 long-stay resident days. 0.51
65% better than Rhode Island average

Rhode Island average: 1.46

ED visits per 1,000 days Info Number of outpatient emergency department visits per 1,000 long-stay resident days. 0.49
72% better than Rhode Island average

Rhode Island average: 1.72

Short-stay resident measures
Pneumococcal Vaccine Info Percent of short-stay residents assessed and appropriately given the pneumococcal vaccine 90.0%
18% better than Rhode Island average

Rhode Island average: 76.2%

Antipsychotic medication increase Info Percent of short-stay residents who newly received an antipsychotic medication 1.1%
46% better than Rhode Island average

Rhode Island average: 2.0%

Influenza Vaccine Info Percent of short-stay residents assessed and appropriately given the seasonal influenza vaccine 78.7%
In line with Rhode Island average

Rhode Island average: 78.2%

Re-hospitalized after SNF stay Info Percentage of short-stay residents who were re-hospitalized after their nursing home admission. 27.5%
10% worse than Rhode Island average

Rhode Island average: 25.1%

Emergency department visits Info Percentage of short-stay residents who had an outpatient emergency department visit. 11.7%
26% better than Rhode Island average

Rhode Island average: 15.8%

Falls with major injury Info Percentage of SNF residents who experience falls with major injury during their stay. 0.8%
In line with Rhode Island average

Rhode Island average: 0.8%

Ability to care for self at discharge Info Percentage of residents at or above expected ability to care for themselves at discharge. 42.7%
20% worse than Rhode Island average

Rhode Island average: 53.7%

Successful return to home or community Info Rate of successful return to home or community from a skilled nursing facility. 68.4%
35% better than Rhode Island average

Rhode Island average: 50.6%

Penalties and fines

Federal penalties imposed by CMS for regulatory violations, including civil money penalties (fines) and denials of payment for new Medicare/Medicaid admissions.

Source: CMS Penalties Database (Data as of Jan 2026)

Total fines amount $86K
9% lower than Rhode Island average

Rhode Island average: $94K

Number of fines 3
6% more fines than Rhode Island average

Rhode Island average: 2.8

Payment Denials Info Serious action where Medicare and/or Medicaid temporarily stops payments for new residents until issues are fixed. 0
100% fewer payment denials than Rhode Island average

Rhode Island average: 0.4

Fines amount comparison
This facility $86K
Rhode Island average $94K
Penalty History

Penalties are imposed by CMS for violations of federal nursing home regulations.

Civil Money Penalty Info Fines imposed for noncompliance, which can be assessed per day or per instance of violation. Nov 4, 2024
$35K
Civil Money Penalty Info Fines imposed for noncompliance, which can be assessed per day or per instance of violation. Jul 30, 2024
$43K
Civil Money Penalty Info Fines imposed for noncompliance, which can be assessed per day or per instance of violation. Nov 30, 2023
$8K

Last updated: Jan 2026

Guides for Better Senior Living

Care Cost Calculator: See Prices in Your Area

Nursing Home Data Explorer

Don’t Wait Too Long: 7 Red Flag Signs Your Parent Needs Assisted Living Now

The True Cost of Assisted Living in 2025 – And How Families Are Paying For It

Understanding Senior Living Costs: Pricing Models, Discounts & Financial Assistance

Financial Aid for Rhode Island Seniors

Get financial aid guidance

Rhode Island Home and Community Care Services

RI Medicaid HCCS

Age 65+ or disabled, Rhode Island resident, Medicaid-eligible, nursing home-level care need.

~$2,829/month (300% FBR, individual).

$4,000 (individual, higher than most states).

Higher asset limit; small state aids quicker processing.

Rhode Island Caregiver Support Program

RI NFCSP Respite

Caregiver of someone 60+ (or with dementia), Rhode Island resident.

No strict limit; prioritizes low-income.

Not applicable.

Limited slots; urban focus due to small size.

Program of All-Inclusive Care for the Elderly (PACE)

Rhode Island PACE

Age 55+, RI resident (specific counties), NFLOC, safe with PACE support.

~$2,829/month (Medicaid-eligible); private pay option available.

$4,000 (individual), $6,000 (couple) for Medicaid enrollees.

Operated by PACE Organization of Rhode Island; covers 4 counties (Providence, Kent, Washington, Newport).

@Home Cost Share Program

Rhode Island @Home Cost Share

Age 65+, RI resident, need help with 1+ ADL/IADL, not Medicaid-eligible.

~$1,255-$2,829/month (100%-300% FPL); sliding scale fees.

Not strictly assessed; focus on income/need.

Administered by Division of Elderly Affairs (DEA); complements Medicaid.

SSI Enhanced Assisted Living Program

Rhode Island SSI Enhanced AL

Age 65+ (or disabled), RI resident, SSI-eligible, living in approved AL facility.

$943/month (SSI federal rate) + state supplement ($332/month).

$2,000 (individual), $3,000 (couple).

Supplement increases to ~$1,275/month total for AL residents; ~50 facilities participate.

Medicare Savings Program (MSP)

Rhode Island Medicare Savings Program

Age 65+ or disabled, RI resident, Medicare Part A/B.

~$2,510/month (QMB), ~$3,380/month (SLMB), ~$3,598/month (QI)—individual.

$9,430 (individual), $14,130 (couple).

Three tiers; includes Extra Help for Part D; no waitlist.

Low-Income Home Energy Assistance Program (LIHEAP)

Rhode Island LIHEAP

Age 60+ prioritized, RI resident, low-income household.

~$3,970/month (individual, 185% FPL).

Not assessed; income-focused.

Covers gas, electric, oil; emergency aid available.

VA Aid and Attendance (A&A) and Housebound Benefits

Rhode Island VA Aid and Attendance/Housebound

Age 65+ or disabled veteran/spouse, RI resident, wartime service, need for ADL help (A&A) or homebound.

Net income < ~$1,984/month (veteran with dependent, A&A); pension offsets income.

~$155,356 (net worth limit).

High veteran demand; supports rural/urban care needs.

Senior Farmers’ Market Nutrition Program (SFMNP)

Rhode Island SFMNP

Age 60+, RI resident, low-income.

~$2,322/month (individual, 185% FPL).

Not assessed.

Vouchers (~$50/season); serves ~10,000 annually.

Property Tax Relief for Seniors

Rhode Island Property Tax Relief Credit

Age 65+ (or disabled), RI resident, homeowner/renter, low-income.

~$35,000/year (household).

Not assessed; income-focused.

Credit up to $400; local exemptions vary by municipality.

Who we are

Your Senior Care Partner, Every Step of the Way

We help families find affordable senior communities and unlock same day discounts, Medicaid, and Medicare options tailored to your needs.

Contact us Today