Sterling Care Forest Hill
Nursing Home & Assisted Living · Forest Hill, MD
CMS overall rating Info The Overall CMS Rating is scored from 1 to 5 stars and combines results from health inspections, staffing levels, and quality measures. Health inspections carry the most weight. Staffing and quality scores can increase or decrease the final rating based on performance compared to state and national standards.

Sterling Care Forest Hill

Nursing Home & Assisted Living · Forest Hill, MD
CMS overall rating Info The Overall CMS Rating is scored from 1 to 5 stars and combines results from health inspections, staffing levels, and quality measures. Health inspections carry the most weight. Staffing and quality scores can increase or decrease the final rating based on performance compared to state and national standards.
Calculator: See prices in your area
Sterling Care Forest Hill accepts Medicare, Medicaid, and private pay.

Overview of Sterling Care Forest Hill

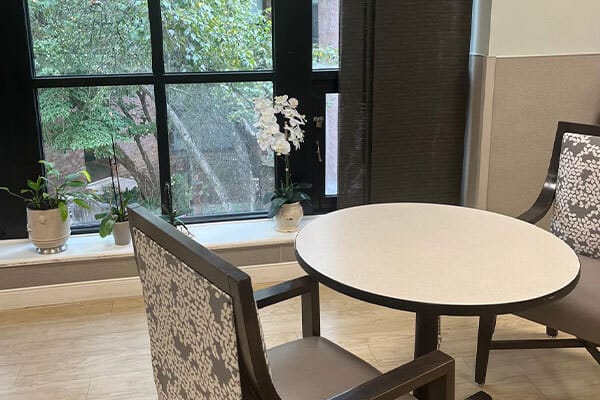
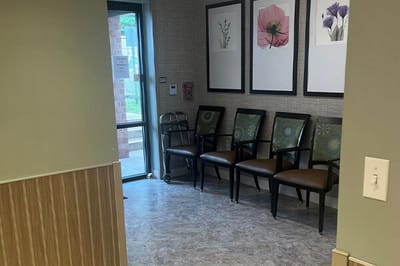
Settled in the tranquil neighborhood of Forest Valley Drive, Forest Hill, MD, Sterling Care Forest Hill is a reliable senior living community focusing on medical services including long-term care, skilled nursing, outpatient therapy, cardiac care, and hospice services. Featuring newly renovated residences, the community ensures seniors experience unrivaled comfort and convenience. The community strives to provide the highest quality of care and assistance around the clock for seniors to flourish and reach their full potential.

Alongside comprehensive care, the community also features state-of-the-art amenities to promote an active and blissful retirement. Outdoor trips and plenty of fun games are orchestrated for residents’ enjoyment. Sterling Care Forest Hill is great for seniors looking to make the most out of their golden years in its beautifully designed campus.

(410) 838-0101

Quality ratings

Measured by Centers for Medicare & Medicaid Services (CMS)

Overall rating Info The Overall CMS Rating combines results from health inspections, staffing levels and quality measures. Health inspections carry the most weight. Staffing and quality scores can increase or decrease the final rating based on performance compared to state and national standards.
▲ 46.6% Above MD avg. ▲ 46.6% Above MD avg.Click the badge to see the full State ranking.Click here to see the full State ranking.
Health Inspection Info Based on the results of the facility's three most recent standard inspections and any complaint investigations. CMS reviews the number, scope, and severity of deficiencies, with more recent findings weighted more heavily.
▲ 25.0% Above MD avg. ▲ 25.0% Above MD avg.Click the badge to see the full State ranking.Click here to see the full State ranking.
Staffing Info Measures average nursing staff hours per resident per day, including Registered Nurses (RNs) and total nursing staff. Ratings are adjusted based on the level of care residents require and are compared to state and national benchmarks.
▼ 43.5% Below MD avg. ▼ 43.5% Below MD avg.Click the badge to see the full State ranking.Click here to see the full State ranking.
Quality Measures Info Based on clinical and physical health indicators reported to CMS, such as hospital readmissions, falls, pressure ulcers, and improvements in mobility. These measures reflect how well residents' health needs are being managed.
▲ 34.0% Above MD avg. ▲ 34.0% Above MD avg.Click the badge to see the full State ranking.Click here to see the full State ranking.

Staffing hours breakdown

Info Daily nursing hours per resident by staff type, reported to CMS. Higher is generally better — compare this facility to state and national averages to see where staffing stands.

Hours per resident per day — compared to Maryland state averages

Total nursing care / resident Info This home is ranked 89th out of 144 homes in Maryland. Total adjusted nursing hours per resident per day, combining RN, LPN, and aide time. CMS adjusts this for case-mix so facilities can be fairly compared.
3h 17m per day
Rank #89 / 144Nurse hours — State benchmarkedThis home is ranked 89th out of 144 homes in Maryland. Shows adjusted nurse hours per resident per day benchmarked to the Maryland average, with a ranking across 144 Maryland SNFs. More hours mean more direct care. The national average is about 3.5 hrs; below 3.0 is a red flag.Click the rank badge to see the full State ranking.Click here to see the full State ranking.
This facility Maryland avg (4h 17m per day)
vs Maryland avg
-23%

2 of 6 metrics below state avg

Standout metric Physical Therapist is +60% above state avg
Staff typeHours / Day / Residentvs state avg
Registered Nurse (RN) Info RNs hold the highest nursing license and can assess residents, interpret test results, and direct care plans. More RN hours per day often signals stronger clinical oversight and faster response to health changes. 32m per day ▼ 36% State avg: 50m per day · National avg: 41m per day
LPN / LVN Info Licensed Practical Nurses (LPNs) or Licensed Vocational Nurses (LVNs) deliver routine hands-on care — medication administration, wound dressing, and monitoring vital signs. They work under RN supervision and make up a large share of daily bedside care. 1h 8m per day ▲ 26% State avg: 54m per day · National avg: 52m per day
Nurse Aide Info Certified Nurse Aides (CNAs) provide the most direct day-to-day assistance: bathing, dressing, feeding, and mobility. Nurse aide hours are typically the largest staffing category and directly affect residents' quality of life. 2h 10m per day ■ Avg State avg: 2h 10m per day · National avg: 2h 21m per day
Weekend Total Nursing Info Combined nursing hours (RN + LPN + Nurse Aide) per resident per day on weekends. Staffing often drops on weekends — this figure reveals whether the facility maintains adequate coverage outside of weekday hours. 3h 29m per day ■ Avg State avg: 3h 29m per day · National avg: 3h 26m per day
Physical Therapist Info Hours per resident per day provided by licensed Physical Therapists (PTs) or PT Assistants. PT services help residents recover mobility after injury or illness and are especially important for post-acute (short-stay) rehabilitation. 8m per day ▲ 60% State avg: 5m per day · National avg: 4m per day
Weekend RN Info Registered nurse hours specifically on weekends. Facilities sometimes reduce RN presence on Saturdays and Sundays — a low weekend RN figure compared to weekday hours can indicate reduced clinical oversight when most administrative staff are absent. 22m per day ▼ 41% State avg: 37m per day · National avg: 29m per day

Types of Care at Sterling Care Forest Hill

Assisted Living Nursing Home

Capacity and availability

This home usually has availability

Occupancy lower than 85% suggests more openings may be available.

Lower occupancy than the Maryland average: 82.4%
Occupancy rate 35.9% Rank #142 / 146Occupancy rate — State benchmarkedThis home is ranked 142nd out of 146 homes in Maryland. Shows this facility's occupancy rate versus the Maryland average, with its Statewide rank out of 146. Higher occupancy signals strong local demand and financial stability.Click the rank badge to see the full State ranking.Click here to see the full State ranking.
Avg. Length of Stay 91 days
Occupancy rate
35.9% Rank #142 / 146Occupancy rate — State benchmarkedThis home is ranked 142nd out of 146 homes in Maryland. Shows this facility's occupancy rate versus the Maryland average, with its Statewide rank out of 146. Higher occupancy signals strong local demand and financial stability.Click the rank badge to see the full State ranking.Click here to see the full State ranking.
Avg. Length of Stay
91 days
Walk Score
Walk Score: 61 / 100 Rank #301 / 986Walk Score — State benchmarkedThis home is ranked 301st out of 986 homes in Maryland. Shows how walkable this facility's neighborhood is compared to the average Walk Score across Maryland SNFs. Higher scores benefit residents, families, and staff.Click the rank badge to see the full State ranking.Click here to see the full State ranking.
Moderately walkable. Some errands can be accomplished on foot, with a mix of nearby amenities.
BBB Rating
BBB Rating: A (Not Accredited)
An independent rating from the Better Business Bureau based on factors such as complaint history, transparency, and business practices.
How BBB ratings work

Contact Sterling Care Forest Hill

Inspection History

In Maryland, the Department of Health, Office of Health Care Quality is the state agency that conducts unannounced inspections and issues reports for all assisted living and nursing facilities.

Since 2018 · 8 years of data 45 citations

Inspection Scorecard Info This scorecard compares key inspection, citation, and complaint metrics at this facility against the Maryland state average. Metrics rated ≥15% worse than average are highlighted in red; those ≥15% better are highlighted in green.

Since 2018 vs. Maryland state average
Overall vs. MD average 2 Worse Metrics worse than Maryland average:
• Total citations (1025% above)
• Citations per year (1020% above)
0 Better No metrics in this bucket.
Latest Inspection August 7, 2024 Routine

Citations Info Citations are formal regulatory issues recorded during state inspections.

This FacilityMD Averagevs. MD Avg
Total citations Info Formal regulatory issues recorded by inspectors across all inspection types. 454 This facility has 1025% more total citations than a typical Maryland nursing home (45 vs. MD avg 4).↑ 1025% worse
Citations per year Info Average citations per year since 2018. 5.60.5 This facility has 1020% more citations per year than a typical Maryland nursing home (5.6 vs. MD avg 0.5).↑ 1020% worse

Inspection Reports Summary Info An editor-reviewed summary of the themes and findings across this facility's recent inspection reports.

The most recent inspection on August 7, 2024, found multiple deficiencies including locked unit doors restricting resident movement, failure to follow ophthalmologist recommendations, poor maintenance, inadequate supervision leading to resident elopement, incomplete nurse staffing records, improper food storage, and environmental repairs needed. Earlier inspections showed a pattern of issues related to resident dignity, care planning, medication administration, environment cleanliness, and timely reporting of abuse allegations. Complaint investigations found a substantiated failure to timely report an abuse allegation in October 2023, but no fines or enforcement actions were listed in the available reports. Prior deficiencies mainly involved resident care, safety, and documentation, with recurring concerns about environment and supervision. The facility’s deficiencies appear persistent over time, with no clear improvement trend evident from the reports.

Read the full inspection reports for this facility, including detailed findings and corrective actions.

Show Inspection Reports

Health Inspection History

Inspections since 2018
Total health inspections 4

Maryland average 3.9


Last Health inspection on Aug 2024

Total health citations
44 Rank #82 / 146Health citations — State benchmarkedThis home is ranked 82nd out of 146 homes in Maryland. Shows this facility's total health deficiency citations benchmarked to the Maryland State average, with a ranking across all 146 MD SNFs. Lower citation counts earn a better rank.Click the rank badge to see the full State ranking.Click here to see the full State ranking.

Maryland average 49.9

Citations per inspection
11 Rank #68 / 146Citations per inspection — State benchmarkedThis home is ranked 68th out of 146 homes in Maryland. Shows average deficiency citations per CMS inspection for this facility versus the Maryland mean across 146 SNFs with citation data. Lower is better.Click the rank badge to see the full State ranking.Click here to see the full State ranking.

Maryland average 12.81


Health citations are formal notices following inspections when they fail to comply with safety and care standards.

43 of 44 citations resulted from standard inspections; and 1 of 44 resulted from complaint investigations.

Breakdown of citation severity (last 8 years)
Critical Health citations
1
100% worse than Maryland average

Maryland average: 0.5


Serious Health citations
0
100% better than Maryland average

Maryland average: 0.6

1 critical citation Maryland average: 0.5

0 serious citations Maryland average: 0.6

43 moderate citations Maryland average: 47.2

0 minor citations Maryland average: 1.7
Citations history (last 8 years)
Environmental moderate citation Aug 14, 2024
Corrected

Nursing Services moderate citation Aug 14, 2024
Corrected

Nutrition moderate citation Aug 14, 2024
Corrected

Quality of Care critical citation Aug 14, 2024
Corrected

Staffing Data

Reporting period: October 1 – December 31, 2025 (Q4 2025). Source: CMS Payroll-Based Journal report.

Total staff 157
Employees 149
Contractors 8
Staff to resident ratio 1.23:1
32% worse than Maryland average
Maryland average ratio: 1.81:1 Maryland average ratio: 1.81:1See full Maryland ranking
Avg staff/day 70
Average shift 8.3 hours
0% compared with Maryland average
Maryland average: 8 hours Maryland average shift: 8 hoursSee full Maryland ranking
Total staff hours (quarter) 53,349

Nursing staff breakdown

Q4 2025 · Oct 1 – Dec 31 More info This data comes from the CMS Payroll-Based Journal report covering October 1 – December 31, 2025.
Registered Nurse

Manages medical care and health needs.

RN Staff 16
Average shift length Info Average shift length. Calculated as total hours divided by days worked and average staff per day. 8.5 hours

No contractors work on this role.

Licensed Practical Nurse

Assists with medical care and medications.

LPN Staff 28
Average shift length Info Average shift length. Calculated as total hours divided by days worked and average staff per day. 8.3 hours

No contractors work on this role.

Certified Nursing Assistant

Helps with daily care and mobility.

CNA Staff 81
Average shift length Info Average shift length. Calculated as total hours divided by days worked and average staff per day. 8.2 hours

No contractors work on this role.

Contractor staffing

Q4 2025 · Oct 1 – Dec 31 More info This data comes from the CMS Payroll-Based Journal report covering October 1 – December 31, 2025.

Total hours from contractors

3.6%

1,894 contractor hours this quarter

Occupational Therapist: 8

Staff by category

Q4 2025 · Oct 1 – Dec 31 More info This data comes from the CMS Payroll-Based Journal report covering October 1 – December 31, 2025.
Certified Nursing Assistant8108126,64992100%8.2
Licensed Practical Nurse2802810,89192100%8.3
Registered Nurse160165,03192100%8.5
Clinical Nurse Specialist7072,0678087%7.5
RN Director of Nursing4041,9448188%8
Occupational Therapist0881,8948087%11.7
Other Dietary Services Staff5051,8299098%7.8
Administrator2026166470%8
Nurse Practitioner1015146975%7.4
Dental Services Staff1015056166%8.3
Dietitian1014525762%7.9
Mental Health Service Worker1014334751%9.2
Occupational Therapy Aide1014106065%6.8
Medical Director1011121415%8
81 Certified Nursing Assistant
% of Days 100%
28 Licensed Practical Nurse
% of Days 100%
16 Registered Nurse
% of Days 100%
7 Clinical Nurse Specialist
% of Days 87%
4 RN Director of Nursing
% of Days 88%
8 Occupational Therapist
% of Days 87%
5 Other Dietary Services Staff
% of Days 98%
2 Administrator
% of Days 70%
1 Nurse Practitioner
% of Days 75%
1 Dental Services Staff
% of Days 66%
1 Dietitian
% of Days 62%
1 Mental Health Service Worker
% of Days 51%
1 Occupational Therapy Aide
% of Days 65%
1 Medical Director
% of Days 15%

Penalties and fines

Includes penalties issued in 2024

Federal penalties imposed by CMS for regulatory violations, including civil money penalties (fines) and denials of payment for new Medicare/Medicaid admissions.

Source: CMS Penalties Database (Data as of Jan 2026)

Total fines amount $10K Rank #92 / 146Federal fines — State benchmarkedThis home is ranked 92nd out of 146 homes in Maryland. Shows this facility's cumulative CMS federal fine dollars versus the Maryland average among facilities with fines, and where it ranks among 146 skilled nursing facilities in the pool. Lower total dollars mean a better rank.Click the rank badge to see the full State ranking.Click here to see the full State ranking.
84% lower than Maryland average

Maryland average: $61K

Number of fines 1
33% fewer fines than Maryland average

Maryland average: 1.5

Payment Denials Info Serious action where Medicare and/or Medicaid temporarily stops payments for new residents until issues are fixed. 0
100% fewer payment denials than Maryland average

Maryland average: 0.1

Fines amount comparison
This facility $10K
Maryland average $61K
Penalty History

Penalties are imposed by CMS for violations of federal nursing home regulations.

1 penalty in the past 3 years

Aug 14, 2024 · $10K

Civil Money Penalty Info Fines imposed for noncompliance, which can be assessed per day or per instance of violation. Aug 14, 2024
$10K

Last updated: Jan 2026

Quality of care over time

These measures show how residents usually do over time at this home, based on health outcomes and preventive care.

High-risk clinical events score Info A composite score based on pressure ulcers, falls with injury, weight loss, walking ability decline, and activities of daily living decline. 11.1
14% better than Maryland average

Maryland average: 12.9

Functional decline score Info A composite score based on activities of daily living decline, walking ability decline, and incontinence. 26.4
In line with Maryland average

Maryland average: 25.7

Long-stay resident measures
Significantly above average Maryland avg: 3.7 Info CMS star rating based on long-stay quality measure performance. 5 stars = significantly above average, 1 star = significantly below average.
Need for Help with Daily Activities Increased Info Percent of long-stay residents whose need for help with daily activities has increased 26.9%
13% worse than Maryland average

Maryland average: 23.7%

Walking Ability Worsened Info Percent of long-stay residents whose ability to move independently worsened 18.8%
32% better than Maryland average

Maryland average: 27.7%

Low Risk Residents with Bowel/Bladder Incontinence Info Percent of low risk long-stay residents who lose control of their bowels or bladder 33.4%
29% worse than Maryland average

Maryland average: 25.9%

Falls with Major Injury Info Percent of long-stay residents experiencing one or more falls with major injury 1.9%
17% better than Maryland average

Maryland average: 2.3%

High Risk Residents with Pressure Ulcers Info Percent of long-stay high risk residents with pressure ulcers 4.3%
34% better than Maryland average

Maryland average: 6.5%

Urinary Tract Infection Info Percent of long-stay residents with a urinary tract infection 0.3%
83% better than Maryland average

Maryland average: 1.6%

Lost Too Much Weight Info Percent of long-stay residents who lose too much weight 3.6%
38% better than Maryland average

Maryland average: 5.8%

Depressive Symptoms Info Percent of long-stay residents who have depressive symptoms 25.1%
24% worse than Maryland average

Maryland average: 20.2%

Antipsychotic Use Info Percent of long-stay residents who received an antipsychotic medication 3.8%
71% better than Maryland average

Maryland average: 12.9%

Pneumococcal Vaccine Info Percent of long-stay residents assessed and appropriately given the pneumococcal vaccine 96.0%
In line with Maryland average

Maryland average: 92.0%

Influenza Vaccine Info Percent of long-stay residents assessed and appropriately given the seasonal influenza vaccine 97.1%
In line with Maryland average

Maryland average: 96.6%

Hospitalizations per 1,000 days Info Number of hospitalizations per 1,000 long-stay resident days. 0.79
40% better than Maryland average

Maryland average: 1.32

ED visits per 1,000 days Info Number of outpatient emergency department visits per 1,000 long-stay resident days. 0.69
43% better than Maryland average

Maryland average: 1.21

Short-stay resident measures
Significantly above average Maryland avg: 3.7 Info CMS star rating based on short-stay quality measure performance. 5 stars = much above average, 1 star = much below average.
Pneumococcal Vaccine Info Percent of short-stay residents assessed and appropriately given the pneumococcal vaccine 76.2%
In line with Maryland average

Maryland average: 78.4%

Antipsychotic medication increase Info Percent of short-stay residents who newly received an antipsychotic medication 1.1%
19% better than Maryland average

Maryland average: 1.4%

Influenza Vaccine Info Percent of short-stay residents assessed and appropriately given the seasonal influenza vaccine 68.0%
16% worse than Maryland average

Maryland average: 80.6%

Re-hospitalized after SNF stay Info Percentage of short-stay residents who were re-hospitalized after their nursing home admission. 20.3%
In line with Maryland average

Maryland average: 21.2%

Emergency department visits Info Percentage of short-stay residents who had an outpatient emergency department visit. 7.6%
23% better than Maryland average

Maryland average: 9.9%

Falls with major injury Info Percentage of SNF residents who experience falls with major injury during their stay. 1.1%
45% worse than Maryland average

Maryland average: 0.8%

Ability to care for self at discharge Info Percentage of residents at or above expected ability to care for themselves at discharge. 56.7%
6% better than Maryland average

Maryland average: 53.7%

Successful return to home or community Info Rate of successful return to home or community from a skilled nursing facility. 57.3%
13% better than Maryland average

Maryland average: 50.6%

Breakdown by payment type

Medicare

66% of new residents, usually for short-term rehab.

Typical stay 1 months

Private pay

31% of new residents, often for short stays.

Typical stay 1 - 2 months

Medicaid

4% of new residents, often for long-term daily care.

Typical stay 3 years

Facility Characteristics

Source: CMS Long-Term Care Facility Characteristics (Data as of Jan 2026)

Total residents 128
Medicare
31
24.2% of residents
Medicaid
67
52.3% of residents
Private pay or other
30
23.4% of residents
Programs & Services
Residents Group

Residents meet regularly to discuss policies, care quality, and activities

Nurse Aide Training

State-approved Nurse Aide Training and Competency Evaluation Program on-site

Active Resident Council

Organized group of residents that meets regularly to discuss facility policies, quality of life, and activities.

Finances and operations

Privately-owned community
Operated by a business corporation.
Home revenue
$29.8M
Profit
$547.8K
Privately-owned community Operated by a business corporation.
Home revenue
$29.8M Rank #28 / 145Revenue — State benchmarkedThis home is ranked 28th out of 145 homes in Maryland. Shows this facility's annual revenue compared to the Maryland SNF average. Higher revenue generally means more resources for staffing and capital — read alongside Payroll %.Click the rank badge to see the full State ranking.Click here to see the full State ranking.
Profit
$547.8K
Payroll costs Info The portion of the home's budget spent on staff, including nurses, caregivers, and other employees who support care and operations. Rank #72 / 145Payroll — State benchmarkedThis home is ranked 72nd out of 145 homes in Maryland. Shows total annual staff payroll benchmarked to the Maryland average. Higher payroll investment relative to peers often signals better staffing and less reliance on cheaper contract labor.Click the rank badge to see the full State ranking.Click here to see the full State ranking.
$8.4M
28.1% of revenue Rank #139 / 145Payroll % — State benchmarkedThis home is ranked 139th out of 145 homes in Maryland. Shows payroll as a percentage of revenue versus the Maryland average. Well-run Maryland SNFs typically land around 49–57% — the top third Statewide. Below 25% may signal understaffing or heavy agency use — read with Staffing ratings.Click the rank badge to see the full State ranking.Click here to see the full State ranking.
Other operating costs Info All remaining costs needed to run the home, such as food, utilities, building maintenance, supplies and administrative expenses.
$20.9M
Total costs $29.3M

What does this home offer?

Total residents icon

Total Residents: 156

Building type icon
Building type icon

Building Type: Two-story

Who this home usually serves

TYPE OF STAY

Mostly short-term rehab stays

Most residents typically stay for a few weeks or months before returning home or moving on.

Places of interest near Sterling Care Forest Hill

Address 2.2 miles from city center Info Estimated distance in miles from Forest Hill's city center to Sterling Care Forest Hill's address, calculated via Google Maps.

Calculate Travel Distance to Sterling Care Forest Hill

Add your location

Address

Financial Assistance for
Nursing Home in Maryland

Sterling Care Forest Hill is located in Forest Hill, Maryland.
Here are the financial assistance programs available to residents in Maryland.

Get Financial aid guidance

Community Options Waiver

Maryland Medicaid Community Options Waiver

Age 65+ or disabled
General Maryland resident, Medicaid- eligible, nursing home-level care need.
Income Limits (2025) ~$2,829/month 300% FBR, individual
Asset Limits $2,000 (individual), $3,000 (couple) (excludes home, car).
MD

High urban demand; rural outreach efforts.

Benefits
Personal care (5-7 hours/day, e.g., bathing, dressing) Respite care (up to 240 hours/year) Adult day care ($70/day) Home modifications ($1,500 avg.)

Senior Care Program

Maryland Senior Care

Age 65+
General Maryland resident, at risk of nursing home placement.
Income Limits ~$2,000/month individual, varies by county
Asset Limits $11,000 individual
MD

Limited funding; waitlists common in high-demand areas.

Benefits
In-home care (3-5 hours/week) Respite care (up to 10 days/year) Meals (~$6/meal) Transportation (~5 trips/month) Case management

Maryland Nursing Home Medicaid

Maryland Medical Assistance (Medicaid) Nursing Home Program

Age 65+
General Maryland resident, Medicaid-eligible, requires nursing home-level care.
Income Limits (2025) $943/month (individual); most income applied to care costs.
Asset Limits $2,500 (individual), $3,000 (couple); spousal protections up to $155,356.
MD

Home equity limit $636,000; estate recovery applies post-55.

Benefits
24/7 nursing care Meals Therapy Medications (unlimited per medical need)

Senior Assisted Living Subsidy Program

Maryland Senior Assisted Living Group Home Subsidy

Age 62+
General Maryland resident, in or moving to approved assisted living, low/moderate income.
Income Limits (2025) ~$34,000/year individual, varies by county
Asset Limits Not strict; prioritizes low-income.
MD

Not available statewide; facility must be licensed by MDH.

Benefits
Personal care Meals 24-hour supervision (up to $1,500/month subsidy typical)

Veterans Aid and Attendance (A&A) Benefit

Maryland VA Aid and Attendance

Age
General Wartime veteran/spouse, age 65+ or disabled, needs ADL help, Maryland resident.
Income Limits (2025) Net income minus medical expenses < $1,984/month individual with A&A
Asset Limits $155,356 net worth limit
MD

High veteran population in suburban/rural areas.

Benefits
Cash benefit ($1,478-$2,471/month, varies by status) for care costs

Senior Prescription Drug Assistance Program (SPDAP)

Maryland Senior Prescription Drug Assistance Program

Age 65+
General Maryland resident (6+ months), Medicare Part D enrolled.
Income Limits (2025) $48,560/year individual, 300% FPL
Asset Limits None specified.
MD

Supplements Medicare Part D; annual enrollment required.

Benefits
Up to $40/month premium subsidy Reducing drug costs

Medicare Savings Programs (MSP)

Maryland Medicare Savings Programs

Age 65+
General Maryland resident, Medicare Part A/B enrollee.
Income Limits (2025) $2,014/month (QMB), $2,706/month (SLMB/QI, individual).
Asset Limits $9,090 (individual), $13,630 (couple).
MD

Includes QMB, SLMB, QI categories.

Benefits
Covers premiums (up to $174.70/month Part B) Co-pays Deductibles

Community Personal Assistance Services (CPAS)

Maryland Medicaid Community Personal Assistance Services

Age 65+
General Maryland resident, Medicaid-eligible, needs ADL assistance.
Income Limits (2025) $943/month (individual); spend-down available.
Asset Limits $2,500 (individual), $3,000 (couple).
MD

Consumer-directed option allows hiring family caregivers.

Benefits
Personal care (hours vary, typically 20-30/week) Chores Nurse supervision

Frequently Asked Questions about Sterling Care Forest Hill

What neighborhood is Sterling Care Forest Hill in?

Sterling Care Forest Hill is in the Forest Hill neighborhood of Forest Hill.

Is Sterling Care Forest Hill in a walkable area?

Sterling Care Forest Hill has a walk score of 61. Moderately walkable. Some errands can be accomplished on foot, with a mix of nearby amenities.

What is the address of Sterling Care Forest Hill?

Sterling Care Forest Hill is located at 109 Forest Valley Dr, Forest Hill, MD 21050, United States.

What is the phone number of Sterling Care Forest Hill?

(410) 838-0101 will put you in contact with the team at Sterling Care Forest Hill.

Is Sterling Care Forest Hill Medicare or Medicaid certified?

Yes — Sterling Care Forest Hill is a CMS-certified provider of Medicare and Medicaid.

Guides for Better Senior Living

Care Cost Calculator: See Prices in Your Area

Nursing Home Data Explorer

Don’t Wait Too Long: 7 Red Flag Signs Your Parent Needs Assisted Living Now

The True Cost of Assisted Living in 2025 – And How Families Are Paying For It

Understanding Senior Living Costs: Pricing Models, Discounts & Financial Assistance

Explore Open Rooms
1 Contact details
2 What type of senior care service are you looking for?
3 What budget do you have in mind for senior care?
4 How soon do you need to find care?
5 Additional details

Thank you for your interest!

Our team will be in touch shortly to help with next steps.