


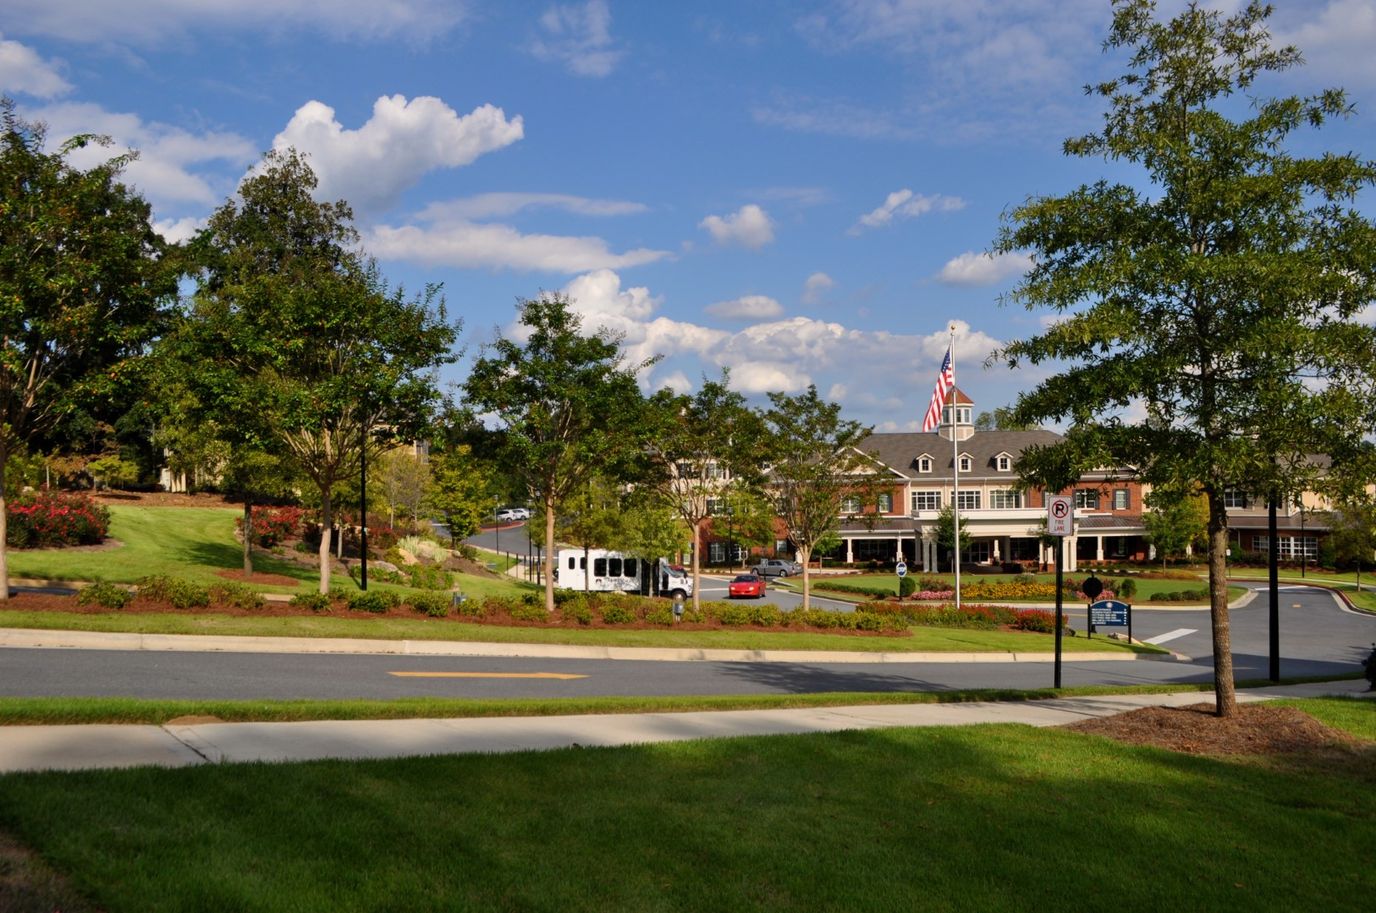
Sterling Estates of East Cobb Retirement Community
Assisted Living, Nursing Home, Independent Living, Memory Care & Respite Care · Marietta, GA


Sterling Estates of East Cobb Retirement Community
Assisted Living, Nursing Home, Independent Living, Memory Care & Respite Care · Marietta, GA
Spend your golden years at Sterling Estates of East Cobb Retirement Community, an exceptional community in Marietta, GA, offering independent living and assisted living. Residents can maintain their independence with specially designed and spacious one- and two-bedroom floor plans, dedicated to their comfort and convenience. Those needing assistance also receive top-notch care from a kind and compassionate team.
Recreation spaces and various local amenities are available nearby, providing residents with leisure and wellness opportunities. With delightful dining options, residents have the finest dining experience that satisfies their dietary needs and preferences. Residents can keep their peace of mind amidst the community’s vibrant and friendly environment.
110-bed community Rank #153 / 666Bed count — State benchmarkedThis home is ranked 153rd out of 666 homes in Georgia for Bed Count. Shows this facility's certified or reported bed count compared to other Georgia facilities. Larger communities may offer more amenities, programs, and on-site services for residents and families.Facilities with the same value for a metric share the same rank. Rankings are based only on facilities in Georgia that report data for that category. Facilities without available data are excluded from the ranking.Click the rank badge to see the full State ranking.Click here to see the full State ranking.
A larger shared setting that may offer more common spaces and organized community services.
11 years in operation Rank #214 / 669Years in operation — State benchmarkedThis home is ranked 214th out of 669 homes in Georgia for Years In Operation. Shows how long this facility has been in operation compared to other Georgia facilities. Longer operating histories may benefit residents, families, and staff.Facilities with the same value for a metric share the same rank. Rankings are based only on facilities in Georgia that report data for that category. Facilities without available data are excluded from the ranking.Click the rank badge to see the full State ranking.Click here to see the full State ranking.
A community with a solid operating history and experience delivering ongoing care.
Walk Score: 9 / 100 Rank #738 / 870Walk Score — State benchmarkedThis home is ranked 738th out of 870 homes in Georgia for Walk Score. Shows how walkable this facility's neighborhood is compared to the average Walk Score across Georgia facilities. Higher scores benefit residents, families, and staff.Facilities with the same value for a metric share the same rank. Rankings are based only on facilities in Georgia that report data for that category. Facilities without available data are excluded from the ranking.Click the rank badge to see the full State ranking.Click here to see the full State ranking.
Car-dependent. Most errands require a car, with limited nearby walkable options.
About this community
Facility TypeAssisted Living Community
IssuanceApril 21, 2015
CountyCobb
Sterling Estates of East Cobb Retirement Community is administered by Marshall Gill.
Inspection History
In Georgia, the Department of Community Health, Healthcare Facility Regulation Division conducts unannounced inspections to ensure facilities adhere to state health and safety requirements.
Since 2017 · 9 years of data
62 deficiencies
21 inspections
Inspection Scorecard
 This scorecard compares key inspection, deficiency, and complaint metrics at this facility against the Georgia state average. Metrics rated ≥15% worse than average are highlighted in red; those ≥15% better are highlighted in green.
Since 2017 vs. Georgia state average
Overall vs. GA average
3 Worse
Metrics worse than Georgia average:
• Total deficiencies (195% above)
• Deficiencies per year (200% above)
• Deficiencies per inspection (150% above) 0 Better No metrics in this bucket.
• Total deficiencies (195% above)
• Deficiencies per year (200% above)
• Deficiencies per inspection (150% above) 0 Better No metrics in this bucket.
Deficiencies
| This Facility | GA Average | vs. GA Avg |
|---|---|---|---|
|
Total deficiencies
| 62 | 21 | This facility has 195% more total deficiencies than a typical Georgia assisted living residence (62 vs. GA avg 21).↑ 195% worse |
|
Deficiencies per year
| 6.9 | 2.3 | This facility has 200% more deficiencies per year than a typical Georgia assisted living residence (6.9 vs. GA avg 2.3).↑ 200% worse |
|
Deficiencies per inspection
| 3 | 1.2 | This facility has 150% more deficiencies per inspection than a typical Georgia assisted living residence (3 vs. GA avg 1.2).↑ 150% worse |
Inspections
| This Facility | GA Average | vs. GA Avg |
|---|---|---|---|
|
Total inspections
| 21 | 17 | This facility has had 24% more total inspections than the Georgia average (21 vs. GA avg 17). More inspections can mean more regulatory scrutiny rather than worse care.↑ 24% more |
Inspection Reports Summary
An editor-reviewed summary of the themes and findings across this facility's recent inspection reports.
- May 1, 2025 complaint investigation found no violations and closed with no deficiencies cited.
- June 6, 2023 complaint investigation substantiated staff obstructed emergency medical responders, delaying care for a resident in the lobby.
- December 31, 2018 complaint investigation cited three deficiencies including lack of CPR training, fire safety violations, and food contamination risk from chemical storage.
What does this home offer?
No pets allowed
Housing Options: 1 Bed / 2 Bed
Building Type: 2-story
Beauty Services
Social and Recreational Activities
Exercise Programs

Wellness Programs
Swimming Pool
Places of interest near Sterling Estates of East Cobb Retirement Community
![]() 7.8 miles from city center
7.8 miles from city center
![]() Estimated distance in miles from Marietta's city center to Sterling Estates of East Cobb Retirement Community's address, calculated via Google Maps.
Estimated distance in miles from Marietta's city center to Sterling Estates of East Cobb Retirement Community's address, calculated via Google Maps.
Calculate Travel Distance to Sterling Estates of East Cobb Retirement Community
Add your location
Compare Assisted Living around Marietta
The information below is reported by the Georgia Department of Community Health, Healthcare Facility Regulation Division.
| The A.G. Rhodes – Marietta | AL MC NH SNF | Marietta | 130
Facility
130
GA AVG
87
Rank
#95 / 666 |
92.3%
Facility
92.3%
GA AVG
79.2
Rank
#32 / 159 | +17% | 4.34
Facility
4.34
GA AVG
3.56
Rank
#29 / 193 | -54% | +22% | $0
Facility
$0
GA AVG
$38.9k
Rank
#1 / 195 | 15
Facility
15
GA AVG
16.6
Rank
#99 / 194 | 3.0
Facility
3.0
GA AVG
4.7
Rank
#41 / 194 | 5 | 120 | - |
53
Facility
53
GA AVG
39
Rank
#276 / 870 | Loretta Barnes | $16.8MFiscal year ending 06/2024
Facility
$16.8MFiscal year ending 06/2024
GA AVG
$15.7M
Rank
#43 / 188 | $7.0MFiscal year ending 06/2024
Facility
$7.0MFiscal year ending 06/2024
GA AVG
$4.3M
Rank
#32 / 188 | 41.6%Fiscal year ending 06/2024
Facility
41.6%Fiscal year ending 06/2024
GA AVG
42.6%
Rank
#111 / 188 | 115521 | ||||
| Autumn Breeze Healthcare Center | AL IL MC NH | Marietta | 109
Facility
109
GA AVG
87
Rank
#165 / 666 |
43.1%
Facility
43.1%
GA AVG
79.2
Rank
#153 / 159 | -46% | 2.82
Facility
2.82
GA AVG
3.56
Rank
#166 / 193 | -63% | -21% | $0
Facility
$0
GA AVG
$38.9k
Rank
#1 / 195 | 11
Facility
11
GA AVG
16.6
Rank
#61 / 194 | 3.7
Facility
3.7
GA AVG
4.7
Rank
#68 / 194 | 5 | 47 | - |
29
Facility
29
GA AVG
39
Rank
#546 / 870 | Ronald Gooden | $7.3MFiscal year ending 06/2024
Facility
$7.3MFiscal year ending 06/2024
GA AVG
$15.7M
Rank
#140 / 188 | $5.0MFiscal year ending 06/2024
Facility
$5.0MFiscal year ending 06/2024
GA AVG
$4.3M
Rank
#109 / 188 | 68.3%Fiscal year ending 06/2024
Facility
68.3%Fiscal year ending 06/2024
GA AVG
42.6%
Rank
#27 / 188 | 115580 | ||||
| A.G. Rhodes | AL MC NH SNF | Marietta | 138
Facility
138
GA AVG
87
Rank
#84 / 666 |
91.5%
Facility
91.5%
GA AVG
79.2
Rank
#38 / 159 | +16% | 4.18
Facility
4.18
GA AVG
3.56
Rank
#33 / 193 | -36% | +17% | $0
Facility
$0
GA AVG
$38.9k
Rank
#1 / 195 | 16
Facility
16
GA AVG
16.6
Rank
#108 / 194 | 3.2
Facility
3.2
GA AVG
4.7
Rank
#51 / 194 | - | 126 | - |
91
Facility
91
GA AVG
39
Rank
#5 / 870 | Machele Pace | $16.1MFiscal year ending 06/2024
Facility
$16.1MFiscal year ending 06/2024
GA AVG
$15.7M
Rank
#56 / 188 | $8.0MFiscal year ending 06/2024
Facility
$8.0MFiscal year ending 06/2024
GA AVG
$4.3M
Rank
#27 / 188 | 50.1%Fiscal year ending 06/2024
Facility
50.1%Fiscal year ending 06/2024
GA AVG
42.6%
Rank
#41 / 188 | 115275 | ||||
| Marietta Center for Nursing and Healing | AL HOS NH PC RC SNF | Marietta (Northwest Marietta Historic District) | 154
Facility
154
GA AVG
87
Rank
#64 / 666 |
80.5%
Facility
80.5%
GA AVG
79.2
Rank
#95 / 159 | +2% | 2.96
Facility
2.96
GA AVG
3.56
Rank
#146 / 193 | -5% | -17% | $7.9k
Facility
$7.9k
GA AVG
$38.9k
Rank
#133 / 195 | 32
Facility
32
GA AVG
16.6
Rank
#174 / 194 | 6.4
Facility
6.4
GA AVG
4.7
Rank
#151 / 194 | 3 | 124 | - |
11
Facility
11
GA AVG
39
Rank
#719 / 870 | Kristine Aibangbee | $15.9MFiscal year ending 06/2024
Facility
$15.9MFiscal year ending 06/2024
GA AVG
$15.7M
Rank
#50 / 188 | $6.7MFiscal year ending 06/2024
Facility
$6.7MFiscal year ending 06/2024
GA AVG
$4.3M
Rank
#59 / 188 | 42.3%Fiscal year ending 06/2024
Facility
42.3%Fiscal year ending 06/2024
GA AVG
42.6%
Rank
#145 / 188 | 115206 |
Financial Assistance for
Assisted Living in Georgia
Sterling Estates of East Cobb Retirement Community is located in Marietta, Georgia.
Here are the financial assistance programs available to residents in Georgia.
Frequently Asked Questions about Sterling Estates of East Cobb Retirement Community
What neighborhood is Sterling Estates of East Cobb Retirement Community in?
Sterling Estates of East Cobb Retirement Community is in the Lower Roswell Road Southeast neighborhood of Marietta.
Is Sterling Estates of East Cobb Retirement Community in a walkable area?
Sterling Estates of East Cobb Retirement Community has a walk score of 9. Car-dependent. Most errands require a car, with limited nearby walkable options.
Are pets allowed at Sterling Estates of East Cobb Retirement Community?
No, Sterling Estates of East Cobb Retirement Community has a no-pet policy.
Who is the administrator of Sterling Estates of East Cobb Retirement Community?
Marshall Gill is the administrator of Sterling Estates of East Cobb Retirement Community.
How many beds does Sterling Estates of East Cobb Retirement Community have?
Sterling Estates of East Cobb Retirement Community has 110 beds.
Are there photos of Sterling Estates of East Cobb Retirement Community?
Yes — there are 6 photos of Sterling Estates of East Cobb Retirement Community in the photo gallery on this page.
What is the address of Sterling Estates of East Cobb Retirement Community?
Sterling Estates of East Cobb Retirement Community is located at 4220 Lower Roswell Rd, Marietta, GA 30068.
Guides for Better Senior Living
Care Cost Calculator: See Prices in Your Area
Nursing Home Data Explorer
Don’t Wait Too Long: 7 Red Flag Signs Your Parent Needs Assisted Living Now
The True Cost of Assisted Living in 2025 – And How Families Are Paying For It
Understanding Senior Living Costs: Pricing Models, Discounts & Financial Assistance
Updated on
