Stockton Nursing Center

Nursing Home
Overview of Stockton Nursing Center

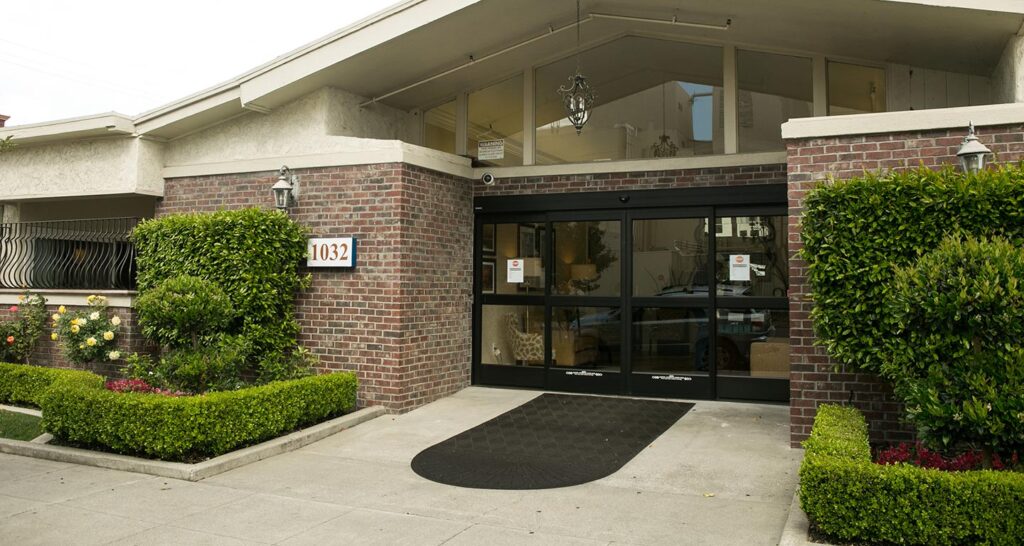
Located at 1801 N. California St. in Stockton, California, Stockton Nursing Center is dedicated to providing exceptional skilled nursing, short-term rehabilitation, and long-term care services in a compassionate and comfortable environment. With a mission to treat every patient with the utmost care and respect, the center’s team of professionals crafts tailored solutions to ensure each individual receives the best possible service. Recognizing the importance of a healing environment, Stockton Nursing Center surrounds its residents with soothing views and a family-like atmosphere.

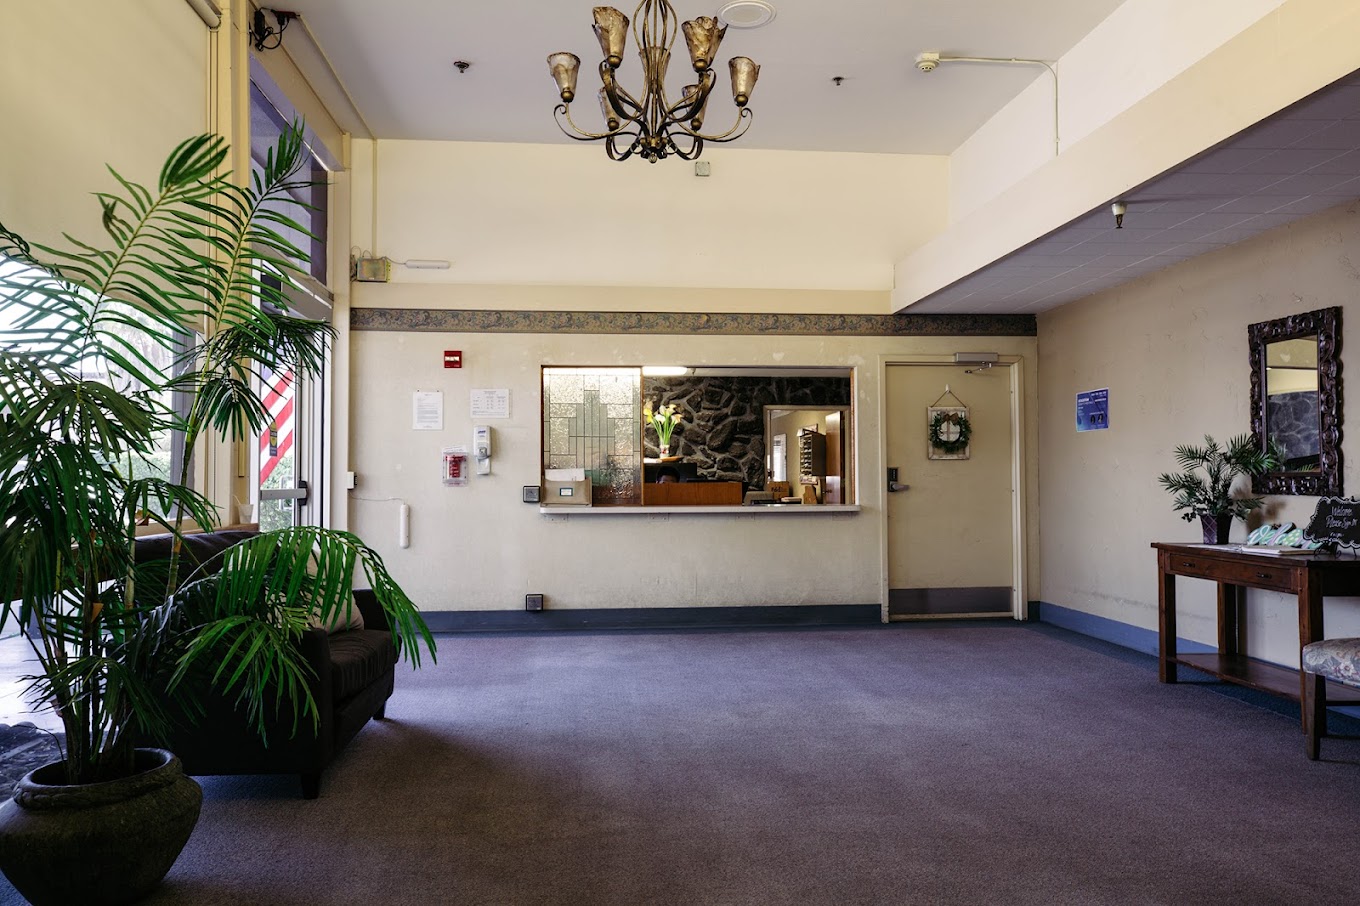
The center’s comprehensive treatment plan includes 24-hour skilled nursing care, specialized rehabilitation therapies, and a collaborative approach to create personalized, nurturing care plans that address the unique needs of each guest. Stockton Nursing Center’s skilled team of licensed nurses, therapists, social workers, and activities coordinators work together to facilitate a swift and effective recovery, with a focus on promoting overall well-being and independence. By providing a relaxed and comfortable setting, the center aims to support its residents’ complete healing and help them continue enjoying the lives they love.

(209) 477-0271

Quality ratings

Measured by Centers for Medicare & Medicaid Services (CMS)

Overall rating Info Official CMS rating based on health inspections, staffing and quality measures.
1/5
California average: 3.1/5
Health Inspection Info Official CMS rating based on deficiencies found during state health inspections.
1/5
California average: 2.8/5
Staffing Info Official CMS rating based on nurse staffing hours per resident per day.
3/5
California average: 3.1/5
Quality Measures Info Official CMS rating based on clinical outcomes for residents.
2/5
California average: 4.1/5

Nursing care per resident

Info Average daily nursing hours per resident (adjusted for acuity). Higher values indicate more nursing time per resident.
4h 34m per day

This home provides 8% more nursing time per resident than the state average.

California average: 4h 13m per day

Capacity and availability

Medium-capacity home

Offers a balance of services and community atmosphere.

Total beds 119

This home usually has limited availability

Occupancy is moderate, suggesting balanced demand.

Similar demand to the California average
Occupancy rate 91.4%
Residents per day (avg) 111
Occupancy rate
91.4%
Residents per day (avg)
111

Who this home usually serves

TYPE OF STAY

Mostly long-term care residents

Most residents stay for extended periods and receive ongoing daily care.

Might be optimal for
Long-term daily care Ongoing support needs

Breakdown by payment type

Medicare

18% of new residents, usually for short-term rehab.

Typical stay 1 - 2 months

Private pay

46% of new residents, often for short stays.

Typical stay 1 months

Medicaid

36% of new residents, often for long-term daily care.

Typical stay 1 - 2 years

Finances and operations

Proprietary home
Corporation
Home revenue
$13.4M
Operating loss
-$531.0K
Proprietary home Corporation
Home revenue
$13,441,356.00
Operating loss
$-531,021.00
Payroll costs Info The portion of the home's budget spent on staff, including nurses, caregivers, and other employees who support care and operations.
$7.0M
52.3% of revenue
Other operating costs Info All remaining costs needed to run the home, such as food, utilities, building maintenance, supplies and administrative expenses.
$6.9M
Total costs $14.0M
Walk Score
Walk Score: 71 / 100
Very walkable. Most errands can be accomplished on foot, and many essentials are within a short walk.

Additional licensing details

CMS Certification Number: 55201

Types of Care at Stockton Nursing Center

Skilled Nursing

Compare Nursing Homes around Stockton

The information below is reported by the California Department of Social Services and Department of Public Health.
Riverwood Health Care Center
MC

Memory Care Specialized care for those with Memory Loss, Alzheimer's, or dementia, ensuring safety and support.

SNF

Nursing Homes 24/7 care needed

RC

Respite Care

Stockton (Valley Oak)
99
No
A+
63
GITTLEMAN, MARTIN
90.5%
$15,616,013.00
$6,575,980.00
42.1%
89.00
5/5
4.2316
4/5
4/5
5/5
13
31
1
-2%
0%
+7%
Creekside Center
SNF

Nursing Homes 24/7 care needed

Stockton (Stonewood)
75
No
-
65
-
95.0%
$13,717,795.00
$4,625,700.00
33.7%
72.30
3/5
3.9942
3/5
2/5
4/5
-
41
-
-35%
-5%
+12%
Lincoln Square
HC

Hospice Care

SNF

Nursing Homes 24/7 care needed

Stockton (Civic Center)
68
No
-
80
ELLIS-SHERINIAN, TAYLOR
87.2%
$15,822,121.00
$5,566,314.00
35.2%
58.80
3/5
3.6593
2/5
3/5
5/5
-
55
-
-4%
-13%
+3%
Stockton Nursing Center
SNF

Nursing Homes 24/7 care needed

Stockton (Pacific)
119
No
-
71
STOCKTON NURSING AND REHAB CENTER, LLC
91.4%
$13,331,583.00
$7,029,428.00
52.7%
110.70
1/5
4.5657
1/5
3/5
2/5
7
110
2
-16%
+8%
+8%
Lincoln Square Post-Acute Care
SNF

Nursing Homes 24/7 care needed

Stockton
-
No
-
-
-
-
-
-
-
-
-
-
-
-
-
-
-
-
-
-
-

Places of interest near Stockton Nursing Center

Address 2.7 miles from city center — 1.24 miles to nearest hospital (DaVita Stockton Home Training Dialysis)
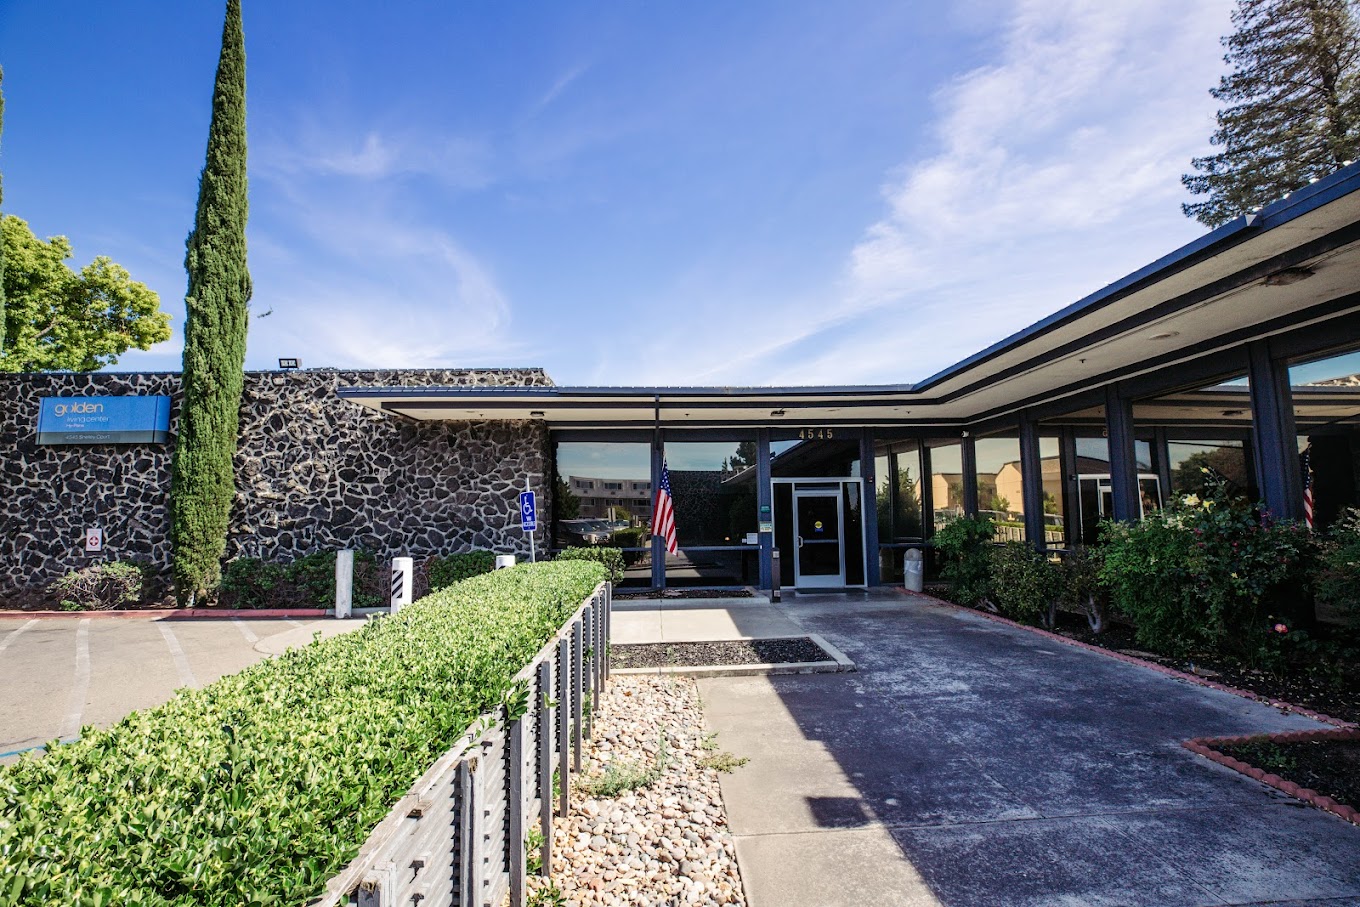
Address 4545 Shelley Ct, Stockton, CA 95207

Calculate Travel Distance to Stockton Nursing Center

Add your location

Address

Staffing Data

Source: CMS Payroll-Based Journal (Q2 2025)

181
Total Staff
154
Employees
27
Contractors
47,542
Total Hours (Quarter)
69
Avg Staff/Day
7.6
Avg Shift (hrs)
Nursing Staff Breakdown
Role Count Avg Shift (hrs) Uses Contractors?
Registered Nurse138 No
Licensed Practical Nurse318.2 No
Certified Nursing Assistant777.6 No
Staff by Category
Administration
2 staff
6.7hs shift avg
Nursing Staff
140 staff
7.8hs shift avg
Physicians & Practitioners
2 staff
6hs shift avg
Therapy Services
25 staff
4.7hs shift avg
Activities & Recreation
0 staff
0hs shift avg
Social Services
2 staff
3.6hs shift avg
Dietary Services
8 staff
7.9hs shift avg
Other Services
2 staff
8hs shift avg
Contractor Analysis
2.8%
of total hours from contractors
1,336 contractor hours this quarter
Physical Therapy Assistant: 4 Physical Therapy Aide: 3 Medical Director: 1 Speech Language Pathologist: 7 Qualified Social Worker: 2 Respiratory Therapy Technician: 9 Occupational Therapy Assistant: 1
Role Employees Contractors Total Staff Total Hours Days Worked % of Days Avg Shift (hrs)
Certified Nursing Assistant7707725,12291100%7.6
Licensed Practical Nurse3103110,06991100%8.2
Registered Nurse130133,48191100%8
Other Dietary Services Staff8082,26091100%7.9
Nurse Aide in Training140141,5367279%8.1
RN Director of Nursing5051,4667279%9.1
Dental Services Staff2029416774%8
Administrator1015126470%8
Nurse Practitioner1014796167%7.9
Physical Therapy Assistant0443856167%5
Speech Language Pathologist0773685459%5.7
Clinical Nurse Specialist1012436066%4.1
Respiratory Therapy Technician0991985763%2.8
Qualified Social Worker0221504246%3.6
Physical Therapy Aide0331393033%4.6
Occupational Therapy Aide101971314%7.4
Occupational Therapy Assistant01157910%6.3
Medical Director011391820%2.2

Health Inspection History

Inspections
Total health inspections 44

California average 12.5


Last Health inspection on Aug 2025

Total health citations 110
Citations per inspection
2.5

Health citations are formal notices following inspections when they fail to comply with safety and care standards.

54 of 110 citations resulted from standard inspections; 55 of 110 resulted from complaint investigations; and 1 of 110 came from combined inspections (standard and complaint).

Breakdown of citation severity (last 3 years)
Critical Health citations More info 0
100% better than California average

California average: 0.4


Serious Health citations More info 2
100% worse than California average

California average: 1

0 critical citations More info California average: 0.4

2 serious citations More info California average: 1

107 moderate citations More info California average: 47.2

1 minor citation More info California average: 1.5
Citations history (last 3 years)
Quality of Care moderate citation Aug 21, 2025
Corrected

Quality of Care moderate citation Aug 21, 2025
Corrected

Quality of Care moderate citation Aug 15, 2025
Corrected

Resident Rights moderate citation Aug 15, 2025
Corrected

Facility Characteristics

Source: CMS Long-Term Care Facility Characteristics (Data as of Jan 2026)

Ownership: For-Profit LLC
Resident Census by Payment Source
105 Total Residents
Medicare 1 (1%)
Medicaid 88 (83.8%)
Private Pay/Other 16 (15.2%)
Programs & Services
Residents' Group
Family Engagement

Active councils help families stay involved in care decisions and facility operations.

Quality of care over time

These measures show how residents usually do over time at this home, based on health outcomes and preventive care.

High-risk clinical events score Info A composite score based on pressure ulcers, falls with injury, weight loss, walking ability decline, and activities of daily living decline. 7.1
7% worse than California average

California average: 6.6

Functional decline score Info A composite score based on activities of daily living decline, walking ability decline, and incontinence. 16.7
48% worse than California average

California average: 11.3

Long-stay resident measures
Need for Help with Daily Activities Increased Info Percent of long-stay residents whose need for help with daily activities has increased 4.9%
55% better than California average

California average: 11.1%

Walking Ability Worsened Info Percent of long-stay residents whose ability to move independently worsened 18.4%
54% worse than California average

California average: 12.0%

Low Risk Residents with Bowel/Bladder Incontinence Info Percent of low risk long-stay residents who lose control of their bowels or bladder 26.8%
138% worse than California average

California average: 11.3%

Falls with Major Injury Info Percent of long-stay residents experiencing one or more falls with major injury 2.3%
35% worse than California average

California average: 1.7%

High Risk Residents with Pressure Ulcers Info Percent of long-stay high risk residents with pressure ulcers 4.1%
16% better than California average

California average: 5.0%

Urinary Tract Infection Info Percent of long-stay residents with a urinary tract infection 3.2%
157% worse than California average

California average: 1.2%

Lost Too Much Weight Info Percent of long-stay residents who lose too much weight 5.8%
38% worse than California average

California average: 4.2%

Depressive Symptoms Info Percent of long-stay residents who have depressive symptoms 0.6%
91% better than California average

California average: 6.7%

Antipsychotic Use Info Percent of long-stay residents who received an antipsychotic medication 16.5%
64% worse than California average

California average: 10.1%

Pneumococcal Vaccine Info Percent of long-stay residents assessed and appropriately given the pneumococcal vaccine 99.4%
In line with California average

California average: 98.5%

Influenza Vaccine Info Percent of long-stay residents assessed and appropriately given the seasonal influenza vaccine 97.3%
In line with California average

California average: 98.2%

Short-stay resident measures
Pneumococcal Vaccine Info Percent of short-stay residents assessed and appropriately given the pneumococcal vaccine 79.3%
16% worse than California average

California average: 94.0%

Antipsychotic medication increase Info Percent of short-stay residents who newly received an antipsychotic medication 6.8%
369% worse than California average

California average: 1.5%

Influenza Vaccine Info Percent of short-stay residents assessed and appropriately given the seasonal influenza vaccine 80.0%
14% worse than California average

California average: 93.2%

Penalties and fines

Federal penalties imposed by CMS for regulatory violations, including civil money penalties (fines) and denials of payment for new Medicare/Medicaid admissions.

Source: CMS Penalties Database (Data as of Jan 2026)

Total fines amount $93K
71% higher than California average

California average: $55K

Number of fines 6
154% more fines than California average

California average: 2.4

Payment Denials Info Serious action where Medicare and/or Medicaid temporarily stops payments for new residents until issues are fixed. 0
100% fewer payment denials than California average

California average: 0.5

Fines amount comparison
This facility $93K
California average $55K
Penalty History

Penalties are imposed by CMS for violations of federal nursing home regulations.

Civil Money Penalty Info Fines imposed for noncompliance, which can be assessed per day or per instance of violation. Feb 20, 2024
$5K
Civil Money Penalty Info Fines imposed for noncompliance, which can be assessed per day or per instance of violation. Feb 12, 2024
$8K
Civil Money Penalty Info Fines imposed for noncompliance, which can be assessed per day or per instance of violation. Jan 22, 2024
$19K
Civil Money Penalty Info Fines imposed for noncompliance, which can be assessed per day or per instance of violation. Dec 26, 2023
$9K

Last updated: Jan 2026

Guides for Better Senior Living

Care Cost Calculator: See Prices in Your Area

Nursing Home Data Explorer

Don’t Wait Too Long: 7 Red Flag Signs Your Parent Needs Assisted Living Now

The True Cost of Assisted Living in 2025 – And How Families Are Paying For It

Understanding Senior Living Costs: Pricing Models, Discounts & Financial Assistance

Financial Aid for California Seniors

Get financial aid guidance

Multipurpose Senior Services Program

MSSP (Medi-Cal Waiver)

Age 65+, California resident, Medi-Cal eligible, nursing home risk.

~$2,829/month (300% FBR, individual).

$2,000 (individual), $3,000 (couple).

County-managed; waitlists possible.

In-Home Supportive Services (IHSS)

California IHSS

Age 65+, California resident, Medicaid-eligible or low-income.

~$1,732/month (individual, Medi-Cal threshold).

$2,000 (individual).

Can hire family as caregivers.

Multipurpose Senior Services Program (MSSP)

CA MSSP

Age 65+, California resident, Medi-Cal-eligible, nursing home-eligible but community-capable.

~$2,829/month (300% FBR, individual).

$2,000 (individual).

Available in 38 counties; waitlists common.

Property Tax Postponement Program (PTP)

CA PTP

Age 62+, California resident, own and live in home, 40% equity.

~$51,500/year (household, adjusted annually).

Equity-based; no strict asset cap.

Deferred taxes accrue interest (5% as of 2024); repaid upon sale/death.

Assisted Living Waiver (ALW)

CA ALW

Age 65+ or disabled, California resident, Medi-Cal-eligible, nursing home-eligible.

~$2,829/month (300% FBR, individual).

$2,000 (individual).

Available in 15 counties (e.g., LA, Sacramento); waitlists common.

California CARES Program

CA CARES

Caregivers of California residents 60+ needing help with 3+ daily activities; no caregiver age limit.

No strict limit; cost-sharing above ~$2,500/month threshold.

Not applicable; need-based.

High demand in urban areas; complements IHSS respite.

Low-Income Home Energy Assistance Program (LIHEAP)

CA LIHEAP

Age 60+ priority, California resident, low-income, utility/heating need.

~$2,510/month (200% of poverty level, individual).

Not applicable; income-focused.

High demand in inland/coastal extremes; weatherization capped at $5,000/home.

Who we are

Your Senior Care Partner, Every Step of the Way

We help families find affordable senior communities and unlock same day discounts, Medicaid, and Medicare options tailored to your needs.

Contact us Today
Tour Icon
Planning a tour? Check our touring checklist.
Chat Icon
Thinking of living here? We can help you speak to a current resident