


Total health inspections
44
California average 12.5
Last Health inspection on Aug 2025
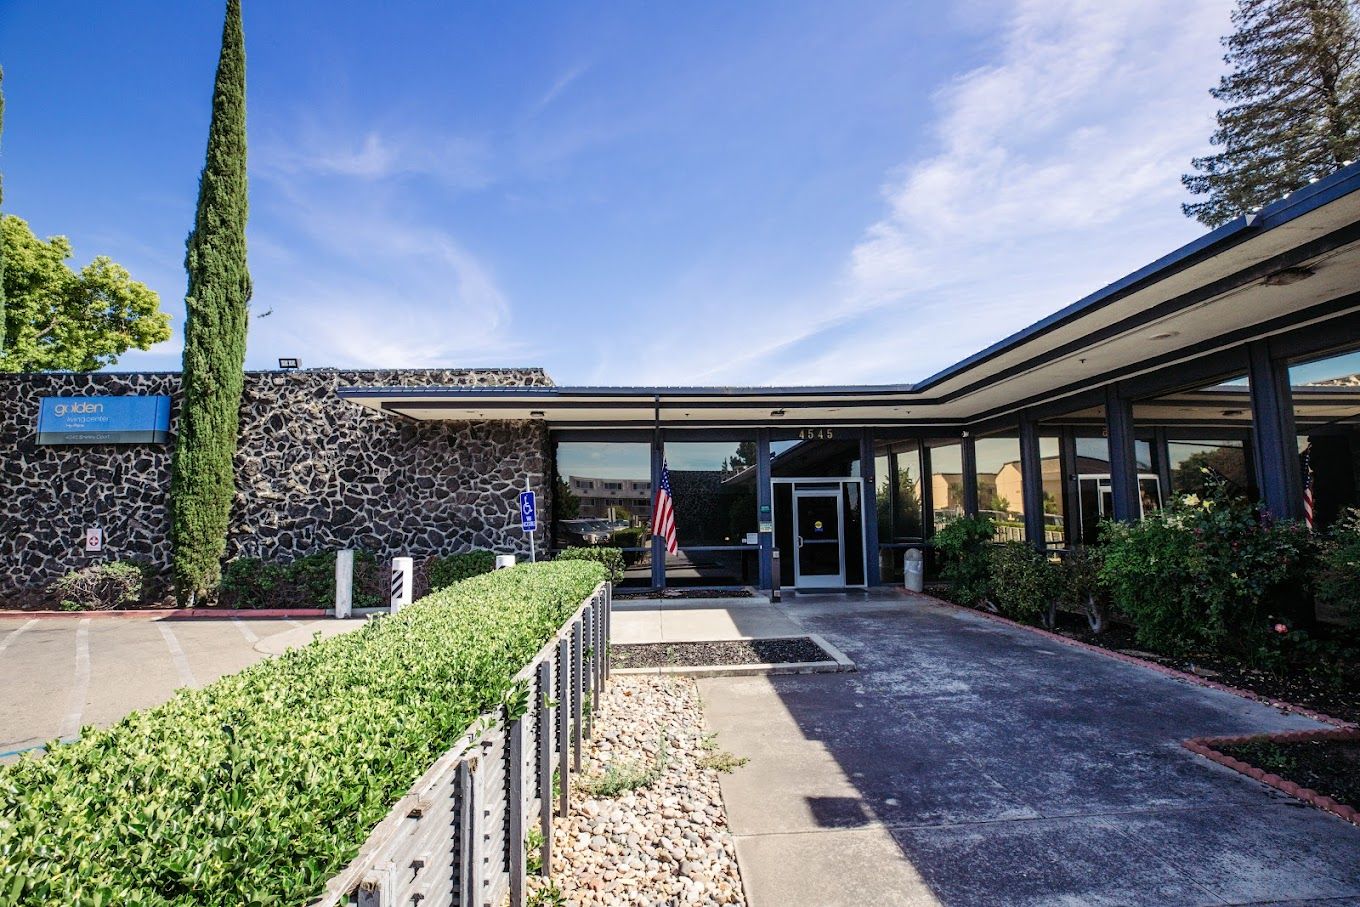
Located at 1801 N. California St. in Stockton, California, Stockton Nursing Center is dedicated to providing exceptional skilled nursing, short-term rehabilitation, and long-term care services in a compassionate and comfortable environment. With a mission to treat every patient with the utmost care and respect, the center’s team of professionals crafts tailored solutions to ensure each individual receives the best possible service. Recognizing the importance of a healing environment, Stockton Nursing Center surrounds its residents with soothing views and a family-like atmosphere.
The center’s comprehensive treatment plan includes 24-hour skilled nursing care, specialized rehabilitation therapies, and a collaborative approach to create personalized, nurturing care plans that address the unique needs of each guest. Stockton Nursing Center’s skilled team of licensed nurses, therapists, social workers, and activities coordinators work together to facilitate a swift and effective recovery, with a focus on promoting overall well-being and independence. By providing a relaxed and comfortable setting, the center aims to support its residents’ complete healing and help them continue enjoying the lives they love.
| Staff type | Hours / Day / Resident | vs state avg |
|---|---|---|
|
Registered Nurse (RN)
| 25m per day | ▼ 37% State avg: 39m per day · National avg: 41m per day |
|
LPN / LVN
| 59m per day | ▼ 19% State avg: 1h 13m per day · National avg: 52m per day |
|
Nurse Aide
| 2h 48m per day | ▲ 6% State avg: 2h 39m per day · National avg: 2h 21m per day |
|
Weekend Total Nursing
| 3h 46m per day | ▼ 8% State avg: 4h 5m per day · National avg: 3h 26m per day |
|
Physical Therapist
| 3m per day | ▼ 39% State avg: 5m per day · National avg: 4m per day |
|
Weekend RN
| 20m per day | ▼ 33% State avg: 30m per day · National avg: 29m per day |
Key information about the people who lead and staff this community.
In California, the Department of Social Services (for assisted living facilities) and the Department of Public Health (for nursing homes) conduct inspections to ensure resident safety and regulatory compliance.
California average 12.5
Last Health inspection on Aug 2025
California average 50.2
California average 4.65
Health citations are formal notices following inspections when they fail to comply with safety and care standards.
54 of 110 citations resulted from standard inspections; 55 of 110 resulted from complaint investigations; and 1 of 110 came from combined inspections (standard and complaint).
California average: 0.4
California average: 1
Reporting period: October 1 – December 31, 2025 (Q4 2025). Source: CMS Payroll-Based Journal report.
Manages medical care and health needs.
Assists with medical care and medications.
Helps with daily care and mobility.
Total hours from contractors
2,317 contractor hours this quarter
| Certified Nursing Assistant | 77 | 0 | 77 | 26,382 | 92 | 100% | 7.8 |
| Licensed Practical Nurse | 25 | 0 | 25 | 8,489 | 92 | 100% | 8 |
| Registered Nurse | 12 | 0 | 12 | 3,505 | 92 | 100% | 8.1 |
| Other Dietary Services Staff | 9 | 0 | 9 | 2,883 | 92 | 100% | 7.5 |
| Nurse Aide in Training | 18 | 0 | 18 | 2,708 | 92 | 100% | 7.1 |
| RN Director of Nursing | 3 | 0 | 3 | 1,717 | 73 | 79% | 9.6 |
| Speech Language Pathologist | 0 | 4 | 4 | 695 | 65 | 71% | 6 |
| Physical Therapy Assistant | 0 | 3 | 3 | 536 | 65 | 71% | 5.2 |
| Respiratory Therapy Technician | 0 | 3 | 3 | 528 | 67 | 73% | 6.7 |
| Dental Services Staff | 2 | 0 | 2 | 509 | 58 | 63% | 8.6 |
| Administrator | 1 | 0 | 1 | 504 | 63 | 68% | 8 |
| Nurse Practitioner | 2 | 0 | 2 | 491 | 61 | 66% | 8.1 |
| Physical Therapy Aide | 0 | 4 | 4 | 298 | 57 | 62% | 4.1 |
| Clinical Nurse Specialist | 1 | 0 | 1 | 258 | 63 | 68% | 4.1 |
| Qualified Social Worker | 0 | 1 | 1 | 119 | 42 | 46% | 2.8 |
| Occupational Therapy Aide | 1 | 1 | 2 | 91 | 12 | 13% | 7.5 |
| Occupational Therapy Assistant | 0 | 2 | 2 | 43 | 6 | 7% | 7.2 |
| Medical Director | 0 | 1 | 1 | 39 | 18 | 20% | 2.2 |
Includes penalties issued in 2023-2024
Federal penalties imposed by CMS for regulatory violations, including civil money penalties (fines) and denials of payment for new Medicare/Medicaid admissions.
Source: CMS Penalties Database (Data as of Jan 2026)
California average: $55K
California average: 2.4
California average: 0.5
Penalties are imposed by CMS for violations of federal nursing home regulations.
4 penalties in the past 3 years
Multiple penalties were reported in the last 3 years.
Last updated: Jan 2026
These measures show how residents usually do over time at this home, based on health outcomes and preventive care.
California average: 6.6
California average: 11.3
California average: 11.1%
California average: 12.0%
California average: 11.3%
California average: 1.7%
California average: 5.0%
California average: 1.2%
California average: 4.2%
California average: 6.7%
California average: 10.1%
California average: 98.5%
California average: 98.2%
California average: 2.25
California average: 1.59
California average: 94.0%
California average: 1.5%
California average: 93.2%
California average: 23.2%
California average: 11.2%
California average: 0.8%
California average: 53.7%
California average: 50.6%
Quality measures are calculated from Minimum Data Set (MDS) assessments. For most measures, lower percentages indicate better care quality.
18% of new residents, usually for short-term rehab.
46% of new residents, often for short stays.
36% of new residents, often for long-term daily care.
Source: CMS Long-Term Care Facility Characteristics (Data as of Jan 2026)
Residents meet regularly to discuss policies, care quality, and activities
Organized group of residents that meets regularly to discuss facility policies, quality of life, and activities.
Data sourced from CMS Long-Term Care Facility Characteristics quarterly report. Payer mix reflects the current resident census by primary payment source.
Historical financial and operational data for Stockton Nursing Center from 2011–2023, based on CMS SNF Cost Reports.
Key figures below are for fiscal year ending in 12/2023.
Based on CMS SNF Cost Report for fiscal year ending in 12/2023.
Most residents stay for extended periods and receive ongoing daily care.
New residents most often arrive under private pay (46% of admissions), and a typical private pay stay runs around 1 months.
Coverage residents most often arrive under.
Coverage residents most often leave under.
![]() 2.7 miles from city center
2.7 miles from city center
![]() Estimated distance in miles from Stockton's city center to Stockton Nursing Center's address, calculated via Google Maps.
Estimated distance in miles from Stockton's city center to Stockton Nursing Center's address, calculated via Google Maps.
Add your location
The information below is reported by the California Department of Social Services and Department of Public Health.
| O‘Connor Woods | NH AL IL MC RC SNF | Stockton (Sherwood Manor) | 499
Facility
499
CA AVG
104
Rank
#23 / 1648 | - | - | 4.69
Facility
4.69
CA AVG
4.22
Rank
#65 / 327 | +42% | +11% | $0
Facility
$0
CA AVG
$56.5k
Rank
#1 / 334 | 94
Facility
94
CA AVG
81
Rank
#185 / 1399 | 44
Facility
44
CA AVG
50.2
Rank
#178 / 327 | 4.0
Facility
4.0
CA AVG
4.6
Rank
#153 / 327 | - | 95 | - |
22
Facility
22
CA AVG
57
Rank
#1821 / 2087 | O'connor Woods Housing Corp | $34.5MFiscal year ending 12/2023
Facility
$34.5MFiscal year ending 12/2023
CA AVG
$17.0M
Rank
#25 / 327 | $15.8MFiscal year ending 12/2023
Facility
$15.8MFiscal year ending 12/2023
CA AVG
$7.0M
Rank
#18 / 327 | 45.7%Fiscal year ending 12/2023
Facility
45.7%Fiscal year ending 12/2023
CA AVG
45.2%
Rank
#228 / 327 | 555713 | ||||
| Creekside Center | NH HOS MC RC SNF | Stockton (Stonewood) | 75
Facility
75
CA AVG
104
Rank
#952 / 1648 |
96.5%
Facility
96.5%
CA AVG
73.8
Rank
#179 / 1496 | +31% | 3.99
Facility
3.99
CA AVG
4.22
Rank
#175 / 327 | -55% | -5% | $0
Facility
$0
CA AVG
$56.5k
Rank
#1 / 334 | - | 41
Facility
41
CA AVG
50.2
Rank
#161 / 327 | 2.4
Facility
2.4
CA AVG
4.6
Rank
#22 / 327 | - | 72 | - |
65
Facility
65
CA AVG
57
Rank
#887 / 2087 | - | $12.5MFiscal year ending 12/2023
Facility
$12.5MFiscal year ending 12/2023
CA AVG
$17.0M
Rank
#215 / 327 | $5.4MFiscal year ending 12/2023
Facility
$5.4MFiscal year ending 12/2023
CA AVG
$7.0M
Rank
#242 / 327 | 43%Fiscal year ending 12/2023
Facility
43%Fiscal year ending 12/2023
CA AVG
45.2%
Rank
#220 / 327 | 555387 | ||||
| Riverwood Healthcare Center | NH HOS MC RC SNF | Stockton (Valley Oak) | 99
Facility
99
CA AVG
104
Rank
#726 / 1648 |
91.3%
Facility
91.3%
CA AVG
73.8
Rank
#316 / 1496 | +24% | 4.23
Facility
4.23
CA AVG
4.22
Rank
#131 / 327 | -10% | 0% | $52.9k
Facility
$52.9k
CA AVG
$56.5k
Rank
#289 / 334 | - | 31
Facility
31
CA AVG
50.2
Rank
#109 / 327 | 3.9
Facility
3.9
CA AVG
4.6
Rank
#145 / 327 | 1 | 90 | - |
63
Facility
63
CA AVG
57
Rank
#949 / 2087 | Martin Gittleman | $15.4MFiscal year ending 12/2023
Facility
$15.4MFiscal year ending 12/2023
CA AVG
$17.0M
Rank
#186 / 327 | $7.6MFiscal year ending 12/2023
Facility
$7.6MFiscal year ending 12/2023
CA AVG
$7.0M
Rank
#141 / 327 | 49.2%Fiscal year ending 12/2023
Facility
49.2%Fiscal year ending 12/2023
CA AVG
45.2%
Rank
#84 / 327 | 555496 | ||||
| Lincoln Square Post-Acute Care | NH HOS RC SNF | Stockton (Civic Center) | 68
Facility
68
CA AVG
104
Rank
#1013 / 1648 |
85.9%
Facility
85.9%
CA AVG
73.8
Rank
#436 / 1496 | +16% | 3.66
Facility
3.66
CA AVG
4.22
Rank
#230 / 327 | +9% | -13% | $0
Facility
$0
CA AVG
$56.5k
Rank
#1 / 334 | - | 55
Facility
55
CA AVG
50.2
Rank
#228 / 327 | 6.9
Facility
6.9
CA AVG
4.6
Rank
#299 / 327 | - | 58 | - |
80
Facility
80
CA AVG
57
Rank
#416 / 2087 | Taylor Ellis-Sherinian | $12.3MFiscal year ending 12/2023
Facility
$12.3MFiscal year ending 12/2023
CA AVG
$17.0M
Rank
#177 / 327 | $6.5MFiscal year ending 12/2023
Facility
$6.5MFiscal year ending 12/2023
CA AVG
$7.0M
Rank
#235 / 327 | 52.9%Fiscal year ending 12/2023
Facility
52.9%Fiscal year ending 12/2023
CA AVG
45.2%
Rank
#256 / 327 | 555186 | ||||
| Stockton Nursing Center | NH | Stockton (Pacific) | 119
Facility
119
CA AVG
104
Rank
#597 / 1648 |
88.2%
Facility
88.2%
CA AVG
73.8
Rank
#389 / 1496 | +19% | 4.57
Facility
4.57
CA AVG
4.22
Rank
#76 / 327 | -20% | +8% | $83.7k
Facility
$83.7k
CA AVG
$56.5k
Rank
#309 / 334 | - | 110
Facility
110
CA AVG
50.2
Rank
#315 / 327 | 2.5
Facility
2.5
CA AVG
4.6
Rank
#30 / 327 | 2 | 105 | - |
71
Facility
71
CA AVG
57
Rank
#701 / 2087 | Stockton Nursing And Rehab Center, LLC | $13.6MFiscal year ending 12/2023
Facility
$13.6MFiscal year ending 12/2023
CA AVG
$17.0M
Rank
#221 / 327 | $8.2MFiscal year ending 12/2023
Facility
$8.2MFiscal year ending 12/2023
CA AVG
$7.0M
Rank
#160 / 327 | 60.5%Fiscal year ending 12/2023
Facility
60.5%Fiscal year ending 12/2023
CA AVG
45.2%
Rank
#46 / 327 | 55201 |
Stockton Nursing Center is located in Stockton, California.
Here are the financial assistance programs available to residents in California.
Stockton Nursing Center is in the Pacific neighborhood of Stockton.
Stockton Nursing Center has a walk score of 71. Very walkable. Most errands can be accomplished on foot, and many essentials are within a short walk.
Stockton Nursing Center's occupancy is 91.4%.
No, Stockton Nursing Center has a no-pet policy.
Stockton Nursing Center is registered as a for-profit in CA.
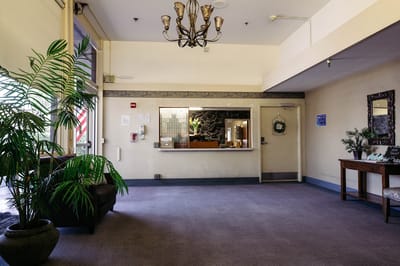
Yes — there are 2 photos of Stockton Nursing Center in the photo gallery on this page.
Stockton Nursing Center is located at 4545 Shelley Ct, Stockton, CA 95207.
Care Cost Calculator: See Prices in Your Area
Nursing Home Data Explorer
Don’t Wait Too Long: 7 Red Flag Signs Your Parent Needs Assisted Living Now
The True Cost of Assisted Living in 2025 – And How Families Are Paying For It
Understanding Senior Living Costs: Pricing Models, Discounts & Financial Assistance


