Stonegate Health Campus
Nursing Home, Assisted Living & Memory Care · Lapeer, MI
CMS overall rating Info The Overall CMS Rating is scored from 1 to 5 stars and combines results from health inspections, staffing levels, and quality measures. Health inspections carry the most weight. Staffing and quality scores can increase or decrease the final rating based on performance compared to state and national standards.

Stonegate Health Campus

Nursing Home, Assisted Living & Memory Care · Lapeer, MI
CMS overall rating Info The Overall CMS Rating is scored from 1 to 5 stars and combines results from health inspections, staffing levels, and quality measures. Health inspections carry the most weight. Staffing and quality scores can increase or decrease the final rating based on performance compared to state and national standards.
Calculator: See prices in your area
Stonegate Health Campus accepts Medicare, Medicaid, and private pay.

Overview of Stonegate Health Campus

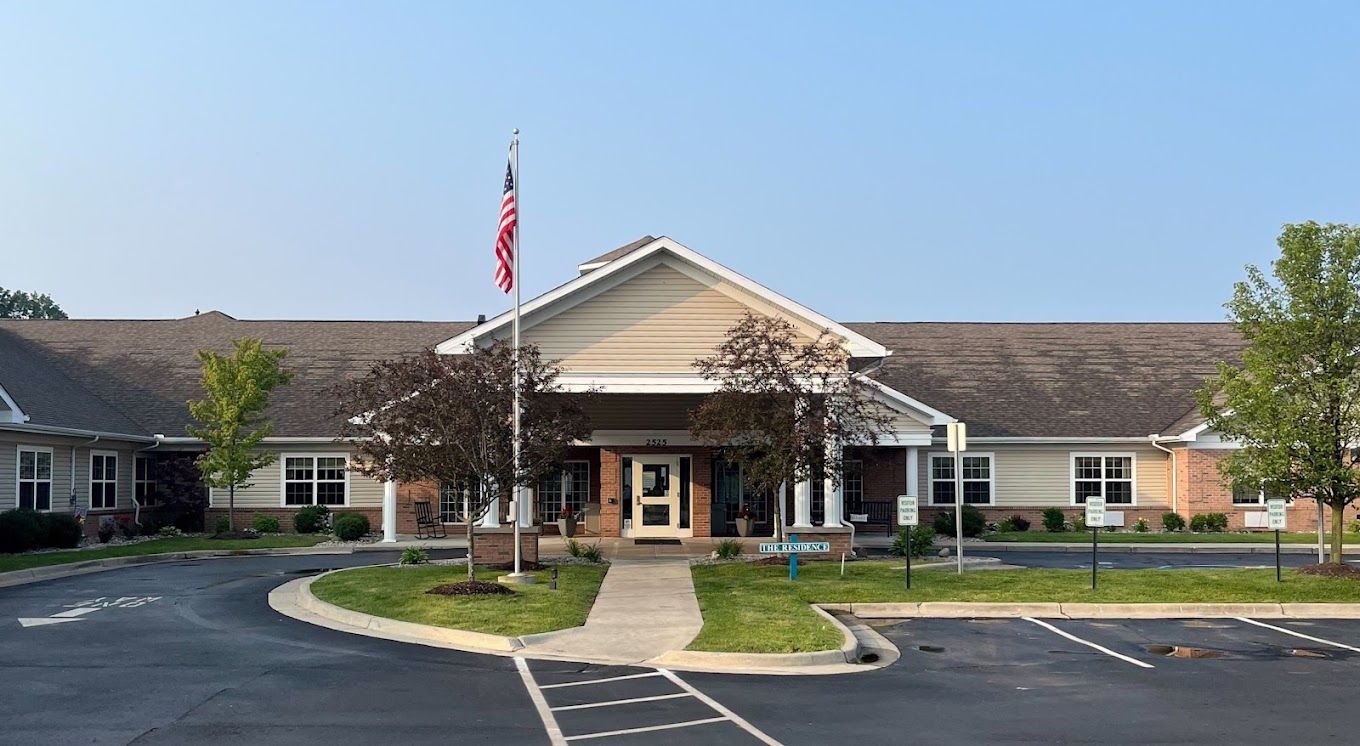
Conveniently set in proximity of trusted healthcare providers and local amenities in Lapeer, MI, Stonegate Health Campus is committed to meeting seniors’ needs and aspirations with assisted living, memory care, and skilled care services. Focusing on seniors’ comfort and safety, the community provides the highest quality of care and assistance around the clock. With specialized memory care programs, individuals can rest assured of receiving the right support to enhance their cognition.

The community fosters a bright and friendly environment, accompanying residents to keep them happy and well-connected. Enriching activities and wellness activities are also conducted to maintain residents’ active lifestyles. Stonegate Health Campus is a good place for a peaceful retirement with its campus overlooking breathtaking scenery and surrounded by serene walking paths.

(810) 245-9300

Quality ratings

Measured by Centers for Medicare & Medicaid Services (CMS)

Overall rating Info The Overall CMS Rating combines results from health inspections, staffing levels and quality measures. Health inspections carry the most weight. Staffing and quality scores can increase or decrease the final rating based on performance compared to state and national standards.
▼ 15.5% Below MI avg. ▼ 15.5% Below MI avg.Click the badge to see the full State ranking.Click here to see the full State ranking.
Health Inspection Info Based on the results of the facility's three most recent standard inspections and any complaint investigations. CMS reviews the number, scope, and severity of deficiencies, with more recent findings weighted more heavily.
▼ 9.9% Below MI avg. ▼ 9.9% Below MI avg.Click the badge to see the full State ranking.Click here to see the full State ranking.
Staffing Info Measures average nursing staff hours per resident per day, including Registered Nurses (RNs) and total nursing staff. Ratings are adjusted based on the level of care residents require and are compared to state and national benchmarks.
▲ 19.0% Above MI avg. ▲ 19.0% Above MI avg.Click the badge to see the full State ranking.Click here to see the full State ranking.
Quality Measures Info Based on clinical and physical health indicators reported to CMS, such as hospital readmissions, falls, pressure ulcers, and improvements in mobility. These measures reflect how well residents' health needs are being managed.
▲ 5.0% Above MI avg. ▲ 5.0% Above MI avg.Click the badge to see the full State ranking.Click here to see the full State ranking.

Staffing hours breakdown

Info Daily nursing hours per resident by staff type, reported to CMS. Higher is generally better — compare this facility to state and national averages to see where staffing stands.

Hours per resident per day — compared to Michigan state averages

Total nursing care / resident Info This home is ranked 67th out of 133 homes in Michigan. Total adjusted nursing hours per resident per day, combining RN, LPN, and aide time. CMS adjusts this for case-mix so facilities can be fairly compared.
3h 59m per day
Rank #67 / 133Nurse hours — State benchmarkedThis home is ranked 67th out of 133 homes in Michigan. Shows adjusted nurse hours per resident per day benchmarked to the Michigan average, with a ranking across 133 Michigan SNFs. More hours mean more direct care. The national average is about 3.5 hrs; below 3.0 is a red flag.Click the rank badge to see the full State ranking.Click here to see the full State ranking.
This facility Michigan avg (4h 15m per day)
vs Michigan avg
-6%

3 of 6 metrics below state avg

Standout metric Nurse Aide is +17% above state avg
Staff typeHours / Day / Residentvs state avg
Registered Nurse (RN) Info RNs hold the highest nursing license and can assess residents, interpret test results, and direct care plans. More RN hours per day often signals stronger clinical oversight and faster response to health changes. 44m per day ▼ 4% State avg: 46m per day · National avg: 41m per day
LPN / LVN Info Licensed Practical Nurses (LPNs) or Licensed Vocational Nurses (LVNs) deliver routine hands-on care — medication administration, wound dressing, and monitoring vital signs. They work under RN supervision and make up a large share of daily bedside care. 57m per day ▲ 8% State avg: 53m per day · National avg: 52m per day
Nurse Aide Info Certified Nurse Aides (CNAs) provide the most direct day-to-day assistance: bathing, dressing, feeding, and mobility. Nurse aide hours are typically the largest staffing category and directly affect residents' quality of life. 2h 48m per day ▲ 17% State avg: 2h 23m per day · National avg: 2h 21m per day
Weekend Total Nursing Info Combined nursing hours (RN + LPN + Nurse Aide) per resident per day on weekends. Staffing often drops on weekends — this figure reveals whether the facility maintains adequate coverage outside of weekday hours. 3h 38m per day ▲ 3% State avg: 3h 31m per day · National avg: 3h 26m per day
Physical Therapist Info Hours per resident per day provided by licensed Physical Therapists (PTs) or PT Assistants. PT services help residents recover mobility after injury or illness and are especially important for post-acute (short-stay) rehabilitation. 3m per day ▼ 25% State avg: 4m per day · National avg: 4m per day
Weekend RN Info Registered nurse hours specifically on weekends. Facilities sometimes reduce RN presence on Saturdays and Sundays — a low weekend RN figure compared to weekday hours can indicate reduced clinical oversight when most administrative staff are absent. 27m per day ▼ 7% State avg: 29m per day · National avg: 29m per day

Types of Care at Stonegate Health Campus

Assisted Living Memory Care

Capacity and availability

Avg. Length of Stay
41 days
Bed community size
39-bed community Rank #300 / 437Bed count — State benchmarkedThis home is ranked 300th out of 437 homes in Michigan. Shows this facility's certified or reported bed count compared to other Michigan SNFs. Larger communities may offer more amenities, programs, and on-site services for residents and families.Click the rank badge to see the full State ranking.Click here to see the full State ranking.
A moderately sized community that may balance personal attention with shared amenities and social activities.
Years in operation
1 year in operation Rank #149 / 302Years in operation — State benchmarkedThis home is ranked 149th out of 302 homes in Michigan. Shows how long this facility has been in operation compared to other Michigan SNFs. Longer operating histories may benefit residents, families, and staff.Click the rank badge to see the full State ranking.Click here to see the full State ranking.
A newer community that may feature more recent facilities and programs.
Walk Score
Walk Score: 33 / 100 Rank #404 / 702Walk Score — State benchmarkedThis home is ranked 404th out of 702 homes in Michigan. Shows how walkable this facility's neighborhood is compared to the average Walk Score across Michigan SNFs. Higher scores benefit residents, families, and staff.Click the rank badge to see the full State ranking.Click here to see the full State ranking.
Somewhat walkable. A few nearby services may be reachable on foot, but most trips require transportation.

About this community

Occupancy

Occupancy rate
100%
Rank #1 / 386Occupancy rate — State benchmarkedThis home is ranked 1st out of 386 homes in Michigan. Shows this facility's occupancy rate versus the Michigan average, with its Statewide rank out of 386. Higher occupancy signals strong local demand and financial stability.Click the rank badge to see the full State ranking.Click here to see the full State ranking.
Higher than the Michigan average: 75.8%
Occupied beds
39 / 39
Average residents per home in Michigan 84 per day

License Details

Facility TypeHomes For The Aged
StatusRegular
IssuanceJanuary 8, 2025
ExpirationJuly 31, 2026
CountyLapeer
License NumberAH440311638
CMS Certification Number235661

Population served

Aged; Alzheimers

Ownership & Operating Entity

Stonegate Health Campus is legally operated by Trilogy Healthcare of Lapeer, LLC.

Contact Stonegate Health Campus

Inspection History

In Michigan, the Department of Licensing and Regulatory Affairs (LARA) conducts unannounced inspections and investigations to ensure long-term care facilities comply with state health codes.

Since 2012 · 14 years of data 50 deficiencies 3 inspections

Inspection Scorecard Info This scorecard compares key inspection, citation, and complaint metrics at this facility against the Michigan state average. Metrics rated ≥15% worse than average are highlighted in red; those ≥15% better are highlighted in green.

Since 2012 vs. Michigan state average
Overall vs. MI average 3 Worse Metrics worse than Michigan average:
• Total deficiencies (525% above)
• Deficiencies per year (500% above)
• Deficiencies per inspection (944% above)
1 Better Metrics better than Michigan average:
• Total inspections (40% below)
Latest Inspection January 16, 2025 Complaint Investigation

Deficiencies Info Deficiencies are formal regulatory issues recorded during state inspections.

This FacilityMI Averagevs. MI Avg
Total deficiencies Info Formal regulatory issues recorded by inspectors across all inspection types. 508 This facility has 525% more total deficiencies than a typical Michigan nursing home (50 vs. MI avg 8).↑ 525% worse
Deficiencies per year Info Average deficiencies per year since 2012. 3.60.6 This facility has 500% more deficiencies per year than a typical Michigan nursing home (3.6 vs. MI avg 0.6).↑ 500% worse
Deficiencies per inspection Info Average deficiencies per inspection. 16.71.6 This facility has 944% more deficiencies per inspection than a typical Michigan nursing home (16.7 vs. MI avg 1.6).↑ 944% worse

Inspections Info State inspections evaluate whether the facility meets health and safety standards.

This FacilityMI Averagevs. MI Avg
Total inspections Info Combined count of all routine and focused inspections. Excludes complaint investigations. 35 This facility has 40% fewer total inspections than a typical Michigan nursing home (3 vs. MI avg 5).↓ 40% better

Inspection Reports Summary Info An editor-reviewed summary of the themes and findings across this facility's recent inspection reports.

The most recent inspection on January 16, 2025, identified deficiencies related to misappropriation of resident property and issues with respiratory care, medication storage, food preferences, and infection control. Earlier inspections showed a pattern of deficiencies involving resident care planning, assistance with daily living activities, pressure ulcer management, staffing levels, abuse investigations, and medication management. Complaint investigations substantiated concerns about residents’ rights, dignity, and safety, including missing resident funds and inadequate staff training on safeguarding valuables. Enforcement actions such as fines or license suspensions were not listed in the available reports. The facility’s inspection history indicates ongoing challenges with care and safety practices, with no clear trend of sustained improvement.

Read the full inspection reports for this facility, including detailed findings and corrective actions.

Show Inspection Reports

Health Inspection History

Inspections since 2022
Total health inspections 5

Michigan average 6.5


Last Health inspection on Jan 2025

Total health citations
47 Rank #103 / 135Health citations — State benchmarkedThis home is ranked 103rd out of 135 homes in Michigan. Shows this facility's total health deficiency citations benchmarked to the Michigan State average, with a ranking across all 135 MI SNFs. Lower citation counts earn a better rank.Click the rank badge to see the full State ranking.Click here to see the full State ranking.

Michigan average 33.5

Citations per inspection
9.4 Rank #128 / 135Citations per inspection — State benchmarkedThis home is ranked 128th out of 135 homes in Michigan. Shows average deficiency citations per CMS inspection for this facility versus the Michigan mean across 135 SNFs with citation data. Lower is better.Click the rank badge to see the full State ranking.Click here to see the full State ranking.

Michigan average 5.18


Health citations are formal notices following inspections when they fail to comply with safety and care standards.

33 of 47 citations resulted from standard inspections; 8 of 47 resulted from complaint investigations; and 6 of 47 came from combined inspections (standard and complaint).

Breakdown of citation severity (last 4 years)
Critical Health citations
0
100% better than Michigan average

Michigan average: 0.3


Serious Health citations
3 Rank #52 / 92Serious citations (G–I) — State benchmarkedThis home is ranked 52nd out of 92 homes in Michigan. Shows G–I scope serious health citations for this facility versus other Michigan SNFs. Lower counts rank better.Click the rank badge to see the full State ranking.Click here to see the full State ranking.
58% worse than Michigan average

Michigan average: 1.9

0 critical citations Michigan average: 0.3

3 serious citations Michigan average: 1.9

43 moderate citations Michigan average: 30.8

1 minor citation Michigan average: 0.5
Citations history (last 4 years)
Abuse/Neglect moderate citation Jan 16, 2025
Corrected

Infection Control moderate citation Jan 16, 2025
Corrected

Nutrition moderate citation Jan 16, 2025
Corrected

Pharmacy moderate citation Jan 16, 2025
Corrected

Staffing Data

Reporting period: October 1 – December 31, 2025 (Q4 2025). Source: CMS Payroll-Based Journal report.

Total staff 132
Employees 113
Contractors 19
Staff to resident ratio 2.00:1
18% better than Michigan average
Michigan average ratio: 1.70:1 Michigan average ratio: 1.70:1See full Michigan ranking
Avg staff/day 52
Average shift 8.1 hours
0% compared with Michigan average
Michigan average: 7.9 hours Michigan average shift: 7.9 hoursSee full Michigan ranking
Total staff hours (quarter) 38,683

Nursing staff breakdown

Q4 2025 · Oct 1 – Dec 31 More info This data comes from the CMS Payroll-Based Journal report covering October 1 – December 31, 2025.
Registered Nurse

Manages medical care and health needs.

RN Staff 12
Average shift length Info Average shift length. Calculated as total hours divided by days worked and average staff per day. 8.5 hours

No contractors work on this role.

Licensed Practical Nurse

Assists with medical care and medications.

LPN Staff 17
Average shift length Info Average shift length. Calculated as total hours divided by days worked and average staff per day. 9.2 hours

No contractors work on this role.

Certified Nursing Assistant

Helps with daily care and mobility.

CNA Staff 55
Average shift length Info Average shift length. Calculated as total hours divided by days worked and average staff per day. 8.2 hours

No contractors work on this role.

Contractor staffing

Q4 2025 · Oct 1 – Dec 31 More info This data comes from the CMS Payroll-Based Journal report covering October 1 – December 31, 2025.

Total hours from contractors

9.3%

3,595 contractor hours this quarter

Physical Therapy Aide: 5 Speech Language Pathologist: 4 Qualified Social Worker: 4 Physical Therapy Assistant: 3 Respiratory Therapy Technician: 3

Staff by category

Q4 2025 · Oct 1 – Dec 31 More info This data comes from the CMS Payroll-Based Journal report covering October 1 – December 31, 2025.
Certified Nursing Assistant5505517,59392100%8.2
Licensed Practical Nurse170175,83592100%9.2
Other Dietary Services Staff8082,87792100%7.6
Registered Nurse120122,4819199%8.5
Clinical Nurse Specialist9091,7757683%8
Medication Aide/Technician3031,4517885%9.2
Mental Health Service Worker2021,0257076%8.1
Physical Therapy Aide0559606975%7.3
Speech Language Pathologist0449107986%7.2
Physical Therapy Assistant0338157480%6.9
Dietitian1015216975%7.6
Respiratory Therapy Technician0335185863%8.9
RN Director of Nursing2025174650%10.8
Nurse Practitioner1015156571%7.9
Administrator1014485661%8
Qualified Social Worker0443916065%6.3
Occupational Therapy Assistant202505863%0.9
55 Certified Nursing Assistant
% of Days 100%
17 Licensed Practical Nurse
% of Days 100%
8 Other Dietary Services Staff
% of Days 100%
12 Registered Nurse
% of Days 99%
9 Clinical Nurse Specialist
% of Days 83%
3 Medication Aide/Technician
% of Days 85%
2 Mental Health Service Worker
% of Days 76%
5 Physical Therapy Aide
% of Days 75%
4 Speech Language Pathologist
% of Days 86%
3 Physical Therapy Assistant
% of Days 80%
1 Dietitian
% of Days 75%
3 Respiratory Therapy Technician
% of Days 63%
2 RN Director of Nursing
% of Days 50%
1 Nurse Practitioner
% of Days 71%
1 Administrator
% of Days 61%
4 Qualified Social Worker
% of Days 65%
2 Occupational Therapy Assistant
% of Days 63%

Penalties and fines

Includes penalties issued in 2024

Federal penalties imposed by CMS for regulatory violations, including civil money penalties (fines) and denials of payment for new Medicare/Medicaid admissions.

Source: CMS Penalties Database (Data as of Jan 2026)

Total fines amount $66K Rank #106 / 136Federal fines — State benchmarkedThis home is ranked 106th out of 136 homes in Michigan. Shows this facility's cumulative CMS federal fine dollars versus the Michigan average among facilities with fines, and where it ranks among 136 skilled nursing facilities in the pool. Lower total dollars mean a better rank.Click the rank badge to see the full State ranking.Click here to see the full State ranking.
13% lower than Michigan average

Michigan average: $76K

Number of fines 1
51% fewer fines than Michigan average

Michigan average: 2.0

Payment Denials Info Serious action where Medicare and/or Medicaid temporarily stops payments for new residents until issues are fixed. 1
19% more payment denials than Michigan average

Michigan average: 0.8

Fines amount comparison
This facility $66K
Michigan average $76K
Penalty History

Penalties are imposed by CMS for violations of federal nursing home regulations.

2 penalties in the past 3 years

Multiple penalties were reported in the last 3 years.

Civil Money Penalty Info Fines imposed for noncompliance, which can be assessed per day or per instance of violation. Jan 9, 2024
$66K
Payment Denial Info Serious action where Medicare and/or Medicaid temporarily stops payments for new residents until issues are fixed. Jan 9, 2024
34 days

Last updated: Jan 2026

Quality of care over time

These measures show how residents usually do over time at this home, based on health outcomes and preventive care.

High-risk clinical events score Info A composite score based on pressure ulcers, falls with injury, weight loss, walking ability decline, and activities of daily living decline. 8.4
In line with Michigan average

Michigan average: 8.4

Functional decline score Info A composite score based on activities of daily living decline, walking ability decline, and incontinence. 18.4
13% worse than Michigan average

Michigan average: 16.3

Long-stay resident measures
Significantly above average Michigan avg: 4.1 Info CMS star rating based on long-stay quality measure performance. 5 stars = significantly above average, 1 star = significantly below average.
Need for Help with Daily Activities Increased Info Percent of long-stay residents whose need for help with daily activities has increased 12.3%
In line with Michigan average

Michigan average: 12.5%

Walking Ability Worsened Info Percent of long-stay residents whose ability to move independently worsened 15.5%
In line with Michigan average

Michigan average: 15.3%

Low Risk Residents with Bowel/Bladder Incontinence Info Percent of low risk long-stay residents who lose control of their bowels or bladder 27.4%
30% worse than Michigan average

Michigan average: 21.0%

Falls with Major Injury Info Percent of long-stay residents experiencing one or more falls with major injury 4.4%
40% worse than Michigan average

Michigan average: 3.2%

High Risk Residents with Pressure Ulcers Info Percent of long-stay high risk residents with pressure ulcers 3.5%
39% better than Michigan average

Michigan average: 5.7%

Urinary Tract Infection Info Percent of long-stay residents with a urinary tract infection 0.6%
66% better than Michigan average

Michigan average: 1.7%

Lost Too Much Weight Info Percent of long-stay residents who lose too much weight 6.1%
7% worse than Michigan average

Michigan average: 5.7%

Depressive Symptoms Info Percent of long-stay residents who have depressive symptoms 1.9%
51% better than Michigan average

Michigan average: 3.9%

Antipsychotic Use Info Percent of long-stay residents who received an antipsychotic medication 9.3%
38% better than Michigan average

Michigan average: 15.0%

Pneumococcal Vaccine Info Percent of long-stay residents assessed and appropriately given the pneumococcal vaccine 99.5%
5% better than Michigan average

Michigan average: 94.9%

Influenza Vaccine Info Percent of long-stay residents assessed and appropriately given the seasonal influenza vaccine 100.0%
5% better than Michigan average

Michigan average: 95.0%

Hospitalizations per 1,000 days Info Number of hospitalizations per 1,000 long-stay resident days. 1.82
5% worse than Michigan average

Michigan average: 1.74

ED visits per 1,000 days Info Number of outpatient emergency department visits per 1,000 long-stay resident days. 1.06
31% better than Michigan average

Michigan average: 1.54

Short-stay resident measures
Average Michigan avg: 3.3 Info CMS star rating based on short-stay quality measure performance. 5 stars = much above average, 1 star = much below average.
Pneumococcal Vaccine Info Percent of short-stay residents assessed and appropriately given the pneumococcal vaccine 97.7%
18% better than Michigan average

Michigan average: 82.5%

Antipsychotic medication increase Info Percent of short-stay residents who newly received an antipsychotic medication 1.3%
11% better than Michigan average

Michigan average: 1.4%

Influenza Vaccine Info Percent of short-stay residents assessed and appropriately given the seasonal influenza vaccine 97.6%
23% better than Michigan average

Michigan average: 79.5%

Re-hospitalized after SNF stay Info Percentage of short-stay residents who were re-hospitalized after their nursing home admission. 30.4%
26% worse than Michigan average

Michigan average: 24.2%

Emergency department visits Info Percentage of short-stay residents who had an outpatient emergency department visit. 11.1%
In line with Michigan average

Michigan average: 11.5%

Falls with major injury Info Percentage of SNF residents who experience falls with major injury during their stay. 0.9%
14% worse than Michigan average

Michigan average: 0.8%

Ability to care for self at discharge Info Percentage of residents at or above expected ability to care for themselves at discharge. 27.8%
48% worse than Michigan average

Michigan average: 53.7%

Successful return to home or community Info Rate of successful return to home or community from a skilled nursing facility. 58.8%
16% better than Michigan average

Michigan average: 50.6%

Breakdown by payment type

Medicare

31% of new residents, usually for short-term rehab.

Typical stay 21 days

Private pay

60% of new residents, often for short stays.

Typical stay 1 - 2 months

Medicaid

10% of new residents, often for long-term daily care.

Typical stay 8 - 9 months

Facility Characteristics

Source: CMS Long-Term Care Facility Characteristics (Data as of Jan 2026)

Total residents 66
Medicare
22
33.3% of residents
Medicaid
41
62.1% of residents
Private pay or other
3
4.5% of residents
Programs & Services
Residents Group

Residents meet regularly to discuss policies, care quality, and activities

Active Resident Council

Organized group of residents that meets regularly to discuss facility policies, quality of life, and activities.

Finances and operations

Privately-owned community
Operated by a business corporation.
Home revenue
$15.7M
Profit
$1.6M
Privately-owned community Operated by a business corporation.
Home revenue
$15.7M Rank #68 / 134Revenue — State benchmarkedThis home is ranked 68th out of 134 homes in Michigan. Shows this facility's annual revenue compared to the Michigan SNF average. Higher revenue generally means more resources for staffing and capital — read alongside Payroll %.Click the rank badge to see the full State ranking.Click here to see the full State ranking.
Profit
$1.6M
Payroll costs Info The portion of the home's budget spent on staff, including nurses, caregivers, and other employees who support care and operations. Rank #51 / 134Payroll — State benchmarkedThis home is ranked 51st out of 134 homes in Michigan. Shows total annual staff payroll benchmarked to the Michigan average. Higher payroll investment relative to peers often signals better staffing and less reliance on cheaper contract labor.Click the rank badge to see the full State ranking.Click here to see the full State ranking.
$7.8M
49.6% of revenue Rank #38 / 134Payroll % — State benchmarkedThis home is ranked 38th out of 134 homes in Michigan. Shows payroll as a percentage of revenue versus the Michigan average. Well-run Michigan SNFs typically land around 49–59% — the top third Statewide. Below 25% may signal understaffing or heavy agency use — read with Staffing ratings.Click the rank badge to see the full State ranking.Click here to see the full State ranking.
Other operating costs Info All remaining costs needed to run the home, such as food, utilities, building maintenance, supplies and administrative expenses.
$6.3M
Total costs $14.1M

What does this home offer?

Building type icon
Building type icon

Building Type: Single-story

Fitness and recreation icon

Fitness and Recreation

Who this home usually serves

TYPE OF STAY

Primarily short stays

Residents typically stay for brief periods, with frequent admissions and discharges throughout the year.

Places of interest near Stonegate Health Campus

Address 2.0 miles from city center Info Estimated distance in miles from Lapeer's city center to Stonegate Health Campus's address, calculated via Google Maps.

Calculate Travel Distance to Stonegate Health Campus

Add your location

Address

Financial Assistance for
Nursing Home in Michigan

Stonegate Health Campus is located in Lapeer, Michigan.
Here are the financial assistance programs available to residents in Michigan.

Get Financial aid guidance

MI Choice Waiver

Michigan Medicaid MI Choice Waiver

Age 65+ or disabled
General Michigan resident, Medicaid- eligible, nursing home-level care need.
Income Limits (2025) ~$2,829/month 300% FBR, individual
Asset Limits $2,000 (individual), $3,000 (couple).
MI

Delivered through regional waiver agents; waitlists possible.

Benefits
Personal care (5-7 hours/day) Respite care (240 hours/year) Home modifications ($1,500 avg.) Adult day care ($65/day)

Home Help Program

Michigan Home Help

Age 65+ or disabled
General Michigan resident, Medicaid- eligible or low-income.
Income Limits ~$1,732/month individual, Medicaid threshold
Asset Limits $2,000 individual
MI

Can hire family caregivers; less intensive than waiver.

Benefits
Personal care (up to 60 hours/month) Homemaker services Respite (varies)

Program of All-Inclusive Care for the Elderly (PACE)

Michigan PACE

Age 55+
General Michigan resident, nursing home-level care need, safe with PACE support.
Income Limits (2025) ~$2,829/month (Medicaid-eligible); private pay option available.
Asset Limits $2,000 (individual), $3,000 (couple).
MI

16 PACE centers (e.g., Ingham, Wayne counties); expanding slowly.

Benefits
Personal care (5-7 hours/day) Medical care Meals Transportation Therapy Respite

Medicare Savings Program (MSP)

Michigan Medicare Savings Program

Age 65+ or disabled
General Michigan resident, Medicare Part A/B.
Income Limits (2025) ~$2,510/month (QMB), ~$3,380/month (SLMB), ~$3,598/month (QI)—individual.
Asset Limits $9,430 (individual), $14,130 (couple).
MI

Three tiers; no waitlist; includes Extra Help for Part D.

Benefits
Covers Part B premiums ($174.70/month) Deductibles ($240/year) Copays (~20%)

National Family Caregiver Support Program (NFCSP) Respite

Michigan NFCSP Respite Care

Age
General Caregivers of 60+ needing care or 55+ caregivers of others; Michigan resident; functional needs (2+ ADLs).
Income Limits (2025) Prioritizes ~$24,980/year (individual); no strict cap.
Asset Limits Not assessed; need-based.
MI

16 AAAs; prioritizes low-income, rural caregivers.

Benefits
Respite (4-6 hours/week or 5 days/year) Adult day care ($60/day) Caregiver training

VA Aid and Attendance (A&A) and Housebound Benefits

Michigan VA Aid and Attendance/Housebound

Age 65+ or disabled veteran/spouse
General Michigan resident, wartime service, need for ADL help (A&A) or homebound.
Income Limits (2025) Net income < ~$1,984/month (veteran with dependent, A&A); pension offsets income.
Asset Limits ~$155,356 net worth limit
MI

High veteran demand in urban/rural areas.

Benefits
Cash (~$1,433-$2,642/month veteran, ~$951-$1,318 spouse) for care costs

Frequently Asked Questions about Stonegate Health Campus

Who is the owner of Stonegate Health Campus?

The legal owner and operator of Stonegate Health Campus is Trilogy Healthcare of Lapeer, LLC.

Is Stonegate Health Campus in a walkable area?

Stonegate Health Campus has a walk score of 33. Somewhat walkable. A few nearby services may be reachable on foot, but most trips require transportation.

What is the license number of Stonegate Health Campus?

According to MI state health department records, Stonegate Health Campus's license number is AH440311638.

When does Stonegate Health Campus's license expire?

According to MI state health department records, Stonegate Health Campus's license expires on July 31, 2026.

What is the occupancy rate at Stonegate Health Campus?

Stonegate Health Campus's occupancy is 100%.

How many beds does Stonegate Health Campus have?

Stonegate Health Campus has 39 beds.

What is the address of Stonegate Health Campus?

Stonegate Health Campus is located at 2525 Demille Rd, Lapeer, MI 48446, United States.

Guides for Better Senior Living

Care Cost Calculator: See Prices in Your Area

Nursing Home Data Explorer

Don’t Wait Too Long: 7 Red Flag Signs Your Parent Needs Assisted Living Now

The True Cost of Assisted Living in 2025 – And How Families Are Paying For It

Understanding Senior Living Costs: Pricing Models, Discounts & Financial Assistance

Explore Open Rooms
1 Contact details
2 What type of senior care service are you looking for?
3 What budget do you have in mind for senior care?
4 How soon do you need to find care?
5 Additional details

Thank you for your interest!

Our team will be in touch shortly to help with next steps.