Explore Open Rooms
1 Contact details
2 What type of senior care service are you looking for?
3 What budget do you have in mind for senior care?
4 How soon do you need to find care?
5 Additional details

Thank you for your interest!

Our team will be in touch shortly to help with next steps.

Nursing Home in West Jordan

CMS overall rating Info The Overall CMS Rating combines results from health inspections, staffing levels and quality measures. Health inspections carry the most weight. Staffing and quality scores can increase or decrease the final rating based on performance compared to state and national standards.

Stonehenge of South Jordan

Overview of Stonehenge of South Jordan

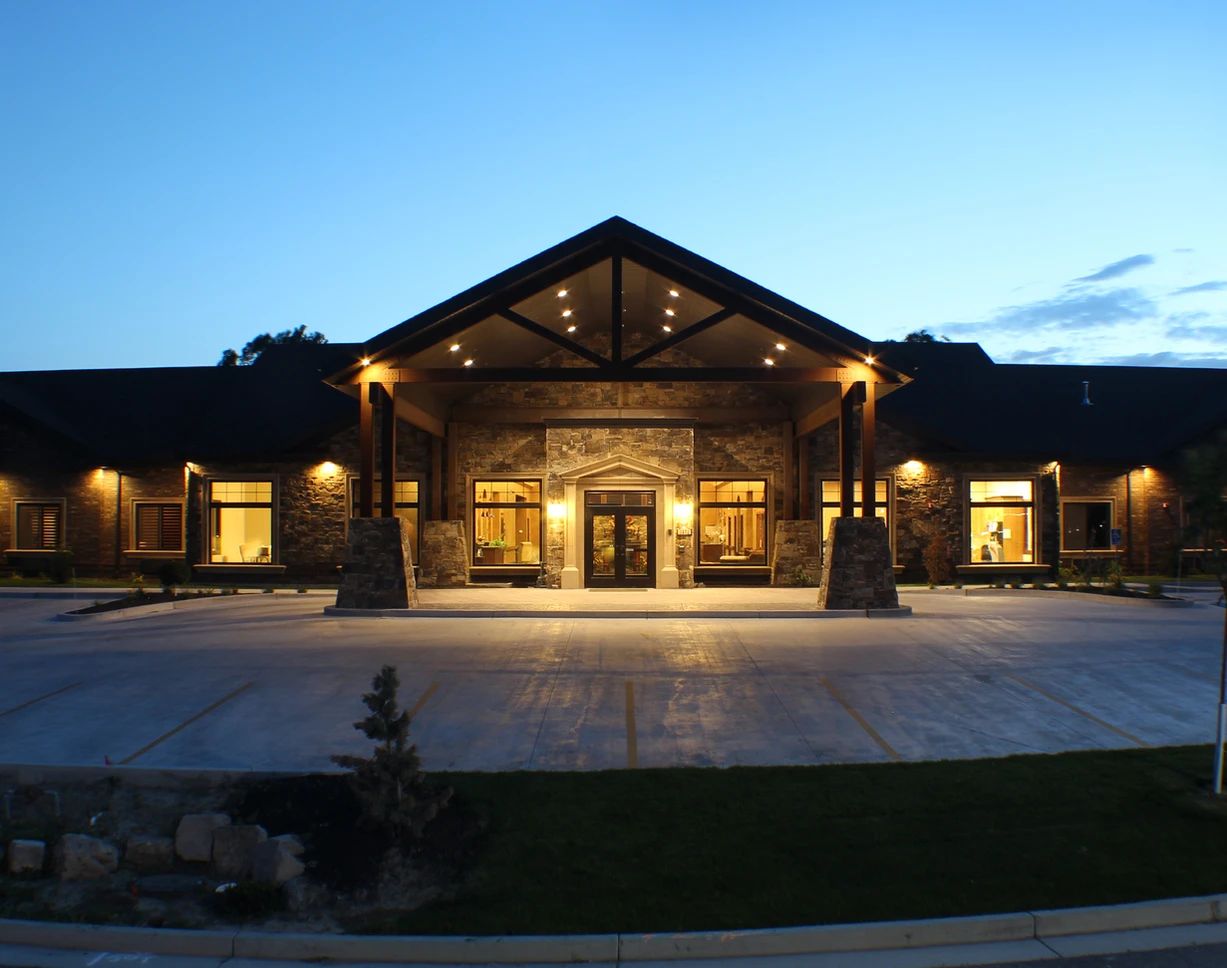
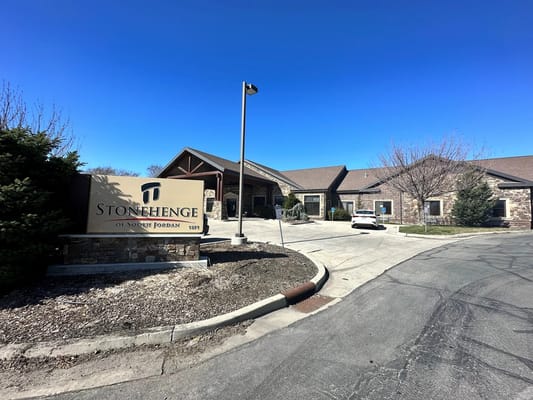
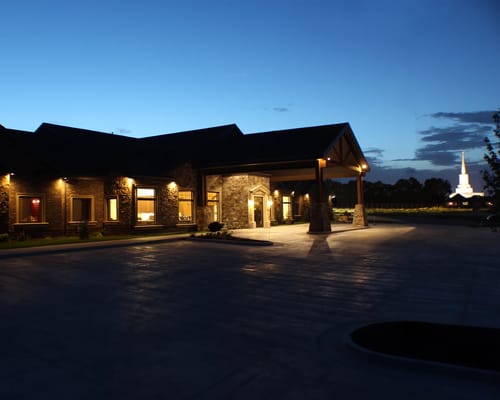
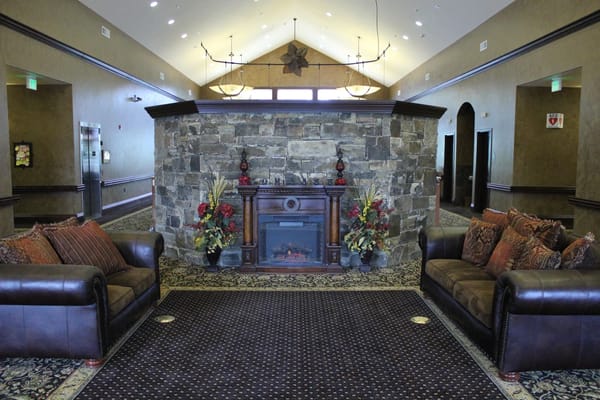
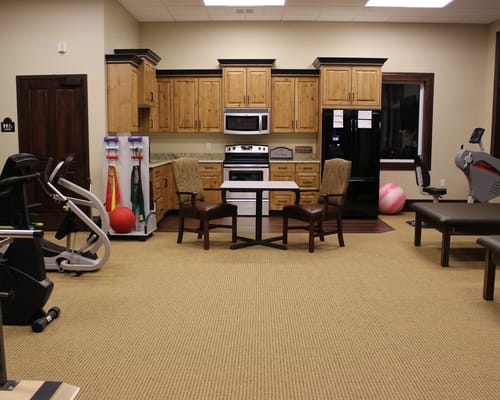
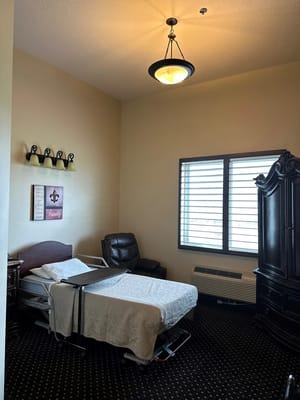
A charming community providing rehabilitation and skilled nursing care services in South Jordan, Stonehenge prides itself on being among the few warm and welcoming communities in the city; its residents feel comfortable in a home that naturally encourages them to make new relationships. The luxurious retirement home ensures that quality caregiving is the top priority on their list, adhering to a person-centered approach with a mission to modernize senior living by focusing on the convenience and comfort of senior wellness.

Stonehenge’s nursing home care services include pain management, diabetes management, restorative nursing, wound care, and a team of 24/7 nurses. Assisted living and memory care services include ADLS, medication management, stimulating activities, and enriching programs.

(801) 253-1370

Quality ratings

Measured by Centers for Medicare & Medicaid Services (CMS)

Overall rating Info The Overall CMS Rating combines results from health inspections, staffing levels and quality measures. Health inspections carry the most weight. Staffing and quality scores can increase or decrease the final rating based on performance compared to state and national standards.
5/5
Utah average: 3.4/5
Health Inspection Info Based on the results of the facility's three most recent standard inspections and any complaint investigations. CMS reviews the number, scope, and severity of deficiencies, with more recent findings weighted more heavily.
5/5
Utah average: 2.7/5
Staffing Info Measures average nursing staff hours per resident per day, including Registered Nurses (RNs) and total nursing staff. Ratings are adjusted based on the level of care residents require and are compared to state and national benchmarks.
5/5
Utah average: 3.2/5
Quality Measures Info Based on clinical and physical health indicators reported to CMS, such as hospital readmissions, falls, pressure ulcers, and improvements in mobility. These measures reflect how well residents' health needs are being managed.
4/5
Utah average: 4.4/5

Nursing care per resident

Info This shows how many total hours of nursing staff time are available per resident each day. Higher numbers usually mean more staff support.
4h 25m per day

This home provides 17% more nursing time per resident than the Utah average.

Utah average: 3h 46m per day

Staffing hours breakdown

Info Hours of care per resident per day, broken down by staff type. Data from CMS Medicare.
Staff type Facility State avg National avg
Registered Nurse (RN) Info Registered nurse hours per resident per day. 1h 47m per day 1h 11m per day 41m per day
Nurse Aide Info Nurse aide hours per resident per day. 2h 35m per day 2h 22m per day 2h 21m per day
Total Nursing (Weekend) Info Total number of nurse staff hours per resident per day on weekends. 4h 13m per day 3h 31m per day 3h 26m per day
Physical Therapist Info Physical therapist staff hours per resident per day. 15m per day 7m per day 4m per day
RN (Weekend) Info Registered nurse hours per resident per day on weekends. 1h 10m per day 50m per day 29m per day

Capacity and availability

Smaller home

May offer a more intimate, personalized care environment.

Total beds 32

This home usually has availability

Lower occupancy suggests more openings may be available.

Lower demand than the Utah average
Occupancy rate 64.7%
Residents per day (avg) 24
Occupancy rate
64.7%
Residents per day (avg)
24

Who this home usually serves

TYPE OF STAY

Mostly short-term rehab stays

Most residents typically stay for a few weeks or months before returning home or moving on.

Might be optimal for
Short stays Recovery Medicare-covered care

Breakdown by payment type

Medicare

60% of new residents, usually for short-term rehab.

Typical stay 18 days

Private pay

40% of new residents, often for short stays.

Typical stay 18 days

Finances and operations

Privately-owned community
Home revenue
$6.3M
Operating loss
-$62.4K
Privately-owned community
Home revenue
$6.3M
Operating loss
-$62.4K
Payroll costs Info The portion of the home's budget spent on staff, including nurses, caregivers, and other employees who support care and operations.
$2.2M
35% of revenue
Other operating costs Info All remaining costs needed to run the home, such as food, utilities, building maintenance, supplies and administrative expenses.
$4.2M
Total costs $6.4M
Bed community size
32-bed community
A moderately sized community that may balance personal attention with shared amenities and social activities.
Years in operation
14 years in operation
A community with a solid operating history and experience delivering ongoing care.
Walk Score
Walk Score: 51 / 100
Moderately walkable. Some errands can be accomplished on foot, with a mix of nearby amenities.

About this community

Occupancy

Occupancy rate
65%
In line with Utah average
Occupied beds
21 / 32
Average residents 60 per day

License Details

Facility TypeNursing Care Facility
StatusActive
IssuanceMay 11, 2011
ExpirationOctober 31, 2027
CountySalt Lake

Additional Licensing Details

CMS Certification Number465176

Therapy & Rehabilitation

1 service
Rehabilitation Services

Amenities & Lifestyle

0 amenities
Specific ProgramsSkilled Nursing, Rehabilitation, In-house Therapy

Types of Care at Stonehenge of South Jordan

Skilled Nursing

Contact Stonehenge of South Jordan

Inspection History

In Utah, the Department of Health and Human Services, Health Facility Licensing conducts regular onsite inspections to ensure compliance with state and federal healthcare standards.

1 visit/inspection

Latest inspection

Date December 16, 2024
Complaint Investigation

13 deficiencies

Deficiencies indicate regulatory issues. A higher number implies the facility had several areas requiring improvement.

Utah average: 14 deficiencies

Health Inspection History

Inspections
Total health inspections 2

Utah average 3.5


Last Health inspection on Dec 2024

Total health citations 8

Utah average 27.7

Citations per inspection
4

Utah average 7.62


Health citations are formal notices following inspections when they fail to comply with safety and care standards.

All 8 citations resulted from standard inspections.

Breakdown of citation severity (last 3 years)
Critical Health citations More info 0
100% better than Utah average

Utah average: 0.7


Serious Health citations More info 1
60% better than Utah average

Utah average: 2.5

0 critical citations More info Utah average: 0.7

1 serious citation More info Utah average: 2.5

7 moderate citations More info Utah average: 24.5

0 minor citations More info Utah average: 0.1
Citations history (last 3 years)
Infection Control moderate citation Info Issues related to preventing and controlling infections, including hygiene practices and safety protocols. Dec 18, 2024
Corrected

Quality of Care moderate citation Info Issues related to how well residents receive appropriate treatment and support for their medical and daily care needs. Dec 18, 2024
Corrected

Infection Control moderate citation Info Issues related to preventing and controlling infections, including hygiene practices and safety protocols. Jun 17, 2021
Corrected

Nutrition moderate citation Info Issues related to food quality, meal service, and resident's nutritional needs. Jun 17, 2021
Corrected

Compare Nursing Homes around West Jordan The information below is reported by the Utah Department of Health and Human Services, Health Facility Licensing.

2 facilities compared · CMS & UT Dept. of Health data · Updated Apr 2026

Filter by care type
Stonehenge of South Jordan
NH

Nursing Home Licensed facility providing 24/7 skilled nursing care for residents with complex, ongoing medical needs. Staffed by RNs, LPNs, and CNAs. Inspected and star-rated annually by CMS. Accepts Medicare (short-term rehab) and Medicaid (long-term care).

South Jordan
32
64.7%
-8%
4.42
+18%
+19%
0
8
4.0
1
24
51
Stonehenge Of South Jordan Llc
$6.3M
$2.2M
35%
465176
West Jordan Care Center
-
NH

Nursing Home Licensed facility providing 24/7 skilled nursing care for residents with complex, ongoing medical needs. Staffed by RNs, LPNs, and CNAs. Inspected and star-rated annually by CMS. Accepts Medicare (short-term rehab) and Medicaid (long-term care).

West Jordan
82
-
-
-
-
-
-
-
-
0
0
0.0
0
-
65
-
-
-
-
-

Places of interest near Stonehenge of South Jordan

Address 3.9 miles from city center — 2.86 miles to nearest hospital (Physicians' Research Options)

Calculate Travel Distance to Stonehenge of South Jordan

Add your location

Address

Staffing Data (Q2 2025)

This data corresponds to Q2 2025 and is based on CMS Payroll-Based Journal.

Total staff 135
Employees 72
Contractors 63
Staff to resident ratio 7.94:1
275% better than Utah average

Utah average ratio: 2.12:1

Avg staff/day 24
Average shift 7.5 hours
5% worse than Utah average

Utah average: 7.9 hours

Total staff hours (quarter) 16,299
Nursing staff breakdown
Registered Nurse

Manages medical care and health needs.

Total count 27
Average shift length Info Average shift length. Calculated as total hours divided by days worked and average staff per day. 8.1 hours

This role is partially covered by contractors.

Licensed Practical Nurse

Assists with medical care and medications.

Total count 7
Average shift length Info Average shift length. Calculated as total hours divided by days worked and average staff per day. 8 hours

This role is partially covered by contractors.

Certified Nursing Assistant

Helps with daily care and mobility.

Total count 56
Average shift length Info Average shift length. Calculated as total hours divided by days worked and average staff per day. 8.3 hours

This role is partially covered by contractors.

Contractor staffing

Total hours from contractors

10.2%

1,667 contractor hours this quarter

Certified Nursing Assistant: 38 Registered Nurse: 17 Licensed Practical Nurse: 3 Mental Health Service Worker: 1 Other Social Services Staff: 1 Medical Director: 1 Occupational Therapy Aide: 1 Occupational Therapy Assistant: 1
Staff by category
Certified Nursing Assistant1838565,18191100%8.3
Registered Nurse1017272,67191100%8.1
Speech Language Pathologist8081,3406774%7.2
Physical Therapy Aide6061,0066673%6.3
Clinical Nurse Specialist4049377279%7.5
Licensed Practical Nurse4378607481%8
Dental Services Staff2027516369%8.3
Nurse Aide in Training5056905055%7.8
Nurse Practitioner2025126774%7.6
Administrator1015076774%7.6
Respiratory Therapy Technician6064727178%5.8
Physical Therapy Assistant3034626673%5.8
Other Dietary Services Staff1012894448%6.6
Qualified Social Worker1011945358%3.7
RN Director of Nursing1011712629%6.6
Mental Health Service Worker011951618%6
Occupational Therapy Aide011531314%4.1
Medical Director011521314%4
Other Social Services Staff01135910%3.9
Occupational Therapy Assistant0112155%4.2
56 Certified Nursing Assistant
% of Days 100%
27 Registered Nurse
% of Days 100%
8 Speech Language Pathologist
% of Days 74%
6 Physical Therapy Aide
% of Days 73%
4 Clinical Nurse Specialist
% of Days 79%
7 Licensed Practical Nurse
% of Days 81%
2 Dental Services Staff
% of Days 69%
5 Nurse Aide in Training
% of Days 55%
2 Nurse Practitioner
% of Days 74%
1 Administrator
% of Days 74%
6 Respiratory Therapy Technician
% of Days 78%
3 Physical Therapy Assistant
% of Days 73%
1 Other Dietary Services Staff
% of Days 48%
1 Qualified Social Worker
% of Days 58%
1 RN Director of Nursing
% of Days 29%
1 Mental Health Service Worker
% of Days 18%
1 Occupational Therapy Aide
% of Days 14%
1 Medical Director
% of Days 14%
1 Other Social Services Staff
% of Days 10%
1 Occupational Therapy Assistant
% of Days 5%

Facility Characteristics

Source: CMS Long-Term Care Facility Characteristics (Data as of Jan 2026)

Total census
17 residents
Residents by payment source
Medicare
10 residents (58.8%)
Private pay or other
7 residents (41.2%)

Quality of care over time

These measures show how residents usually do over time at this home, based on health outcomes and preventive care.

Short-stay resident measures
Average Utah avg: 2.2 Info CMS star rating based on short-stay quality measure performance. 5 stars = much above average, 1 star = much below average.
Pneumococcal Vaccine Info Percent of short-stay residents assessed and appropriately given the pneumococcal vaccine 99.8%
7% better than Utah average

Utah average: 92.9%

Antipsychotic medication increase Info Percent of short-stay residents who newly received an antipsychotic medication 0.7%
33% better than Utah average

Utah average: 1.1%

Influenza Vaccine Info Percent of short-stay residents assessed and appropriately given the seasonal influenza vaccine 99.2%
9% better than Utah average

Utah average: 91.0%

Re-hospitalized after SNF stay Info Percentage of short-stay residents who were re-hospitalized after their nursing home admission. 18.5%
6% worse than Utah average

Utah average: 17.4%

Emergency department visits Info Percentage of short-stay residents who had an outpatient emergency department visit. 14.1%
19% worse than Utah average

Utah average: 11.8%

Falls with major injury Info Percentage of SNF residents who experience falls with major injury during their stay. 0.8%
9% worse than Utah average

Utah average: 0.8%

Ability to care for self at discharge Info Percentage of residents at or above expected ability to care for themselves at discharge. 44.9%
16% worse than Utah average

Utah average: 53.7%

Successful return to home or community Info Rate of successful return to home or community from a skilled nursing facility. 73.8%
46% better than Utah average

Utah average: 50.6%

Guides for Better Senior Living

Care Cost Calculator: See Prices in Your Area

Nursing Home Data Explorer

Don’t Wait Too Long: 7 Red Flag Signs Your Parent Needs Assisted Living Now

The True Cost of Assisted Living in 2025 – And How Families Are Paying For It

Understanding Senior Living Costs: Pricing Models, Discounts & Financial Assistance

Financial Aid for Utah Seniors

Get financial aid guidance

Aging Waiver

UT Medicaid Aging Waiver

Age 65+, Utah resident, Medicaid-eligible, nursing home-level care need.

~$2,829/month (300% FBR, individual).

$2,000 (individual), $3,000 (couple).

Rural challenges; waitlists possible.

Utah Alternatives Program

UT Alternatives

Age 60+, Utah resident, at risk of nursing home.

~$2,000/month (individual, varies).

$5,000 (individual).

Limited funding; rural focus.

Older Americans Act (OAA) Services

Utah OAA Services

Age 60+, UT resident; no income/asset limits.

None; donations encouraged.

Not assessed.

12 AAAs; includes Meals on Wheels; rural emphasis.

Medicare Savings Program (MSP)

Utah Medicare Savings Program

Age 65+ or disabled, UT resident, Medicare Part A/B.

~$2,510/month (QMB), ~$3,380/month (SLMB), ~$3,598/month (QI)—individual.

$9,430 (individual), $14,130 (couple).

Includes Extra Help for Part D; no waitlist.

Home Energy Assistance Target (HEAT) Program

Utah HEAT Program

Age 60+ prioritized, UT resident, low-income household.

~$3,970/month (185% FPL).

Not assessed.

Covers gas, electric, propane; emergency aid available.

Utah Caregiver Support Program

Utah Family Caregiver Support Program (FCSP)

Caregivers of 60+ needing care or 55+ caregivers of others; UT resident; 2+ ADLs.

No strict cap; prioritizes low-income (~$24,980/year).

Not assessed.

Includes grandparent caregivers; serves ~1,500 annually.

Senior Community Service Employment Program (SCSEP)

Utah SCSEP

Age 55+, unemployed, low-income, UT resident.

~$1,983/month (125% FPL).

Not specified.

Priority for veterans, rural residents; AARP partnership.

VA Aid and Attendance (A&A) and Housebound Benefits

Utah VA Aid and Attendance/Housebound

Age 65+ or disabled veteran/spouse, UT resident, wartime service, ADL help (A&A) or homebound.

Net income < ~$1,984/month (veteran with dependent, A&A); pension offsets income.

~$155,356 (net worth).

Supports rural veterans; high demand near VA centers.

Property Tax Abatement and Deferral Programs

Utah Circuit Breaker and Deferral Programs

Age 66+ (abatement) or 75+ (deferral), UT resident 10+ months/year, homeowner.

~$40,000/year (household, abatement); no limit for deferral.

Not assessed; home value < ~$500,000 typical.

Abatement up to $1,200; deferral accrues interest (2.5%-5%).

Senior Farmers’ Market Nutrition Program (SFMNP)

Utah SFMNP

Age 60+, UT resident, low-income.

~$2,322/month (185% FPL).

Not assessed.

Vouchers (~$50/season); serves ~5,000 via 12 AAAs.

Tour Icon
Planning a tour? Check our touring checklist.
Chat Icon
Thinking of living here? We can help you speak to a current resident