Stonespring Skilled Nursing Facility
Nursing Home, Respite Care & Hospice Care · Dayton, OH
CMS overall rating Info The Overall CMS Rating is scored from 1 to 5 stars and combines results from health inspections, staffing levels, and quality measures. Health inspections carry the most weight. Staffing and quality scores can increase or decrease the final rating based on performance compared to state and national standards.

Stonespring Skilled Nursing Facility

Nursing Home, Respite Care & Hospice Care · Dayton, OH
CMS overall rating Info The Overall CMS Rating is scored from 1 to 5 stars and combines results from health inspections, staffing levels, and quality measures. Health inspections carry the most weight. Staffing and quality scores can increase or decrease the final rating based on performance compared to state and national standards.
Calculator: See prices in your area
Stonespring Skilled Nursing Facility accepts Medicare, Medicaid, and private pay.

Overview of Stonespring Skilled Nursing Facility

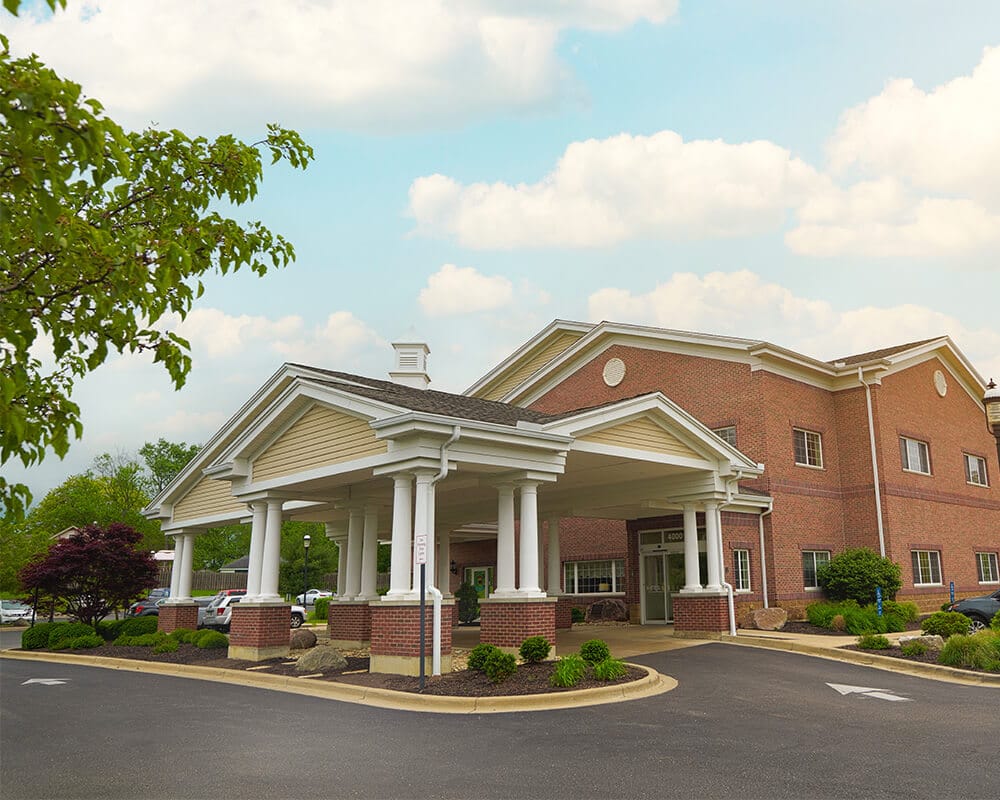
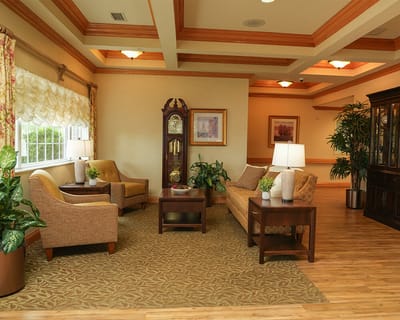
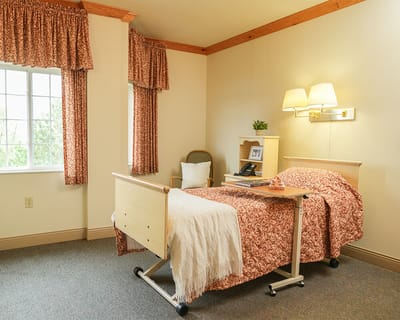
Stonespring Skilled Nursing Facility is a nursing home in Dayton, OH, offering long-term care, rehabilitation, skilled nursing, respite care, and hospice care. With its compassionate and home-like setting, the community ensures older adults can ease their worries in retirement. Healthy meals, therapeutic services, and housekeeping are among the exceptional services dedicated to improving residents’ living experiences. Through personalized care plans, residents receive exceptional care to live to their potential.

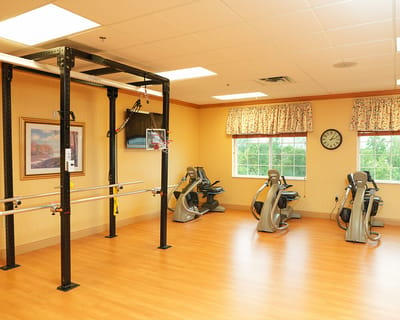
Arts and crafts, light exercises, and a variety of games encourage residents to live actively and make friends. Walking paths, therapy gyms, and an activity room are among the top-notch amenities dedicated to residents’ relaxation and wellness. Located along I-70, near shops and bus stops, the community guarantees accessibility and convenience. Providing exceptional standards of care to help older adults thrive in retirement, this nursing home is one of the best choices for senior living in Ohio.

(937) 415-8000

Quality ratings

Measured by Centers for Medicare & Medicaid Services (CMS)

Overall rating Info The Overall CMS Rating combines results from health inspections, staffing levels and quality measures. Health inspections carry the most weight. Staffing and quality scores can increase or decrease the final rating based on performance compared to state and national standards.
▲ 57.1% Above OH avg. ▲ 57.1% Above OH avg.Click the badge to see the full State ranking.Click here to see the full State ranking.
Health Inspection Info Based on the results of the facility's three most recent standard inspections and any complaint investigations. CMS reviews the number, scope, and severity of deficiencies, with more recent findings weighted more heavily.
▲ 42.8% Above OH avg. ▲ 42.8% Above OH avg.Click the badge to see the full State ranking.Click here to see the full State ranking.
Staffing Info Measures average nursing staff hours per resident per day, including Registered Nurses (RNs) and total nursing staff. Ratings are adjusted based on the level of care residents require and are compared to state and national benchmarks.
▲ 22.8% Above OH avg. ▲ 22.8% Above OH avg.Click the badge to see the full State ranking.Click here to see the full State ranking.
Quality Measures Info Based on clinical and physical health indicators reported to CMS, such as hospital readmissions, falls, pressure ulcers, and improvements in mobility. These measures reflect how well residents' health needs are being managed.
▲ 14.7% Above OH avg. ▲ 14.7% Above OH avg.Click the badge to see the full State ranking.Click here to see the full State ranking.

Staffing hours breakdown

Info Daily nursing hours per resident by staff type, reported to CMS. Higher is generally better — compare this facility to state and national averages to see where staffing stands.

Hours per resident per day — compared to Ohio state averages

Total nursing care / resident Info This home is ranked 85th out of 203 homes in Ohio. Total adjusted nursing hours per resident per day, combining RN, LPN, and aide time. CMS adjusts this for case-mix so facilities can be fairly compared.
3h 35m per day
Rank #85 / 203Nurse hours — State benchmarkedThis home is ranked 85th out of 203 homes in Ohio. Shows adjusted nurse hours per resident per day benchmarked to the Ohio average, with a ranking across 203 Ohio SNFs. More hours mean more direct care. The national average is about 3.5 hrs; below 3.0 is a red flag.Click the rank badge to see the full State ranking.Click here to see the full State ranking.
This facility Ohio avg (3h 32m per day)
vs Ohio avg
+1%

1 of 6 metrics below state avg

Standout metric Physical Therapist is +67% above state avg
Staff typeHours / Day / Residentvs state avg
Registered Nurse (RN) Info RNs hold the highest nursing license and can assess residents, interpret test results, and direct care plans. More RN hours per day often signals stronger clinical oversight and faster response to health changes. 47m per day ▲ 24% State avg: 38m per day · National avg: 41m per day
LPN / LVN Info Licensed Practical Nurses (LPNs) or Licensed Vocational Nurses (LVNs) deliver routine hands-on care — medication administration, wound dressing, and monitoring vital signs. They work under RN supervision and make up a large share of daily bedside care. 53m per day ▼ 9% State avg: 58m per day · National avg: 52m per day
Nurse Aide Info Certified Nurse Aides (CNAs) provide the most direct day-to-day assistance: bathing, dressing, feeding, and mobility. Nurse aide hours are typically the largest staffing category and directly affect residents' quality of life. 2h 26m per day ▲ 14% State avg: 2h 8m per day · National avg: 2h 21m per day
Weekend Total Nursing Info Combined nursing hours (RN + LPN + Nurse Aide) per resident per day on weekends. Staffing often drops on weekends — this figure reveals whether the facility maintains adequate coverage outside of weekday hours. 3h 50m per day ▲ 17% State avg: 3h 17m per day · National avg: 3h 26m per day
Physical Therapist Info Hours per resident per day provided by licensed Physical Therapists (PTs) or PT Assistants. PT services help residents recover mobility after injury or illness and are especially important for post-acute (short-stay) rehabilitation. 5m per day ▲ 67% State avg: 3m per day · National avg: 4m per day
Weekend RN Info Registered nurse hours specifically on weekends. Facilities sometimes reduce RN presence on Saturdays and Sundays — a low weekend RN figure compared to weekday hours can indicate reduced clinical oversight when most administrative staff are absent. 30m per day ▲ 20% State avg: 25m per day · National avg: 29m per day

Capacity and availability

This home usually has limited availability

Higher occupancy than the Ohio average: 78.7%
Occupancy rate
85.5% Rank #80 / 204Occupancy rate — State benchmarkedThis home is ranked 80th out of 204 homes in Ohio. Shows this facility's occupancy rate versus the Ohio average, with its Statewide rank out of 204. Higher occupancy signals strong local demand and financial stability.Click the rank badge to see the full State ranking.Click here to see the full State ranking.
Avg. Length of Stay
61 days
Walk Score
Walk Score: 35 / 100 Rank #400 / 705Walk Score — State benchmarkedThis home is ranked 400th out of 705 homes in Ohio. Shows how walkable this facility's neighborhood is compared to the average Walk Score across Ohio SNFs. Higher scores benefit residents, families, and staff.Click the rank badge to see the full State ranking.Click here to see the full State ranking.
Somewhat walkable. A few nearby services may be reachable on foot, but most trips require transportation.

Contact Stonespring Skilled Nursing Facility

Staffing Data

Reporting period: October 1 – December 31, 2025 (Q4 2025). Source: CMS Payroll-Based Journal report.

Total staff 228
Employees 192
Contractors 36
Staff to resident ratio 1.70:1
16% worse than Ohio average
Ohio average ratio: 2.04:1 Ohio average ratio: 2.04:1See full Ohio ranking
Avg staff/day 80
Average shift 8 hours
0% compared with Ohio average
Ohio average: 8.1 hours Ohio average shift: 8.1 hoursSee full Ohio ranking
Total staff hours (quarter) 58,665

Nursing staff breakdown

Q4 2025 · Oct 1 – Dec 31 More info This data comes from the CMS Payroll-Based Journal report covering October 1 – December 31, 2025.
Registered Nurse

Manages medical care and health needs.

RN Staff Info All 17 RN Staff are full-time employees. No contractors work on this role. 17
Average shift length Info Average shift length. Calculated as total hours divided by days worked and average staff per day. 9.4 hours
Licensed Practical Nurse

Assists with medical care and medications.

LPN Staff Info All 34 LPN Staff are full-time employees. No contractors work on this role. 34
Average shift length Info Average shift length. Calculated as total hours divided by days worked and average staff per day. 8.9 hours
Certified Nursing Assistant

Helps with daily care and mobility.

CNA Staff Info All 96 CNA Staff are full-time employees. No contractors work on this role. 96
Average shift length Info Average shift length. Calculated as total hours divided by days worked and average staff per day. 7.8 hours

Contractor staffing

Q4 2025 · Oct 1 – Dec 31 More info This data comes from the CMS Payroll-Based Journal report covering October 1 – December 31, 2025.

Total hours from contractors

9.3%

5,449 contractor hours this quarter

Speech Language Pathologist: 11 Respiratory Therapy Technician: 9 Physical Therapy Aide: 7 Physical Therapy Assistant: 3 Qualified Social Worker: 2 Qualified Activities Professional: 1 Occupational Therapy Assistant: 1 Other Physician: 1 Medical Director: 1

Staff by category

Q4 2025 · Oct 1 – Dec 31 More info This data comes from the CMS Payroll-Based Journal report covering October 1 – December 31, 2025.
Certified Nursing Assistant9609627,63792100%7.8
Licensed Practical Nurse340348,79392100%8.9
Registered Nurse170175,40292100%9.4
Clinical Nurse Specialist150153,3669199%7.6
Speech Language Pathologist011111,5547379%7.4
RN Director of Nursing5051,4507683%8
Medication Aide/Technician4041,4369098%8.1
Physical Therapy Aide0771,3757177%7.6
Nurse Aide in Training110111,2347177%9.3
Physical Therapy Assistant0339176773%6.7
Mental Health Service Worker2028936267%7.8
Respiratory Therapy Technician0998787582%6.8
Nurse Practitioner1015587177%7.9
Occupational Therapy Aide2025336672%7.5
Qualified Social Worker0224936470%7.5
Feeding Assistant1014736368%7.5
Dental Services Staff1014395762%7.7
Administrator1013586571%5.5
Dietitian1013476368%5.5
Other Dietary Services Staff1013003942%7.7
Qualified Activities Professional011971921%5.1
Other Physician01166910%7.3
Occupational Therapy Assistant0115267%8.7
Medical Director0111833%6
96 Certified Nursing Assistant
% of Days 100%
34 Licensed Practical Nurse
% of Days 100%
17 Registered Nurse
% of Days 100%
15 Clinical Nurse Specialist
% of Days 99%
11 Speech Language Pathologist
% of Days 79%
5 RN Director of Nursing
% of Days 83%
4 Medication Aide/Technician
% of Days 98%
7 Physical Therapy Aide
% of Days 77%
11 Nurse Aide in Training
% of Days 77%
3 Physical Therapy Assistant
% of Days 73%
2 Mental Health Service Worker
% of Days 67%
9 Respiratory Therapy Technician
% of Days 82%
1 Nurse Practitioner
% of Days 77%
2 Occupational Therapy Aide
% of Days 72%
2 Qualified Social Worker
% of Days 70%
1 Feeding Assistant
% of Days 68%
1 Dental Services Staff
% of Days 62%
1 Administrator
% of Days 71%
1 Dietitian
% of Days 68%
1 Other Dietary Services Staff
% of Days 42%
1 Qualified Activities Professional
% of Days 21%
1 Other Physician
% of Days 10%
1 Occupational Therapy Assistant
% of Days 7%
1 Medical Director
% of Days 3%

Penalties and fines

Federal penalties imposed by CMS for regulatory violations, including civil money penalties (fines) and denials of payment for new Medicare/Medicaid admissions.

Source: CMS Penalties Database

No penalties in the past 3 years

No civil money penalties or payment denials were reported in the last 3 years.

Quality of care over time

These measures show how residents usually do over time at this home, based on health outcomes and preventive care.

High-risk clinical events score Info A composite score based on pressure ulcers, falls with injury, weight loss, walking ability decline, and activities of daily living decline. 5.5
6% better than Ohio average

Ohio average: 5.8

Functional decline score Info A composite score based on activities of daily living decline, walking ability decline, and incontinence. 14.7
16% worse than Ohio average

Ohio average: 12.7

Long-stay resident measures
Significantly above average Info CMS star rating based on long-stay quality measure performance. 5 stars = significantly above average, 1 star = significantly below average.
Need for Help with Daily Activities Increased Info Percent of long-stay residents whose need for help with daily activities has increased 7.1%
In line with Ohio average

Ohio average: 6.8%

Walking Ability Worsened Info Percent of long-stay residents whose ability to move independently worsened 10.4%
16% worse than Ohio average

Ohio average: 8.9%

Low Risk Residents with Bowel/Bladder Incontinence Info Percent of low risk long-stay residents who lose control of their bowels or bladder 26.5%
21% worse than Ohio average

Ohio average: 22.0%

Falls with Major Injury Info Percent of long-stay residents experiencing one or more falls with major injury 4.0%
15% worse than Ohio average

Ohio average: 3.4%

High Risk Residents with Pressure Ulcers Info Percent of long-stay high risk residents with pressure ulcers 2.2%
44% better than Ohio average

Ohio average: 3.9%

Urinary Tract Infection Info Percent of long-stay residents with a urinary tract infection 0.8%
45% worse than Ohio average

Ohio average: 0.5%

Lost Too Much Weight Info Percent of long-stay residents who lose too much weight 3.9%
37% better than Ohio average

Ohio average: 6.2%

Depressive Symptoms Info Percent of long-stay residents who have depressive symptoms 21.8%
9% better than Ohio average

Ohio average: 24.0%

Antipsychotic Use Info Percent of long-stay residents who received an antipsychotic medication 3.5%
58% better than Ohio average

Ohio average: 8.4%

Pneumococcal Vaccine Info Percent of long-stay residents assessed and appropriately given the pneumococcal vaccine 100.0%
8% better than Ohio average

Ohio average: 92.4%

Influenza Vaccine Info Percent of long-stay residents assessed and appropriately given the seasonal influenza vaccine 89.8%
5% worse than Ohio average

Ohio average: 94.5%

Hospitalizations per 1,000 days Info Number of hospitalizations per 1,000 long-stay resident days. 0.63
64% better than Ohio average

Ohio average: 1.77

ED visits per 1,000 days Info Number of outpatient emergency department visits per 1,000 long-stay resident days. 0.55
70% better than Ohio average

Ohio average: 1.83

Short-stay resident measures
Significantly above average Info CMS star rating based on short-stay quality measure performance. 5 stars = much above average, 1 star = much below average.
Pneumococcal Vaccine Info Percent of short-stay residents assessed and appropriately given the pneumococcal vaccine 99.8%
28% better than Ohio average

Ohio average: 78.0%

Antipsychotic medication increase Info Percent of short-stay residents who newly received an antipsychotic medication 0.6%
54% better than Ohio average

Ohio average: 1.3%

Influenza Vaccine Info Percent of short-stay residents assessed and appropriately given the seasonal influenza vaccine 92.6%
23% better than Ohio average

Ohio average: 75.6%

Re-hospitalized after SNF stay Info Percentage of short-stay residents who were re-hospitalized after their nursing home admission. 26.1%
In line with Ohio average

Ohio average: 25.1%

Emergency department visits Info Percentage of short-stay residents who had an outpatient emergency department visit. 7.6%
39% better than Ohio average

Ohio average: 12.5%

Falls with major injury Info Percentage of SNF residents who experience falls with major injury during their stay. 0.9%
18% worse than Ohio average

Ohio average: 0.8%

Ability to care for self at discharge Info Percentage of residents at or above expected ability to care for themselves at discharge. 61.0%
14% better than Ohio average

Ohio average: 53.7%

Successful return to home or community Info Rate of successful return to home or community from a skilled nursing facility. 52.3%
In line with Ohio average

Ohio average: 50.6%

Breakdown by payment type

Medicare

41% of new residents, usually for short-term rehab.

Typical stay 26 days

Private pay

45% of new residents, often for short stays.

Typical stay 3 months

Medicaid

13% of new residents, often for long-term daily care.

Typical stay 2 - 3 months

Facility Characteristics

Source: CMS Long-Term Care Facility Characteristics (Data as of Jan 2026)

Total residents 134
Medicare
46
34.3% of residents
Medicaid
77
57.5% of residents
Private pay or other
11
8.2% of residents
Programs & Services
Residents Group

Residents meet regularly to discuss policies, care quality, and activities

Nurse Aide Training

State-approved Nurse Aide Training and Competency Evaluation Program on-site

Active Resident Council

Organized group of residents that meets regularly to discuss facility policies, quality of life, and activities.

Finances and operations

Privately-owned community
Operated by a business corporation.
Home revenue
$20.5M
Profit
$110.5K
Privately-owned community Operated by a business corporation.
Home revenue
$20.5M Rank #17 / 203Revenue — State benchmarkedThis home is ranked 17th out of 203 homes in Ohio. Shows this facility's annual revenue compared to the Ohio SNF average. Higher revenue generally means more resources for staffing and capital — read alongside Payroll %.Click the rank badge to see the full State ranking.Click here to see the full State ranking.
Profit
$110.5K
Payroll costs Info The portion of the home's budget spent on staff, including nurses, caregivers, and other employees who support care and operations. Rank #32 / 203Payroll — State benchmarkedThis home is ranked 32nd out of 203 homes in Ohio. Shows total annual staff payroll benchmarked to the Ohio average. Higher payroll investment relative to peers often signals better staffing and less reliance on cheaper contract labor.Click the rank badge to see the full State ranking.Click here to see the full State ranking.
$8.6M
42.1% of revenue Rank #176 / 203Payroll % — State benchmarkedThis home is ranked 176th out of 203 homes in Ohio. Shows payroll as a percentage of revenue versus the Ohio average. Well-run Ohio SNFs typically land around 54–64% — the top third Statewide. Below 25% may signal understaffing or heavy agency use — read with Staffing ratings.Click the rank badge to see the full State ranking.Click here to see the full State ranking.
Other operating costs Info All remaining costs needed to run the home, such as food, utilities, building maintenance, supplies and administrative expenses.
$11.7M
Total costs $20.4M

What does this home offer?

Housing options icon

Housing Options: Private Rooms / Companion Suites

Building type icon
Building type icon

Building Type: 2-story

Beauty services icon

Beauty Services

Social and recreational activities icon

Social and Recreational Activities

Rehabilitative support icon

Rehabilitative Support

On-site medical care and health services icon

On-site Medical Care and Health Services

Who this home usually serves

TYPE OF STAY

Mix of rehab and long-term care

This home supports both short-term rehab and long-term care, with residents staying for a wide range of durations.

Places of interest near Stonespring Skilled Nursing Facility

Address 8.1 miles from city center Info Estimated distance in miles from Dayton's city center to Stonespring Skilled Nursing Facility's address, calculated via Google Maps.

Calculate Travel Distance to Stonespring Skilled Nursing Facility

Add your location

Address

Financial Assistance for
Nursing Home in Ohio

Stonespring Skilled Nursing Facility is located in Dayton, Ohio.
Here are the financial assistance programs available to residents in Ohio.

Get Financial aid guidance

PASSPORT Waiver

Ohio Medicaid PASSPORT

Age 60+
General Ohio resident, Medicaid-eligible, nursing home-level care need.
Income Limits (2025) ~$2,829/month 300% FBR, individual
Asset Limits $2,000 (individual), $3,000 (couple).
OH

Administered through regional agencies; waitlists possible.

Benefits
Personal care (5-7 hours/day) Respite (240 hours/year) Adult day care ($65/day) Home modifications ($1,500 avg.)

Ohio Home Care Program (non-Medicaid)

OH HCP

Age 60+
General Ohio resident, at risk of decline.
Income Limits ~$2,000/month individual, varies
Asset Limits $5,000 individual
OH

Limited funding; regional variation.

Benefits
In-home care (3-5 hours/week) Respite (up to 10 days/year) Transportation (~5 trips/month)

Assisted Living Waiver (ALW)

Ohio Assisted Living Waiver

Age 21+ (65+ prioritized)
General OH resident, Medicaid-eligible, NFLOC.
Income Limits (2025) ~$2,829/month (individual); QIT required.
Asset Limits $2,000 (individual), $3,000 (couple).
OH

Covers ~300 facilities; room/board not included (separate cost).

Benefits
Personal care Meals Medication management Transportation (~$3,000-$4,000/month value)

Program of All-Inclusive Care for the Elderly (PACE)

Ohio PACE (e.g., McGregor PACE)

Age 55+
General OH resident (specific counties), NFLOC, safe with PACE support.
Income Limits (2025) ~$2,829/month (Medicaid-eligible); private pay option available.
Asset Limits $2,000 (individual), $3,000 (couple) for Medicaid enrollees.
OH

Available in 9 counties (e.g., Cuyahoga, Franklin); expanding via Healthy Aging Grants.

Benefits
Personal care (5-7 hours/day) Medical care Meals Transportation Respite Therapies

Medicare Savings Program (MSP)

Ohio Medicare Savings Program

Age 65+ or disabled
General OH resident, Medicare Part A/B.
Income Limits (2025) ~$2,510/month (QMB), ~$3,380/month (SLMB), ~$3,598/month (QI)—individual.
Asset Limits $9,430 (individual), $14,130 (couple).
OH

Three tiers; includes Extra Help for Part D; no waitlist.

Benefits
Covers Part B premiums ($174.70/month) Deductibles ($240/year) Copays (~20%)

Home Energy Assistance Program (HEAP)

Ohio HEAP

Age 60+ prioritized
General OH resident, low-income household.
Income Limits (2025) ~$3,970/month individual, 185% FPL
Asset Limits Not assessed; income-focused.
OH

Covers gas, electric, oil; emergency aid via Winter/Summer Crisis Programs.

Benefits
Heating/cooling aid ($300-$1,000/season) Emergency aid ($500 max)

Family Caregiver Support Program (FCSP)

Ohio Family Caregiver Support Program

Age
General Caregivers of 60+ needing care or 55+ caregivers of others; OH resident; functional needs (2+ ADLs).
Income Limits (2025) Prioritizes ~$24,980/year (individual); no strict cap.
Asset Limits Not assessed; need-based.
OH

12 AAAs; rural/low-income priority; volunteer respite option.

Benefits
Respite (4-6 hours/week or 5 days/year) Adult day care ($60/day) Training Supplies (~$500/year)

VA Aid and Attendance (A&A) and Housebound Benefits

Ohio VA Aid and Attendance/Housebound

Age 65+ or disabled veteran/spouse
General OH resident, wartime service, need for ADL help (A&A) or homebound.
Income Limits (2025) Net income < ~$1,984/month (veteran with dependent, A&A); pension offsets income.
Asset Limits ~$155,356 net worth limit
OH

High veteran demand; supports care in multiple settings.

Benefits
Cash (~$1,433-$2,642/month veteran, ~$951-$1,318 spouse) for care costs (e.g., in-home, assisted living)

Homestead Exemption

Ohio Homestead Exemption

Age 65+ (or disabled)
General OH resident, homeowner, low-income.
Income Limits (2025) ~$38,500/year individual, adjusted annually
Asset Limits Not assessed; home ownership required.
OH

Reduces taxable value by $25,000; applies to primary residence.

Benefits
Tax reduction (~$400-$800/year avg., varies by county)

Save the Dream Ohio (Homeowner Assistance Fund)

Ohio Save the Dream

Age 60+ prioritized
General OH resident, homeowner, hardship post-Jan 21, 2020.
Income Limits (2025) ~$147,600/year family of 4, 150% AMI; varies by county
Asset Limits Not assessed; hardship-focused.
OH

Covers delinquent mortgages, utilities, taxes; max $25,000 mortgage aid.

Benefits
Mortgage aid ($25,000 max) Utility/property tax aid ($5,000 avg.)

Compare Nursing Home around Dayton

The information below is reported by the Ohio Department of Health, Bureau of Survey and Certification.

2 facilities compared · CMS & OH Dept. of Health data

Filter by care type
Stonespring Skilled Nursing Facility
NH

Nursing Home Licensed facility providing 24/7 skilled nursing care for residents with complex, ongoing medical needs. Staffed by RNs, LPNs, and CNAs. Inspected and star-rated annually by CMS. Accepts Medicare (short-term rehab) and Medicaid (long-term care).

HC

Home Care Professional care delivered in the person's own home — from companionship and errands to skilled nursing and therapy. Allows seniors to age in place. Medicare covers skilled home health when medically necessary.

RC

Respite Care Short-term temporary care — days to weeks — to give family caregivers a break. Full care provided during the stay. Often used after hospitalization or to trial a facility before a permanent placement decision.

Dayton
144
Facility 144
OH AVG 80
Rank #30 / 323
--3.58 -19%+1%$0142.0-122
35
Facility 35
OH AVG 40
Rank #400 / 705
Jillian Douglas$20.5M$8.6M42.1%366388
Laurels of Huber Heights
NH

Nursing Home Licensed facility providing 24/7 skilled nursing care for residents with complex, ongoing medical needs. Staffed by RNs, LPNs, and CNAs. Inspected and star-rated annually by CMS. Accepts Medicare (short-term rehab) and Medicaid (long-term care).

Dayton
96
Facility 96
OH AVG 80
Rank #97 / 323
77.1% -2%3.26 -3%-8%$0303.8-82
22
Facility 22
OH AVG 40
Rank #526 / 705
-$11.0M$4.9M44.3%365627

Frequently Asked Questions about Stonespring Skilled Nursing Facility

Is Stonespring Skilled Nursing Facility in a walkable area?

Stonespring Skilled Nursing Facility has a walk score of 35. Somewhat walkable. A few nearby services may be reachable on foot, but most trips require transportation.

Are there photos of Stonespring Skilled Nursing Facility?

Yes — there are 7 photos of Stonespring Skilled Nursing Facility in the photo gallery on this page.

What is the address of Stonespring Skilled Nursing Facility?

Stonespring Skilled Nursing Facility is located at 4000 Singing Hills Blvd, Dayton, OH 45414.

What is the phone number of Stonespring Skilled Nursing Facility?

(937) 415-8000 will put you in contact with the team at Stonespring Skilled Nursing Facility.

Is Stonespring Skilled Nursing Facility Medicare or Medicaid certified?

Yes — Stonespring Skilled Nursing Facility is a CMS-certified provider of Medicare and Medicaid.

Guides for Better Senior Living

Care Cost Calculator: See Prices in Your Area

Nursing Home Data Explorer

Don’t Wait Too Long: 7 Red Flag Signs Your Parent Needs Assisted Living Now

The True Cost of Assisted Living in 2025 – And How Families Are Paying For It

Understanding Senior Living Costs: Pricing Models, Discounts & Financial Assistance

Explore Open Rooms
1 Contact details
2 What type of senior care service are you looking for?
3 What budget do you have in mind for senior care?
4 How soon do you need to find care?
5 Additional details

Thank you for your interest!

Our team will be in touch shortly to help with next steps.