StoryPoint Clinton Township
Nursing Home, Assisted Living, Independent Living & Memory Care · Clinton Twp, MI
CMS overall rating Info CMS (the Centers for Medicare & Medicaid Services) is the federal agency that rates nursing home quality. Its Overall Rating runs from 1 to 5 stars, combining health inspections, staffing, and quality measures, with inspections weighted most heavily.

StoryPoint Clinton Township

Nursing Home, Assisted Living, Independent Living & Memory Care · Clinton Twp, MI
CMS overall rating Info CMS (the Centers for Medicare & Medicaid Services) is the federal agency that rates nursing home quality. Its Overall Rating runs from 1 to 5 stars, combining health inspections, staffing, and quality measures, with inspections weighted most heavily.
Calculator: See prices in your area
StoryPoint Clinton Township accepts Medicare, Medicaid, and private pay.

Overview of Storypoint Clinton Township

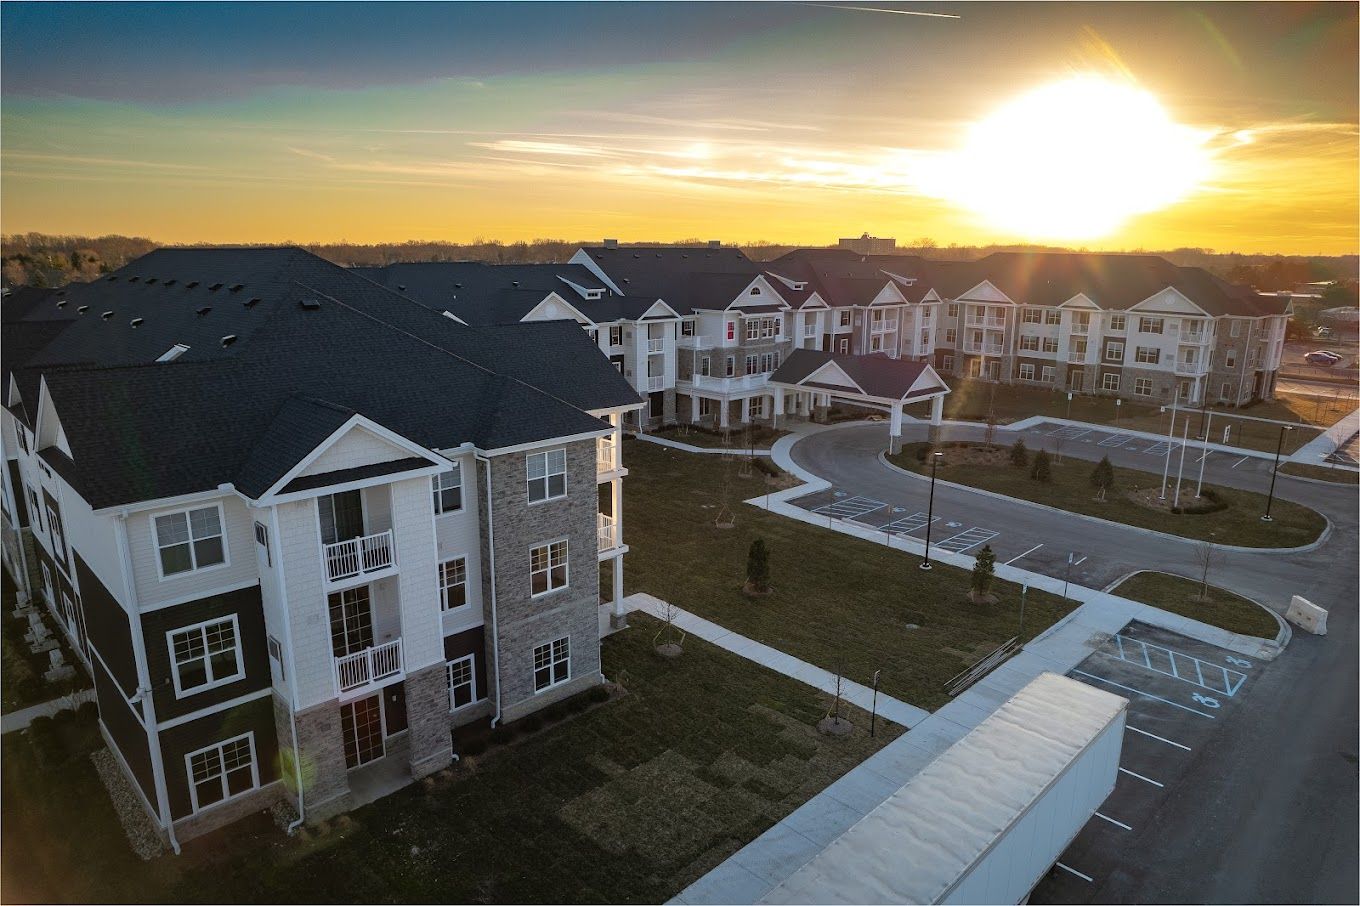
Tucked away in Clinton Township, MI, Storypoint Clinton Township is a reliable senior living community that offers an array of care options, including independent living, enhanced living, assisted living, and memory care. Residents here are guaranteed a seamless transition should their needs evolve with the community’s continuum of care. The community features an array of beautifully designed apartments that are made to accommodate various lifestyle and mobility levels. Round-the-clock licensed support, response systems, and health care coordination, ensures residents are always given the support they need.

Housekeeping, laundry, meal preparation, and transportation are handled by the community to provide residents with a carefree and maintenance-free lifestyle. Each day is an opportunity for a vibrant living experience with a wide variety of activities, events, and programs conducted within and outside the community. With its wide array of convenient services, compassionate care, and friendly neighborhood, residents are sure to enjoy a fulfilling living experience in Storypoint Clinton Township.

Quality ratings

Measured by Centers for Medicare & Medicaid Services (CMS)

Overall rating Info The Overall CMS Rating combines results from health inspections, staffing levels and quality measures. Health inspections carry the most weight. Staffing and quality scores can increase or decrease the final rating based on performance compared to state and national standards.
▼ 4.4% Below MI avg. ▼ 4.4% Below MI avg.MI average: 3.1Click the badge to see the full State ranking.Click here to see the full State ranking.
Health Inspection Info Based on the results of the facility's three most recent standard inspections and any complaint investigations. CMS reviews the number, scope, and severity of deficiencies, with more recent findings weighted more heavily.
▼ 29.3% Below MI avg. ▼ 29.3% Below MI avg.MI average: 2.8Click the badge to see the full State ranking.Click here to see the full State ranking.
Staffing Info Measures average nursing staff hours per resident per day, including Registered Nurses (RNs) and total nursing staff. Ratings are adjusted based on the level of care residents require and are compared to state and national benchmarks.
▼ 14.2% Below MI avg. ▼ 14.2% Below MI avg.MI average: 3.5Click the badge to see the full State ranking.Click here to see the full State ranking.
Quality Measures Info Based on clinical and physical health indicators reported to CMS, such as hospital readmissions, falls, pressure ulcers, and improvements in mobility. These measures reflect how well residents' health needs are being managed.
▲ 33.0% Above MI avg. ▲ 33.0% Above MI avg.MI average: 3.8Click the badge to see the full State ranking.Click here to see the full State ranking.

Staffing hours breakdown

Info Daily nursing hours per resident by staff type, reported to CMS. Higher is generally better — compare this facility to state and national averages to see where staffing stands.

Hours per resident per day — compared to Michigan state averages

Total nursing care / resident Info This home is ranked 117th out of 142 homes in Michigan for nurse hours. Total adjusted nursing hours per resident per day, combining RN, LPN, and aide time. CMS adjusts this for case-mix so facilities can be fairly compared.
3h 34m per day
Rank #117 / 142Nurse hours — State benchmarkedThis home is ranked 117th out of 142 homes in Michigan. Shows adjusted nurse hours per resident per day benchmarked to the Michigan average, with a ranking across 142 Michigan facilities. More hours mean more direct care. The national average is about 3.5 hrs; below 3.0 is a red flag.Rankings are based only on facilities in Michigan that report data for that category. Facilities without available data are excluded from the ranking.Click the rank badge to see the full State ranking.Click here to see the full State ranking.
This facility Michigan avg (4h 18m per day)
vs Michigan avg
-17%

5 of 6 metrics below state avg

Standout metric LPN / LVN is +23% above state avg
Staff typeHours / Day / Residentvs state avg
Registered Nurse (RN) Info RNs hold the highest nursing license and can assess residents, interpret test results, and direct care plans. More RN hours per day often signals stronger clinical oversight and faster response to health changes. 17m per day ▼ 63% State avg: 46m per day · National avg: 41m per day
LPN / LVN Info Licensed Practical Nurses (LPNs) or Licensed Vocational Nurses (LVNs) deliver routine hands-on care — medication administration, wound dressing, and monitoring vital signs. They work under RN supervision and make up a large share of daily bedside care. 1h 5m per day ▲ 23% State avg: 53m per day · National avg: 52m per day
Nurse Aide Info Certified Nurse Aides (CNAs) provide the most direct day-to-day assistance: bathing, dressing, feeding, and mobility. Nurse aide hours are typically the largest staffing category and directly affect residents' quality of life. 2h 13m per day ▼ 5% State avg: 2h 20m per day · National avg: 2h 20m per day
Weekend Total Nursing Info Combined nursing hours (RN + LPN + Nurse Aide) per resident per day on weekends. Staffing often drops on weekends — this figure reveals whether the facility maintains adequate coverage outside of weekday hours. 3h 11m per day ▼ 9% State avg: 3h 31m per day · National avg: 3h 27m per day
Physical Therapist Info Hours per resident per day provided by licensed Physical Therapists (PTs) or PT Assistants. PT services help residents recover mobility after injury or illness and are especially important for post-acute (short-stay) rehabilitation. 1m per day ▼ 87% State avg: 4m per day · National avg: 4m per day
Weekend RN Info Registered nurse hours specifically on weekends. Facilities sometimes reduce RN presence on Saturdays and Sundays — a low weekend RN figure compared to weekday hours can indicate reduced clinical oversight when most administrative staff are absent. 13m per day ▼ 55% State avg: 29m per day · National avg: 29m per day

Capacity and availability

Avg. Length of Stay
160 days
Bed community size
69-bed community Rank #224 / 435Bed count — State benchmarkedThis home is ranked 224th out of 435 homes in Michigan. Shows this facility's certified or reported bed count compared to other Michigan facilities. Larger communities may offer more amenities, programs, and on-site services for residents and families.Rankings are based only on facilities in Michigan that report data for that category. Facilities without available data are excluded from the ranking.Click the rank badge to see the full State ranking.Click here to see the full State ranking.
A moderately sized community that may balance personal attention with shared amenities and social activities.
Years in operation
39 years in operation Rank #13 / 182Years in operation — State benchmarkedThis home is ranked 13th out of 182 homes in Michigan. Shows how long this facility has been in operation compared to other Michigan facilities. Longer operating histories may benefit residents, families, and staff.Rankings are based only on facilities in Michigan that report data for that category. Facilities without available data are excluded from the ranking.Click the rank badge to see the full State ranking.Click here to see the full State ranking.
A longer operating history, which may indicate experience navigating regulations and delivering ongoing care.
Walk Score
Walk Score: 42 / 100 Rank #300 / 703Walk Score — State benchmarkedThis home is ranked 300th out of 703 homes in Michigan. Shows how walkable this facility's neighborhood is compared to the average Walk Score across Michigan facilities. Higher scores benefit residents, families, and staff.Rankings are based only on facilities in Michigan that report data for that category. Facilities without available data are excluded from the ranking.Click the rank badge to see the full State ranking.Click here to see the full State ranking.
Somewhat walkable. A few nearby services may be reachable on foot, but most trips require transportation.
BBB Rating
BBB Rating: A+ (Not Accredited)
An independent rating from the Better Business Bureau based on factors such as complaint history, transparency, and business practices.
How BBB ratings work

About this community

Occupancy

Occupancy rate
33%
Rank #298 / 395Occupancy rate — State benchmarkedThis home is ranked 298th out of 395 homes in Michigan. Shows this facility's occupancy rate versus the Michigan average, with its Statewide rank out of 395. Higher occupancy signals strong local demand and financial stability.Rankings are based only on facilities in Michigan that report data for that category. Facilities without available data are excluded from the ranking.Click the rank badge to see the full State ranking.Click here to see the full State ranking.
Lower than the Michigan average: 75.8%
Occupied beds
23 / 69
Average occupied beds in Michigan homes 84 beds

License Details

Facility TypeHomes For The Aged
StatusRegular
IssuanceAugust 1, 2026
ExpirationJuly 31, 2027
CountyMacomb
License NumberAH500411978
CMS Certification Number235405

Ownership & Operating Entity

StoryPoint Clinton Township is legally operated by Clinton Care Sublessee LLC.

Staffing

Key information about the people who lead and staff this community.

Leadership

ContactMr. Tim Bryant, President

Contact StoryPoint Clinton Township

Inspection History

In Michigan, the Department of Licensing and Regulatory Affairs (LARA) conducts unannounced inspections and investigations to ensure long-term care facilities comply with state health codes.

Since 2024 · 2 years of data 3 deficiencies 2 inspections

Inspection Scorecard Info This scorecard compares key inspection, deficiency, and complaint metrics at this facility against the Michigan state average. Metrics rated ≥15% worse than average are highlighted in red; those ≥15% better are highlighted in green.

Since 2024 vs. Michigan state average
Overall vs. MI average 0 Worse No metrics in this bucket. 4 Better Metrics better than Michigan average:
• Total deficiencies (63% below)
• Deficiencies per year (63% below)
• Deficiencies per inspection (6% below)
• Total inspections (60% below)
Latest Inspection March 4, 2025 Renewal

Deficiencies Info Deficiencies are formal regulatory issues recorded during state inspections.

This FacilityMI Averagevs. MI Avg
Total deficiencies Info Formal regulatory issues recorded by inspectors across all inspection types. 38 This facility has 63% fewer total deficiencies than a typical Michigan nursing home (3 vs. MI avg 8).↓ 63% better
Deficiencies per year Info Average deficiencies per year since 2024. 1.54 This facility has 63% fewer deficiencies per year than a typical Michigan nursing home (1.5 vs. MI avg 4).↓ 63% better
Deficiencies per inspection Info Average deficiencies per inspection. 1.51.6 This facility has 6% fewer deficiencies per inspection than a typical Michigan nursing home (1.5 vs. MI avg 1.6).↓ 6% better

Inspections Info State inspections evaluate whether the facility meets health and safety standards.

This FacilityMI Averagevs. MI Avg
Total inspections Info Combined count of all routine and focused inspections. Excludes complaint investigations. 25 This facility has 60% fewer total inspections than a typical Michigan nursing home (2 vs. MI avg 5).↓ 60% better

Inspection Reports Summary Info An editor-reviewed summary of the themes and findings across this facility's recent inspection reports.

  • August 8, 2024 original licensing inspection found full compliance and issued a temporary license for 69 beds.
  • March 4, 2025 renewal inspection found three deficiencies including missing background checks for four employees and no designated supervisor of resident care on each shift.
  • March 4, 2025 inspection also found no working thermometer in the main kitchen’s refrigerator and freezer; license renewal was recommended pending corrective action plan.

Health Inspection History

Inspections since 2023
Total health inspections 7

Michigan average 6.5


Last Health inspection on Jun 2025

Total health citations
41 Rank #97 / 144Health citations — State benchmarkedThis home is ranked 97th out of 144 homes in Michigan. Shows this facility's total health deficiency citations benchmarked to the Michigan State average, with a ranking across all 144 MI facilities. Lower citation counts earn a better rank.Rankings are based only on facilities in Michigan that report data for that category. Facilities without available data are excluded from the ranking.Click the rank badge to see the full State ranking.Click here to see the full State ranking.

Michigan average 33.5

Citations per inspection
5.86 Rank #91 / 144Citations per inspection — State benchmarkedThis home is ranked 91st out of 144 homes in Michigan. Shows average deficiency citations per CMS inspection for this facility versus the Michigan mean across 144 facilities with citation data. Lower is better.Rankings are based only on facilities in Michigan that report data for that category. Facilities without available data are excluded from the ranking.Click the rank badge to see the full State ranking.Click here to see the full State ranking.

Michigan average 5.18


Health citations are formal notices following inspections when they fail to comply with safety and care standards.

7 of 41 citations resulted from standard inspections; 6 of 41 resulted from complaint investigations; and 28 of 41 came from combined inspections (standard and complaint).

Breakdown of citation severity (last 3 years)
Critical health citations
0
100% better than Michigan average

Michigan average: 0.3


Serious health citations
1
47% better than Michigan average

Michigan average: 1.9

0 critical citations Michigan average: 0.3

1 serious citation Michigan average: 1.9

40 moderate citations Michigan average: 30.8

0 minor citations Michigan average: 0.5
Citations history (last 3 years)
Infection Control moderate citation Jun 04, 2025
Corrected

Nursing Services moderate citation Jun 04, 2025
Corrected

Pharmacy moderate citation Jun 04, 2025
Corrected

Quality of Care moderate citation Jun 04, 2025
Corrected

Staffing Data

Reporting period: October 1 – December 31, 2025 (Q4 2025). Source: CMS Payroll-Based Journal report.

Total staff 94
Employees 74
Contractors 20
Staff to resident ratio 1.27 : 1
25% fewer staff per resident than Michigan average
Michigan average ratio: 1.70 : 1 Michigan average ratio: 1.70 : 1See full Michigan ranking
Avg staff/day 36
Average shift 8.3 hours
5% better than Michigan average
Michigan average: 7.9 hours Michigan average shift: 7.9 hoursSee full Michigan ranking
Total staff hours (quarter) 27,463

Nursing staff breakdown

Q4 2025 · Oct 1 – Dec 31 More info This data comes from the CMS Payroll-Based Journal report covering October 1 – December 31, 2025.
Registered Nurse

Manages medical care and health needs.

RN Staff Info All 6 RN Staff are full-time employees. No contractors work on this role. 6
Average shift length Info Average shift length. Calculated as total hours divided by days worked and average staff per day. 6.9 hours
Licensed Practical Nurse

Assists with medical care and medications.

LPN Staff Info All 19 LPN Staff are full-time employees. No contractors work on this role. 19
Average shift length Info Average shift length. Calculated as total hours divided by days worked and average staff per day. 8.8 hours
Certified Nursing Assistant

Helps with daily care and mobility.

CNA Staff Info All 35 CNA Staff are full-time employees. No contractors work on this role. 35
Average shift length Info Average shift length. Calculated as total hours divided by days worked and average staff per day. 8.5 hours

Contractor staffing

Q4 2025 · Oct 1 – Dec 31 More info This data comes from the CMS Payroll-Based Journal report covering October 1 – December 31, 2025.

Total hours from contractors

2.8%

764 contractor hours this quarter

Qualified Social Worker: 6 Speech Language Pathologist: 4 Physical Therapy Assistant: 2 Physical Therapy Aide: 2 Respiratory Therapy Technician: 2 Occupational Therapy Assistant: 2 Occupational Therapy Aide: 1 Medical Director: 1

Staff by category

Q4 2025 · Oct 1 – Dec 31 More info This data comes from the CMS Payroll-Based Journal report covering October 1 – December 31, 2025.
Certified Nursing Assistant3503515,00492100%8.5
Licensed Practical Nurse190195,36392100%8.8
RN Director of Nursing4041,9926470%8.1
Registered Nurse6068848390%6.9
Other Dietary Services Staff20270892100%7.1
Clinical Nurse Specialist2025196470%7.9
Administrator1015126470%8
Dental Services Staff1015126470%8
Nurse Practitioner1014946166%8.1
Dietitian1014806065%8
Physical Therapy Aide0222802426%6.2
Occupational Therapy Aide2132372830%7.9
Speech Language Pathologist0441823033%4.7
Physical Therapy Assistant0221002022%5
Qualified Social Worker066872022%3.6
Respiratory Therapy Technician022621415%4.4
Occupational Therapy Assistant0222544%6.2
Medical Director011231516%1.5
35 Certified Nursing Assistant
% of Days 100%
19 Licensed Practical Nurse
% of Days 100%
4 RN Director of Nursing
% of Days 70%
6 Registered Nurse
% of Days 90%
2 Other Dietary Services Staff
% of Days 100%
2 Clinical Nurse Specialist
% of Days 70%
1 Administrator
% of Days 70%
1 Dental Services Staff
% of Days 70%
1 Nurse Practitioner
% of Days 66%
1 Dietitian
% of Days 65%
2 Physical Therapy Aide
% of Days 26%
3 Occupational Therapy Aide
% of Days 30%
4 Speech Language Pathologist
% of Days 33%
2 Physical Therapy Assistant
% of Days 22%
6 Qualified Social Worker
% of Days 22%
2 Respiratory Therapy Technician
% of Days 15%
2 Occupational Therapy Assistant
% of Days 4%
1 Medical Director
% of Days 16%

Penalties and fines

Federal penalties imposed by CMS for regulatory violations, including civil money penalties (fines) and denials of payment for new Medicare/Medicaid admissions.

Source: CMS Penalties Database (Data as of Jan 2026)

Total fines amount $25K Rank #1 / 145Federal fines — State benchmarkedThis home is ranked 1st out of 145 homes in Michigan. Shows this facility's cumulative CMS federal fine dollars versus the Michigan average among facilities with fines, and where it ranks among 145 facilities in the pool. Lower total dollars mean a better rank.Rankings are based only on facilities in Michigan that report data for that category. Facilities without available data are excluded from the ranking.Click the rank badge to see the full State ranking.Click here to see the full State ranking.
67% lower than Michigan average

Michigan average: $76K

Number of fines 2
In line with Michigan average

Michigan average: 2.0

Payment Denials Info Serious action where Medicare and/or Medicaid temporarily stops payments for new residents until issues are fixed. 0
100% fewer payment denials than Michigan average

Michigan average: 0.8

Fines amount comparison
This facility $25K
Michigan average $76K

No penalties in the past 3 years

No civil money penalties or payment denials were reported in the last 3 years.

Quality of care over time

These measures show how residents usually do over time at this home, based on health outcomes and preventive care.

High-risk clinical events score Info A composite score based on pressure ulcers, falls with injury, weight loss, walking ability decline, and activities of daily living decline. 6.6
22% better than Michigan average

Michigan average: 8.4

Functional decline score Info A composite score based on activities of daily living decline, walking ability decline, and incontinence. 11.9
27% better than Michigan average

Michigan average: 16.3

Long-stay resident measures
Need for Help with Daily Activities Increased Info Percent of long-stay residents whose need for help with daily activities has increased 7.4%
41% better than Michigan average

Michigan average: 12.5%

Walking Ability Worsened Info Percent of long-stay residents whose ability to move independently worsened 14.5%
6% better than Michigan average

Michigan average: 15.3%

Low Risk Residents with Bowel/Bladder Incontinence Info Percent of low risk long-stay residents who lose control of their bowels or bladder 13.8%
34% better than Michigan average

Michigan average: 21.0%

Falls with Major Injury Info Percent of long-stay residents experiencing one or more falls with major injury 2.4%
24% better than Michigan average

Michigan average: 3.2%

High Risk Residents with Pressure Ulcers Info Percent of long-stay high risk residents with pressure ulcers 3.4%
40% better than Michigan average

Michigan average: 5.7%

Urinary Tract Infection Info Percent of long-stay residents with a urinary tract infection 1.1%
38% better than Michigan average

Michigan average: 1.7%

Lost Too Much Weight Info Percent of long-stay residents who lose too much weight 5.0%
11% better than Michigan average

Michigan average: 5.7%

Depressive Symptoms Info Percent of long-stay residents who have depressive symptoms 0.8%
81% better than Michigan average

Michigan average: 3.9%

Antipsychotic Use Info Percent of long-stay residents who received an antipsychotic medication 16.7%
12% worse than Michigan average

Michigan average: 15.0%

Pneumococcal Vaccine Info Percent of long-stay residents assessed and appropriately given the pneumococcal vaccine 97.3%
In line with Michigan average

Michigan average: 94.9%

Influenza Vaccine Info Percent of long-stay residents assessed and appropriately given the seasonal influenza vaccine 98.7%
In line with Michigan average

Michigan average: 95.0%

Short-stay resident measures
Pneumococcal Vaccine Info Percent of short-stay residents assessed and appropriately given the pneumococcal vaccine 55.8%
32% worse than Michigan average

Michigan average: 82.5%

Antipsychotic medication increase Info Percent of short-stay residents who newly received an antipsychotic medication 0.0%
100% better than Michigan average

Michigan average: 1.4%

Influenza Vaccine Info Percent of short-stay residents assessed and appropriately given the seasonal influenza vaccine 71.4%
10% worse than Michigan average

Michigan average: 79.5%

Breakdown by payment type

Medicare

22% of new residents, usually for short-term rehab.

Typical stay 1 months

Private pay

52% of new residents, often for short stays.

Typical stay 2 - 3 months

Medicaid

26% of new residents, often for long-term daily care.

Typical stay 1 - 2 years

Facility Characteristics

Source: CMS Long-Term Care Facility Characteristics (Data as of Jan 2026)

Total residents 74
Medicare
3
4.1% of residents
Medicaid
66
89.2% of residents
Private pay or other
5
6.8% of residents
Programs & Services
Residents Group

Residents meet regularly to discuss policies, care quality, and activities

Active Resident Council

Organized group of residents that meets regularly to discuss facility policies, quality of life, and activities.

Finances and operations

Based on CMS SNF Cost Report for fiscal year ending in 12/2023.

For-profit
Corporation
Net patient revenue Info Net patient revenue — what the home actually collects for resident care, after contractual allowances, bad debt and discounts are subtracted from its gross charges (CMS cost report, Worksheet G-3). It covers resident care only; money the home earns from other sources is shown separately as "Other income."
$9.6M
Net patient income Info Net patient income: net patient revenue minus the home's total operating expenses. A positive figure means it earns more from resident care than it spends to deliver it; a negative figure means the opposite. It excludes non-operating "other income."
-$2.7M
For-profit Corporation
Net patient revenue Info Net patient revenue — what the home actually collects for resident care, after contractual allowances, bad debt and discounts are subtracted from its gross charges (CMS cost report, Worksheet G-3). It covers resident care only; money the home earns from other sources is shown separately as "Other income."
$9.6M Rank #52 / 143Revenue — State benchmarkedThis home is ranked 52nd out of 143 homes in Michigan. Shows this facility's annual revenue compared to the Michigan average. Higher revenue generally means more resources for staffing and capital — read alongside Payroll %.Rankings are based only on facilities in Michigan that report data for that category. Facilities without available data are excluded from the ranking.Click the rank badge to see the full State ranking.Click here to see the full State ranking.
Net patient income Info Net patient income: net patient revenue minus the home's total operating expenses. A positive figure means it earns more from resident care than it spends to deliver it; a negative figure means the opposite. It excludes non-operating "other income."
-$2.7M
Other income Info Money the home earns outside of resident care — such as investments, grants, rentals and other non-operating sources (CMS cost report, Worksheet G-3). It is tracked separately from net patient revenue: it is not part of that figure, and it is not included in net patient income.
$1.2M
Payroll costs Info Staff salaries plus wage-related costs — benefits such as payroll taxes, health insurance and retirement — from the home's own accounting records (CMS cost report, Worksheet A). Contract or agency labor is counted separately, under other operating costs. Rank #62 / 143Payroll — State benchmarkedThis home is ranked 62nd out of 143 homes in Michigan. Shows total annual staff payroll benchmarked to the Michigan average. Higher payroll investment relative to peers often signals better staffing and less reliance on cheaper contract labor.Rankings are based only on facilities in Michigan that report data for that category. Facilities without available data are excluded from the ranking.Click the rank badge to see the full State ranking.Click here to see the full State ranking.
$6.8M 71.1% of net patient revenue Info Payroll as a share of revenue: staff salaries and wage-related benefits divided by net patient revenue. A higher figure means more of each revenue dollar goes to staff pay. Rank #107 / 143Payroll % — State benchmarkedThis home is ranked 107th out of 143 homes in Michigan. Shows payroll as a percentage of revenue versus the Michigan average. Well-run Michigan facilities typically land around 49–59% — the top third Statewide. Below 25% may signal understaffing or heavy agency use — read with Staffing ratings.Rankings are based only on facilities in Michigan that report data for that category. Facilities without available data are excluded from the ranking.Click the rank badge to see the full State ranking.Click here to see the full State ranking.
Other operating costs Info Everything it costs to run the home apart from payroll — food, utilities, supplies, maintenance, contract labor and administration. Calculated as total operating expense minus payroll (staff salaries and wage-related benefits).
$5.4M
Total costs Info The home's total operating expense for the year — all the costs of running it, salaries included (CMS cost report, Worksheet G-3).
$12.3M

What does this home offer?

Pets allowed icon
Pets allowed icon

Pets Allowed

Room sizes icon
Room sizes icon

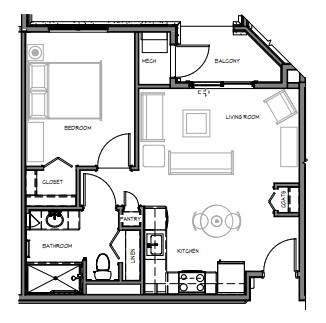
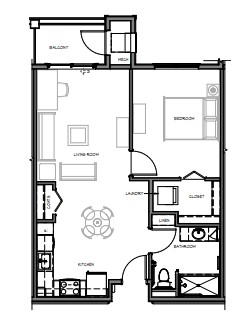
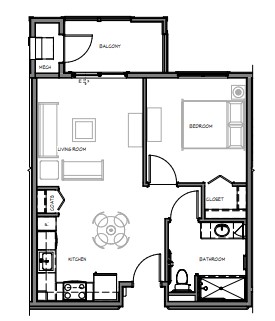
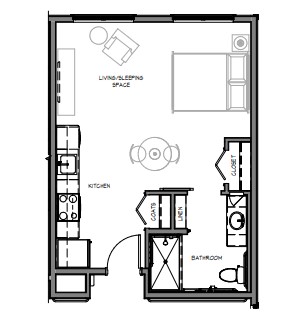
Room Sizes: 301-321 / 371 / 381-410 / 380-395 / 518-567 /546-561 / 608 / 653 / 666 / 790-799 / 806 / 821 / 1,011 / 1,219

Housing options icon

Housing Options: Studio / 1 Bed / 2 Bed

Building type icon
Building type icon

Building Type: 3-story

Who this home usually serves

TYPE OF STAY

Mostly long-term care residents

Most residents stay for extended periods and receive ongoing daily care.

Most new residents arrive under private pay (52% of admissions), and a typical private pay stay runs around 2 - 3 months.

Admissions
249 total

Coverage residents most often arrive under.

Medicare 22%
Private pay 52%
Medicaid 26%
Discharges
254 total

Coverage residents most often leave under.

Medicare 16%
Private pay 42%
Medicaid 42%

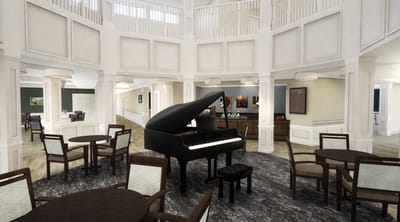
Living Spaces & Floor Plans for StoryPoint Clinton Township

Storypoint Clinton Township3
Storypoint Clinton Township2
Storypoint Clinton Township1
Storypoint Clinton Township

Places of interest near StoryPoint Clinton Township

Address 4.7 miles from city center Info Estimated distance in miles from Clinton Twp's city center to StoryPoint Clinton Township's address, calculated via Google Maps.

Calculate Travel Distance to StoryPoint Clinton Township

Add your location

Address

Compare Nursing Homes around Clinton

The information below is reported by the Michigan Department of Licensing and Regulatory Affairs (LARA).

2 facilities compared · CMS & MI Dept. of Health data

StoryPoint Clinton Township
NH
AL
IL
MC
Clinton Twp
69
Facility 69
MI AVG 75
Rank #224 / 435
33.3%
Facility 33.3%
MI AVG 75.8%
Rank #298 / 395
-56%
3.56
Facility 3.56
MI AVG 4.30
Rank #117 / 142
-37%-17%
$0
Facility $0
MI AVG $87.6k
Rank #1 / 145
41
Facility 41
MI AVG 33.5
Rank #97 / 144
5.9
Facility 5.9
MI AVG 5.2
Rank #91 / 144
123A+
42
Facility 42
MI AVG 39
Rank #300 / 703
David Duffy
$9.6M
Facility $9.6M
MI AVG $15.8M
Rank #52 / 143
$6.8M
Facility $6.8M
MI AVG $5.6M
Rank #62 / 143
71.1%
Facility 71.1%
MI AVG 39%
Rank #107 / 143
235405
Church of Christ Care Community
NH
AL
HC
IL
MC
NC
RC
Clinton Township
129
Facility 129
MI AVG 75
Rank #60 / 435
72.2%
Facility 72.2%
MI AVG 75.8%
Rank #112 / 395
-5%
3.93
Facility 3.93
MI AVG 4.30
Rank #77 / 142
-45%-9%
$50.3k
Facility $50.3k
MI AVG $87.6k
Rank #111 / 145
27
Facility 27
MI AVG 33.5
Rank #66 / 144
4.5
Facility 4.5
MI AVG 5.2
Rank #59 / 144
3109-
33
Facility 33
MI AVG 39
Rank #404 / 703
Debra Arnett
$10.8M
Facility $10.8M
MI AVG $15.8M
Rank #94 / 143
$6.9M
Facility $6.9M
MI AVG $5.6M
Rank #59 / 143
63.7%
Facility 63.7%
MI AVG 39%
Rank #21 / 143
235619

Financial Assistance for
Nursing Home in Michigan

StoryPoint Clinton Township is located in Clinton Twp, Michigan.
Here are the financial assistance programs available to residents in Michigan.

Get Financial aid guidance

MI Choice Waiver

Michigan Medicaid MI Choice Waiver

Age 65+ or disabled
General Michigan resident, Medicaid- eligible, nursing home-level care need.
Income Limits (2025) ~$2,829/month 300% FBR, individual
Asset Limits $2,000 (individual), $3,000 (couple).
MI

Delivered through regional waiver agents; waitlists possible.

Benefits
Personal care (5-7 hours/day) Respite care (240 hours/year) Home modifications ($1,500 avg.) Adult day care ($65/day)

Home Help Program

Michigan Home Help

Age 65+ or disabled
General Michigan resident, Medicaid- eligible or low-income.
Income Limits ~$1,732/month individual, Medicaid threshold
Asset Limits $2,000 individual
MI

Can hire family caregivers; less intensive than waiver.

Benefits
Personal care (up to 60 hours/month) Homemaker services Respite (varies)

Program of All-Inclusive Care for the Elderly (PACE)

Michigan PACE

Age 55+
General Michigan resident, nursing home-level care need, safe with PACE support.
Income Limits (2025) ~$2,829/month (Medicaid-eligible); private pay option available.
Asset Limits $2,000 (individual), $3,000 (couple).
MI

16 PACE centers (e.g., Ingham, Wayne counties); expanding slowly.

Benefits
Personal care (5-7 hours/day) Medical care Meals Transportation Therapy Respite

Medicare Savings Program (MSP)

Michigan Medicare Savings Program

Age 65+ or disabled
General Michigan resident, Medicare Part A/B.
Income Limits (2025) ~$2,510/month (QMB), ~$3,380/month (SLMB), ~$3,598/month (QI)—individual.
Asset Limits $9,430 (individual), $14,130 (couple).
MI

Three tiers; no waitlist; includes Extra Help for Part D.

Benefits
Covers Part B premiums ($174.70/month) Deductibles ($240/year) Copays (~20%)

National Family Caregiver Support Program (NFCSP) Respite

Michigan NFCSP Respite Care

Age
General Caregivers of 60+ needing care or 55+ caregivers of others; Michigan resident; functional needs (2+ ADLs).
Income Limits (2025) Prioritizes ~$24,980/year (individual); no strict cap.
Asset Limits Not assessed; need-based.
MI

16 AAAs; prioritizes low-income, rural caregivers.

Benefits
Respite (4-6 hours/week or 5 days/year) Adult day care ($60/day) Caregiver training

VA Aid and Attendance (A&A) and Housebound Benefits

Michigan VA Aid and Attendance/Housebound

Age 65+ or disabled veteran/spouse
General Michigan resident, wartime service, need for ADL help (A&A) or homebound.
Income Limits (2025) Net income < ~$1,984/month (veteran with dependent, A&A); pension offsets income.
Asset Limits ~$155,356 net worth limit
MI

High veteran demand in urban/rural areas.

Benefits
Cash (~$1,433-$2,642/month veteran, ~$951-$1,318 spouse) for care costs

Frequently Asked Questions about StoryPoint Clinton Township

Who is the owner of StoryPoint Clinton Township?

The legal owner and operator of StoryPoint Clinton Township is Clinton Care Sublessee LLC.

Is StoryPoint Clinton Township in a walkable area?

StoryPoint Clinton Township has a walk score of 42. Somewhat walkable. A few nearby services may be reachable on foot, but most trips require transportation.

What is the license number of StoryPoint Clinton Township?

According to MI state health department records, StoryPoint Clinton Township's license number is AH500411978.

When does StoryPoint Clinton Township's license expire?

According to MI state health department records, StoryPoint Clinton Township's license expires on July 31, 2027.

What is the occupancy rate at StoryPoint Clinton Township?

StoryPoint Clinton Township's occupancy is 33%.

Does StoryPoint Clinton Township operate as a for-profit or non-profit?

StoryPoint Clinton Township is registered as a for-profit in MI.

How many beds does StoryPoint Clinton Township have?

StoryPoint Clinton Township has 69 beds.

Guides for Better Senior Living

Care Cost Calculator: See Prices in Your Area

Nursing Home Data Explorer

Don’t Wait Too Long: 7 Red Flag Signs Your Parent Needs Assisted Living Now

The True Cost of Assisted Living in 2025 – And How Families Are Paying For It

Understanding Senior Living Costs: Pricing Models, Discounts & Financial Assistance