Sunrise Manor
Nursing Home & Respite Care · Amelia, OH
CMS overall rating Info CMS (the Centers for Medicare & Medicaid Services) is the federal agency that rates nursing home quality. Its Overall Rating runs from 1 to 5 stars, combining health inspections, staffing, and quality measures, with inspections weighted most heavily.

Sunrise Manor

Nursing Home & Respite Care · Amelia, OH
CMS overall rating Info CMS (the Centers for Medicare & Medicaid Services) is the federal agency that rates nursing home quality. Its Overall Rating runs from 1 to 5 stars, combining health inspections, staffing, and quality measures, with inspections weighted most heavily.
Calculator: See prices in your area
Sunrise Manor accepts Medicare, Medicaid, and private pay.

Overview of Sunrise Manor

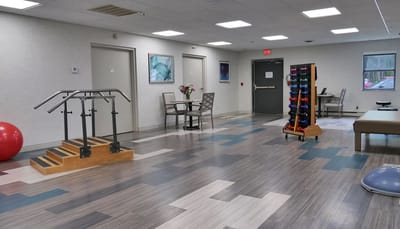
Discover focused attention and exceptional care at Sunrise Manor, a state-of-the-art senior care provider in Amelia, OH, offering short-term care, long-term care and respite stays. The community provides a safe and supportive environment where individuals can focus on their recovery with state-of-the-art rehabilitation equipment and an experienced team of nurses, therapists, and care professionals. Accommodations are carefully curated to provide a comfortable and pleasant environment for recovery.

Enhancing residents’ comfort and convenience, the community also offers a range of services, such as assistance with activities of daily living, medication management, personalized dietary plans, and access to social and recreational activities. Amenities like on-site beauty salon, religious services, beautiful outdoor areas, and weekly recreations, further enhances residents’ recovery experience. At Sunrise Manor, they provide the care and encouragement seniors need to live a fulfilling and enriched life.

Quality ratings

Measured by Centers for Medicare & Medicaid Services (CMS)

Overall rating Info The Overall CMS Rating combines results from health inspections, staffing levels and quality measures. Health inspections carry the most weight. Staffing and quality scores can increase or decrease the final rating based on performance compared to state and national standards.
▲ 25.7% Above OH avg. ▲ 25.7% Above OH avg.OH average: 3.2Click the badge to see the full State ranking.Click here to see the full State ranking.
Health Inspection Info Based on the results of the facility's three most recent standard inspections and any complaint investigations. CMS reviews the number, scope, and severity of deficiencies, with more recent findings weighted more heavily.
▲ 42.8% Above OH avg. ▲ 42.8% Above OH avg.OH average: 2.8Click the badge to see the full State ranking.Click here to see the full State ranking.
Staffing Info Measures average nursing staff hours per resident per day, including Registered Nurses (RNs) and total nursing staff. Ratings are adjusted based on the level of care residents require and are compared to state and national benchmarks.
▼ 18.1% Below OH avg. ▼ 18.1% Below OH avg.OH average: 2.4Click the badge to see the full State ranking.Click here to see the full State ranking.
Quality Measures Info Based on clinical and physical health indicators reported to CMS, such as hospital readmissions, falls, pressure ulcers, and improvements in mobility. These measures reflect how well residents' health needs are being managed.
▼ 8.2% Below OH avg. ▼ 8.2% Below OH avg.OH average: 4.4Click the badge to see the full State ranking.Click here to see the full State ranking.

Staffing hours breakdown

Info Daily nursing hours per resident by staff type, reported to CMS. Higher is generally better — compare this facility to state and national averages to see where staffing stands.

Hours per resident per day — compared to Ohio state averages

Total nursing care / resident Info This home is ranked 60th out of 210 homes in Ohio for nurse hours. Total adjusted nursing hours per resident per day, combining RN, LPN, and aide time. CMS adjusts this for case-mix so facilities can be fairly compared.
3h 47m per day
Rank #60 / 210Nurse hours — State benchmarkedThis home is ranked 60th out of 210 homes in Ohio. Shows adjusted nurse hours per resident per day benchmarked to the Ohio average, with a ranking across 210 Ohio facilities. More hours mean more direct care. The national average is about 3.5 hrs; below 3.0 is a red flag.Rankings are based only on facilities in Ohio that report data for that category. Facilities without available data are excluded from the ranking.Click the rank badge to see the full State ranking.Click here to see the full State ranking.
This facility Ohio avg (3h 32m per day)
vs Ohio avg
+7%

2 of 6 metrics below state avg

Standout metric Weekend RN is +70% above state avg
Staff typeHours / Day / Residentvs state avg
Registered Nurse (RN) Info RNs hold the highest nursing license and can assess residents, interpret test results, and direct care plans. More RN hours per day often signals stronger clinical oversight and faster response to health changes. 1h 0m per day ▲ 58% State avg: 38m per day · National avg: 41m per day
LPN / LVN Info Licensed Practical Nurses (LPNs) or Licensed Vocational Nurses (LVNs) deliver routine hands-on care — medication administration, wound dressing, and monitoring vital signs. They work under RN supervision and make up a large share of daily bedside care. 1h 7m per day ▲ 15% State avg: 58m per day · National avg: 52m per day
Nurse Aide Info Certified Nurse Aides (CNAs) provide the most direct day-to-day assistance: bathing, dressing, feeding, and mobility. Nurse aide hours are typically the largest staffing category and directly affect residents' quality of life. 1h 45m per day ▼ 18% State avg: 2h 8m per day · National avg: 2h 21m per day
Weekend Total Nursing Info Combined nursing hours (RN + LPN + Nurse Aide) per resident per day on weekends. Staffing often drops on weekends — this figure reveals whether the facility maintains adequate coverage outside of weekday hours. 3h 26m per day ▲ 5% State avg: 3h 17m per day · National avg: 3h 26m per day
Physical Therapist Info Hours per resident per day provided by licensed Physical Therapists (PTs) or PT Assistants. PT services help residents recover mobility after injury or illness and are especially important for post-acute (short-stay) rehabilitation. 3m per day ▼ 7% State avg: 3m per day · National avg: 4m per day
Weekend RN Info Registered nurse hours specifically on weekends. Facilities sometimes reduce RN presence on Saturdays and Sundays — a low weekend RN figure compared to weekday hours can indicate reduced clinical oversight when most administrative staff are absent. 42m per day ▲ 70% State avg: 25m per day · National avg: 29m per day

Capacity and availability

This home usually has availability

Lower occupancy than the Ohio average: 78.7%
Occupancy rate
63.2% Rank #184 / 211Occupancy rate — State benchmarkedThis home is ranked 184th out of 211 homes in Ohio. Shows this facility's occupancy rate versus the Ohio average, with its Statewide rank out of 211. Higher occupancy signals strong local demand and financial stability.Rankings are based only on facilities in Ohio that report data for that category. Facilities without available data are excluded from the ranking.Click the rank badge to see the full State ranking.Click here to see the full State ranking.
Avg. Length of Stay
83 days
Bed community size
78-bed community Rank #154 / 323Bed count — State benchmarkedThis home is ranked 154th out of 323 homes in Ohio. Shows this facility's certified or reported bed count compared to other Ohio facilities. Larger communities may offer more amenities, programs, and on-site services for residents and families.Rankings are based only on facilities in Ohio that report data for that category. Facilities without available data are excluded from the ranking.Click the rank badge to see the full State ranking.Click here to see the full State ranking.
A larger shared setting that may offer more common spaces and organized community services.
Walk Score
Walk Score: 32 / 100 Rank #427 / 705Walk Score — State benchmarkedThis home is ranked 427th out of 705 homes in Ohio. Shows how walkable this facility's neighborhood is compared to the average Walk Score across Ohio facilities. Higher scores benefit residents, families, and staff.Rankings are based only on facilities in Ohio that report data for that category. Facilities without available data are excluded from the ranking.Click the rank badge to see the full State ranking.Click here to see the full State ranking.
Somewhat walkable. A few nearby services may be reachable on foot, but most trips require transportation.

About this community

Awards

Best Nursing Home of the Year award in Adams
Brown
Clermont Counties.

Therapy & Rehabilitation

3 services
Rehabilitation Services
Respite Care
Short-Term Rehab

Staffing & Medical

1 service
24-Hour Staffing

Additional Services

1 service
Short-Term Rehabilitation

Amenities & Lifestyle

Gourmet Meals
On-Site Beauty Salon
Updated Suites And Lounges
Outdoor Seating Areas
Weekly Outings
Religious Services
Socials And Meet Ups
ActivitiesComprehensive activity schedule available
Specific ProgramsVentilator Unit
Religious Services

Contact Sunrise Manor

Staffing Data

Reporting period: October 1 – December 31, 2025 (Q4 2025). Source: CMS Payroll-Based Journal report.

Total staff 288
Employees 86
Contractors 202
Staff to resident ratio 7.02 : 1
245% more staff per resident than Ohio average
Ohio average ratio: 2.04 : 1 Ohio average ratio: 2.04 : 1See full Ohio ranking
Avg staff/day 40
Average shift 8.5 hours
5% better than Ohio average
Ohio average: 8.1 hours Ohio average shift: 8.1 hoursSee full Ohio ranking
Total staff hours (quarter) 31,357

Nursing staff breakdown

Q4 2025 · Oct 1 – Dec 31 More info This data comes from the CMS Payroll-Based Journal report covering October 1 – December 31, 2025.
Registered Nurse

Manages medical care and health needs.

RN Staff Info 18 total: 14 full-time employees and 4 contractors. 18
Average shift length Info Average shift length. Calculated as total hours divided by days worked and average staff per day. 9.1 hours
Licensed Practical Nurse

Assists with medical care and medications.

LPN Staff Info 69 total: 18 full-time employees and 51 contractors. 69
Average shift length Info Average shift length. Calculated as total hours divided by days worked and average staff per day. 8.9 hours
Certified Nursing Assistant

Helps with daily care and mobility.

CNA Staff Info 153 total: 31 full-time employees and 122 contractors. 153
Average shift length Info Average shift length. Calculated as total hours divided by days worked and average staff per day. 9.4 hours

Contractor staffing

Q4 2025 · Oct 1 – Dec 31 More info This data comes from the CMS Payroll-Based Journal report covering October 1 – December 31, 2025.

Total hours from contractors

26.7%

8,375 contractor hours this quarter

Certified Nursing Assistant: 122 Licensed Practical Nurse: 51 Physical Therapy Aide: 5 Registered Nurse: 4 Speech Language Pathologist: 3 Qualified Social Worker: 3 Occupational Therapy Aide: 3 Feeding Assistant: 2 Occupational Therapy Assistant: 2 Physical Therapy Assistant: 2 Medical Director: 2 Clinical Nurse Specialist: 1 Diagnostic X-ray Services Staff: 1 Respiratory Therapy Technician: 1

Staff by category

Q4 2025 · Oct 1 – Dec 31 More info This data comes from the CMS Payroll-Based Journal report covering October 1 – December 31, 2025.
Certified Nursing Assistant3112215311,10592100%9.4
Licensed Practical Nurse1851696,58192100%8.9
Registered Nurse144184,58092100%9.1
Qualified Activities Professional130132,52492100%8.7
Clinical Nurse Specialist3141,3017986%7.3
Physical Therapy Aide0557487683%6.7
Nurse Practitioner1015046368%8
Dietitian1014916571%7.6
RN Director of Nursing1014876267%7.9
Other Dietary Services Staff1014876672%7.4
Mental Health Service Worker1014756166%7.8
Administrator1014725964%8
Speech Language Pathologist0334207784%4.7
Qualified Social Worker0333876470%6
Respiratory Therapy Technician0112955155%5.8
Physical Therapy Assistant0221743235%5.4
Occupational Therapy Aide033833942%1.9
Feeding Assistant022771415%3.7
Diagnostic X-ray Services Staff011701415%5
Medical Director022651820%3.6
Occupational Therapy Assistant0222967%4.8
Medication Aide/Technician101411%4
153 Certified Nursing Assistant
% of Days 100%
69 Licensed Practical Nurse
% of Days 100%
18 Registered Nurse
% of Days 100%
13 Qualified Activities Professional
% of Days 100%
4 Clinical Nurse Specialist
% of Days 86%
5 Physical Therapy Aide
% of Days 83%
1 Nurse Practitioner
% of Days 68%
1 Dietitian
% of Days 71%
1 RN Director of Nursing
% of Days 67%
1 Other Dietary Services Staff
% of Days 72%
1 Mental Health Service Worker
% of Days 66%
1 Administrator
% of Days 64%
3 Speech Language Pathologist
% of Days 84%
3 Qualified Social Worker
% of Days 70%
1 Respiratory Therapy Technician
% of Days 55%
2 Physical Therapy Assistant
% of Days 35%
3 Occupational Therapy Aide
% of Days 42%
2 Feeding Assistant
% of Days 15%
1 Diagnostic X-ray Services Staff
% of Days 15%
2 Medical Director
% of Days 20%
2 Occupational Therapy Assistant
% of Days 7%
1 Medication Aide/Technician
% of Days 1%

Penalties and fines

Federal penalties imposed by CMS for regulatory violations, including civil money penalties (fines) and denials of payment for new Medicare/Medicaid admissions.

Source: CMS Penalties Database

No penalties in the past 3 years

No civil money penalties or payment denials were reported in the last 3 years.

Quality of care over time

These measures show how residents usually do over time at this home, based on health outcomes and preventive care.

High-risk clinical events score Info A composite score based on pressure ulcers, falls with injury, weight loss, walking ability decline, and activities of daily living decline. 6.9
18% worse than Ohio average

Ohio average: 5.8

Functional decline score Info A composite score based on activities of daily living decline, walking ability decline, and incontinence. 8.9
30% better than Ohio average

Ohio average: 12.7

Long-stay resident measures
Significantly above average Ohio avg: 4.7 Info CMS star rating based on long-stay quality measure performance. 5 stars = significantly above average, 1 star = significantly below average.
Need for Help with Daily Activities Increased Info Percent of long-stay residents whose need for help with daily activities has increased 5.8%
15% better than Ohio average

Ohio average: 6.8%

Walking Ability Worsened Info Percent of long-stay residents whose ability to move independently worsened 1.3%
85% better than Ohio average

Ohio average: 8.9%

Low Risk Residents with Bowel/Bladder Incontinence Info Percent of low risk long-stay residents who lose control of their bowels or bladder 19.5%
11% better than Ohio average

Ohio average: 22.0%

Falls with Major Injury Info Percent of long-stay residents experiencing one or more falls with major injury 2.8%
18% better than Ohio average

Ohio average: 3.4%

High Risk Residents with Pressure Ulcers Info Percent of long-stay high risk residents with pressure ulcers 8.8%
127% worse than Ohio average

Ohio average: 3.9%

Urinary Tract Infection Info Percent of long-stay residents with a urinary tract infection 0.0%
100% better than Ohio average

Ohio average: 0.5%

Lost Too Much Weight Info Percent of long-stay residents who lose too much weight 15.7%
153% worse than Ohio average

Ohio average: 6.2%

Depressive Symptoms Info Percent of long-stay residents who have depressive symptoms 46.2%
92% worse than Ohio average

Ohio average: 24.0%

Antipsychotic Use Info Percent of long-stay residents who received an antipsychotic medication 9.8%
16% worse than Ohio average

Ohio average: 8.4%

Pneumococcal Vaccine Info Percent of long-stay residents assessed and appropriately given the pneumococcal vaccine 98.6%
7% better than Ohio average

Ohio average: 92.4%

Influenza Vaccine Info Percent of long-stay residents assessed and appropriately given the seasonal influenza vaccine 96.6%
In line with Ohio average

Ohio average: 94.5%

Hospitalizations per 1,000 days Info Number of hospitalizations per 1,000 long-stay resident days. 2.24
27% worse than Ohio average

Ohio average: 1.77

ED visits per 1,000 days Info Number of outpatient emergency department visits per 1,000 long-stay resident days. 1.51
17% better than Ohio average

Ohio average: 1.83

Short-stay resident measures
Below average Ohio avg: 2.4 Info CMS star rating based on short-stay quality measure performance. 5 stars = much above average, 1 star = much below average.
Pneumococcal Vaccine Info Percent of short-stay residents assessed and appropriately given the pneumococcal vaccine 59.1%
24% worse than Ohio average

Ohio average: 78.0%

Antipsychotic medication increase Info Percent of short-stay residents who newly received an antipsychotic medication 2.1%
66% worse than Ohio average

Ohio average: 1.3%

Influenza Vaccine Info Percent of short-stay residents assessed and appropriately given the seasonal influenza vaccine 82.7%
9% better than Ohio average

Ohio average: 75.6%

Re-hospitalized after SNF stay Info Percentage of short-stay residents who were re-hospitalized after their nursing home admission. 13.8%
45% better than Ohio average

Ohio average: 25.1%

Emergency department visits Info Percentage of short-stay residents who had an outpatient emergency department visit. 19.4%
55% worse than Ohio average

Ohio average: 12.5%

Falls with major injury Info Percentage of SNF residents who experience falls with major injury during their stay. 2.7%
251% worse than Ohio average

Ohio average: 0.8%

Ability to care for self at discharge Info Percentage of residents at or above expected ability to care for themselves at discharge. 29.2%
46% worse than Ohio average

Ohio average: 53.7%

Successful return to home or community Info Rate of successful return to home or community from a skilled nursing facility. 48.4%
In line with Ohio average

Ohio average: 50.6%

Breakdown by payment type

Medicare

21% of new residents, usually for short-term rehab.

Typical stay 1 - 2 months

Private pay

61% of new residents, often for short stays.

Typical stay 18 days

Medicaid

18% of new residents, often for long-term daily care.

Typical stay 11 - 12 months

Facility Characteristics

Source: CMS Long-Term Care Facility Characteristics (Data as of Jan 2026)

Total residents 41
Medicare
4
9.8% of residents
Medicaid
29
70.7% of residents
Private pay or other
8
19.5% of residents
Programs & Services
Residents Group

Residents meet regularly to discuss policies, care quality, and activities

Active Resident Council

Organized group of residents that meets regularly to discuss facility policies, quality of life, and activities.

Finances and operations

Based on CMS SNF Cost Report for fiscal year ending in 12/2023.

For-profit
Corporation
Net patient revenue Info Net patient revenue — what the home actually collects for resident care, after contractual allowances, bad debt and discounts are subtracted from its gross charges (CMS cost report, Worksheet G-3). It covers resident care only; money the home earns from other sources is shown separately as "Other income."
$6.3M
Net patient income Info Net patient income: net patient revenue minus the home's total operating expenses. A positive figure means it earns more from resident care than it spends to deliver it; a negative figure means the opposite. It excludes non-operating "other income."
$166.1K
For-profit Corporation
Net patient revenue Info Net patient revenue — what the home actually collects for resident care, after contractual allowances, bad debt and discounts are subtracted from its gross charges (CMS cost report, Worksheet G-3). It covers resident care only; money the home earns from other sources is shown separately as "Other income."
$6.3M Rank #170 / 210Revenue — State benchmarkedThis home is ranked 170th out of 210 homes in Ohio. Shows this facility's annual revenue compared to the Ohio average. Higher revenue generally means more resources for staffing and capital — read alongside Payroll %.Rankings are based only on facilities in Ohio that report data for that category. Facilities without available data are excluded from the ranking.Click the rank badge to see the full State ranking.Click here to see the full State ranking.
Net patient income Info Net patient income: net patient revenue minus the home's total operating expenses. A positive figure means it earns more from resident care than it spends to deliver it; a negative figure means the opposite. It excludes non-operating "other income."
$166.1K
Other income Info Money the home earns outside of resident care — such as investments, grants, rentals and other non-operating sources (CMS cost report, Worksheet G-3). It is tracked separately from net patient revenue: it is not part of that figure, and it is not included in net patient income.
$10.4K
Payroll costs Info Staff salaries plus wage-related costs — benefits such as payroll taxes, health insurance and retirement — from the home's own accounting records (CMS cost report, Worksheet A). Contract or agency labor is counted separately, under other operating costs. Rank #173 / 210Payroll — State benchmarkedThis home is ranked 173rd out of 210 homes in Ohio. Shows total annual staff payroll benchmarked to the Ohio average. Higher payroll investment relative to peers often signals better staffing and less reliance on cheaper contract labor.Rankings are based only on facilities in Ohio that report data for that category. Facilities without available data are excluded from the ranking.Click the rank badge to see the full State ranking.Click here to see the full State ranking.
$2.5M 40.5% of net patient revenue Info Payroll as a share of revenue: staff salaries and wage-related benefits divided by net patient revenue. A higher figure means more of each revenue dollar goes to staff pay. Rank #98 / 210Payroll % — State benchmarkedThis home is ranked 98th out of 210 homes in Ohio. Shows payroll as a percentage of revenue versus the Ohio average. Well-run Ohio facilities typically land around 54–64% — the top third Statewide. Below 25% may signal understaffing or heavy agency use — read with Staffing ratings.Rankings are based only on facilities in Ohio that report data for that category. Facilities without available data are excluded from the ranking.Click the rank badge to see the full State ranking.Click here to see the full State ranking.
Other operating costs Info Everything it costs to run the home apart from payroll — food, utilities, supplies, maintenance, contract labor and administration. Calculated as total operating expense minus payroll (staff salaries and wage-related benefits).
$3.6M
Total costs Info The home's total operating expense for the year — all the costs of running it, salaries included (CMS cost report, Worksheet G-3).
$6.1M

What does this home offer?

Housing options icon

Housing Options: Private Rooms

Building type icon
Building type icon

Building Type: Single-story

Fitness and recreation icon

Fitness and Recreation

Who this home usually serves

TYPE OF STAY

Primarily short stays

Residents typically stay for brief periods, with frequent admissions and discharges throughout the year.

Most new residents arrive under private pay (61% of admissions), and a typical private pay stay runs around 18 days.

Admissions
218 total

Coverage residents most often arrive under.

Medicare 21%
Private pay 61%
Medicaid 18%
Discharges
218 total

Coverage residents most often leave under.

Medicare 22%
Private pay 58%
Medicaid 19%

Places of interest near Sunrise Manor

Address 1.1 miles from city center Info Estimated distance in miles from Amelia's city center to Sunrise Manor's address, calculated via Google Maps.

Calculate Travel Distance to Sunrise Manor

Add your location

Address

Compare Nursing Homes around Cincinnati

The information below is reported by the Ohio Department of Health, Bureau of Survey and Certification.

5 facilities compared · CMS & OH Dept. of Health data

Sunrise Manor
NH
RC
Amelia (State Route 132)
78
Facility 78
OH AVG 78
Rank #154 / 323
63.2%
Facility 63.2%
OH AVG 78.7%
Rank #184 / 211
-20%
3.78
Facility 3.78
OH AVG 3.54
Rank #60 / 210
-32%+7%
$0
Facility $0
OH AVG $74.0k
Rank #1 / 211
38
Facility 38
OH AVG 30.9
Rank #150 / 210
4.8
Facility 4.8
OH AVG 4.6
Rank #142 / 210
-69-
32
Facility 32
OH AVG 40
Rank #427 / 705
-
$6.3M
Facility $6.3M
OH AVG $10.1M
Rank #170 / 210
$2.5M
Facility $2.5M
OH AVG $3.9M
Rank #173 / 210
40.5%
Facility 40.5%
OH AVG 40.2%
Rank #98 / 210
366288
Mount Washington Care Center
NH
Cincinnati (Fruit Hill)
129
Facility 129
OH AVG 78
Rank #33 / 323
54.3%
Facility 54.3%
OH AVG 78.7%
Rank #197 / 211
-31%
3.25
Facility 3.25
OH AVG 3.54
Rank #150 / 210
+75%-8%
$0
Facility $0
OH AVG $74.0k
Rank #1 / 211
39
Facility 39
OH AVG 30.9
Rank #156 / 210
4.9
Facility 4.9
OH AVG 4.6
Rank #147 / 210
169A+
32
Facility 32
OH AVG 40
Rank #427 / 705
Edith Olanoff 2011 Trust Dated 10/21/2011
$8.9M
Facility $8.9M
OH AVG $10.1M
Rank #94 / 210
$5.8M
Facility $5.8M
OH AVG $3.9M
Rank #61 / 210
65.2%
Facility 65.2%
OH AVG 40.2%
Rank #35 / 210
365423
Cottingham Retirement Community
NH
AL
HC
IL
MC
PC
RC
Cincinnati (Sharonville)
128
Facility 128
OH AVG 78
Rank #36 / 323
45.3%
Facility 45.3%
OH AVG 78.7%
Rank #203 / 211
-42%
2.78
Facility 2.78
OH AVG 3.54
Rank #198 / 210
-48%-21%
$0
Facility $0
OH AVG $74.0k
Rank #1 / 211
22
Facility 22
OH AVG 30.9
Rank #80 / 210
3.7
Facility 3.7
OH AVG 4.6
Rank #82 / 210
258A+
53
Facility 53
OH AVG 40
Rank #223 / 705
-
$7.5M
Facility $7.5M
OH AVG $10.1M
Rank #140 / 210
$3.7M
Facility $3.7M
OH AVG $3.9M
Rank #157 / 210
49.3%
Facility 49.3%
OH AVG 40.2%
Rank #148 / 210
365652
Clovernook Health Care LLC
NH
RC
Cincinnati (College Hill)
126
Facility 126
OH AVG 78
Rank #39 / 323
86.1%
Facility 86.1%
OH AVG 78.7%
Rank #98 / 211
+9%
3.55
Facility 3.55
OH AVG 3.54
Rank #99 / 210
-34%0%
$0
Facility $0
OH AVG $74.0k
Rank #1 / 211
38
Facility 38
OH AVG 30.9
Rank #150 / 210
2.5
Facility 2.5
OH AVG 4.6
Rank #27 / 210
1106A+
18
Facility 18
OH AVG 40
Rank #561 / 705
Clovernook Healthcare Holdings LLC
$12.9M
Facility $12.9M
OH AVG $10.1M
Rank #53 / 210
$5.9M
Facility $5.9M
OH AVG $3.9M
Rank #48 / 210
45.8%
Facility 45.8%
OH AVG 40.2%
Rank #105 / 210
365551
Harmony Court Rehab and Nursing
NH
MC
NC
PC
RC
Cincinnati (Bond Hill)
120
Facility 120
OH AVG 78
Rank #49 / 323
89.2%
Facility 89.2%
OH AVG 78.7%
Rank #75 / 211
+13%
3.23
Facility 3.23
OH AVG 3.54
Rank #150 / 210
+50%-9%
$100.9k
Facility $100.9k
OH AVG $74.0k
Rank #190 / 211
86
Facility 86
OH AVG 30.9
Rank #207 / 210
8.6
Facility 8.6
OH AVG 4.6
Rank #204 / 210
1106A+
40
Facility 40
OH AVG 40
Rank #364 / 705
Linda Combs
$11.2M
Facility $11.2M
OH AVG $10.1M
Rank #84 / 210
$5.3M
Facility $5.3M
OH AVG $3.9M
Rank #75 / 210
47.3%
Facility 47.3%
OH AVG 40.2%
Rank #110 / 210
366220

Financial Assistance for
Nursing Home in Ohio

Sunrise Manor is located in Amelia, Ohio.
Here are the financial assistance programs available to residents in Ohio.

Get Financial aid guidance

PASSPORT Waiver

Ohio Medicaid PASSPORT

Age 60+
General Ohio resident, Medicaid-eligible, nursing home-level care need.
Income Limits (2025) ~$2,829/month 300% FBR, individual
Asset Limits $2,000 (individual), $3,000 (couple).
OH

Administered through regional agencies; waitlists possible.

Benefits
Personal care (5-7 hours/day) Respite (240 hours/year) Adult day care ($65/day) Home modifications ($1,500 avg.)

Ohio Home Care Program (non-Medicaid)

OH HCP

Age 60+
General Ohio resident, at risk of decline.
Income Limits ~$2,000/month individual, varies
Asset Limits $5,000 individual
OH

Limited funding; regional variation.

Benefits
In-home care (3-5 hours/week) Respite (up to 10 days/year) Transportation (~5 trips/month)

Assisted Living Waiver (ALW)

Ohio Assisted Living Waiver

Age 21+ (65+ prioritized)
General OH resident, Medicaid-eligible, NFLOC.
Income Limits (2025) ~$2,829/month (individual); QIT required.
Asset Limits $2,000 (individual), $3,000 (couple).
OH

Covers ~300 facilities; room/board not included (separate cost).

Benefits
Personal care Meals Medication management Transportation (~$3,000-$4,000/month value)

Program of All-Inclusive Care for the Elderly (PACE)

Ohio PACE (e.g., McGregor PACE)

Age 55+
General OH resident (specific counties), NFLOC, safe with PACE support.
Income Limits (2025) ~$2,829/month (Medicaid-eligible); private pay option available.
Asset Limits $2,000 (individual), $3,000 (couple) for Medicaid enrollees.
OH

Available in 9 counties (e.g., Cuyahoga, Franklin); expanding via Healthy Aging Grants.

Benefits
Personal care (5-7 hours/day) Medical care Meals Transportation Respite Therapies

Medicare Savings Program (MSP)

Ohio Medicare Savings Program

Age 65+ or disabled
General OH resident, Medicare Part A/B.
Income Limits (2025) ~$2,510/month (QMB), ~$3,380/month (SLMB), ~$3,598/month (QI)—individual.
Asset Limits $9,430 (individual), $14,130 (couple).
OH

Three tiers; includes Extra Help for Part D; no waitlist.

Benefits
Covers Part B premiums ($174.70/month) Deductibles ($240/year) Copays (~20%)

Home Energy Assistance Program (HEAP)

Ohio HEAP

Age 60+ prioritized
General OH resident, low-income household.
Income Limits (2025) ~$3,970/month individual, 185% FPL
Asset Limits Not assessed; income-focused.
OH

Covers gas, electric, oil; emergency aid via Winter/Summer Crisis Programs.

Benefits
Heating/cooling aid ($300-$1,000/season) Emergency aid ($500 max)

Family Caregiver Support Program (FCSP)

Ohio Family Caregiver Support Program

Age
General Caregivers of 60+ needing care or 55+ caregivers of others; OH resident; functional needs (2+ ADLs).
Income Limits (2025) Prioritizes ~$24,980/year (individual); no strict cap.
Asset Limits Not assessed; need-based.
OH

12 AAAs; rural/low-income priority; volunteer respite option.

Benefits
Respite (4-6 hours/week or 5 days/year) Adult day care ($60/day) Training Supplies (~$500/year)

VA Aid and Attendance (A&A) and Housebound Benefits

Ohio VA Aid and Attendance/Housebound

Age 65+ or disabled veteran/spouse
General OH resident, wartime service, need for ADL help (A&A) or homebound.
Income Limits (2025) Net income < ~$1,984/month (veteran with dependent, A&A); pension offsets income.
Asset Limits ~$155,356 net worth limit
OH

High veteran demand; supports care in multiple settings.

Benefits
Cash (~$1,433-$2,642/month veteran, ~$951-$1,318 spouse) for care costs (e.g., in-home, assisted living)

Homestead Exemption

Ohio Homestead Exemption

Age 65+ (or disabled)
General OH resident, homeowner, low-income.
Income Limits (2025) ~$38,500/year individual, adjusted annually
Asset Limits Not assessed; home ownership required.
OH

Reduces taxable value by $25,000; applies to primary residence.

Benefits
Tax reduction (~$400-$800/year avg., varies by county)

Save the Dream Ohio (Homeowner Assistance Fund)

Ohio Save the Dream

Age 60+ prioritized
General OH resident, homeowner, hardship post-Jan 21, 2020.
Income Limits (2025) ~$147,600/year family of 4, 150% AMI; varies by county
Asset Limits Not assessed; hardship-focused.
OH

Covers delinquent mortgages, utilities, taxes; max $25,000 mortgage aid.

Benefits
Mortgage aid ($25,000 max) Utility/property tax aid ($5,000 avg.)

Frequently Asked Questions about Sunrise Manor

What neighborhood is Sunrise Manor in?

Sunrise Manor is in the State Route 132 neighborhood.

Is Sunrise Manor in a walkable area?

Sunrise Manor has a walk score of 32. Somewhat walkable. A few nearby services may be reachable on foot, but most trips require transportation.

What is the occupancy rate at Sunrise Manor?

Sunrise Manor's occupancy is 63.2%.

Does Sunrise Manor operate as a for-profit or non-profit?

Sunrise Manor is registered as a for-profit.

Are there photos of Sunrise Manor?

Yes — there are 5 photos of Sunrise Manor in the photo gallery on this page.

What is the address of Sunrise Manor?

Sunrise Manor is located at 3434 Oh-132, Amelia, OH 45102.

What is the phone number of Sunrise Manor?

(513) 797-5144 will put you in contact with the team at Sunrise Manor.

Guides for Better Senior Living

Care Cost Calculator: See Prices in Your Area

Nursing Home Data Explorer

Don’t Wait Too Long: 7 Red Flag Signs Your Parent Needs Assisted Living Now

The True Cost of Assisted Living in 2025 – And How Families Are Paying For It

Understanding Senior Living Costs: Pricing Models, Discounts & Financial Assistance