Explore Open Rooms

1 Contact details
2 What type of senior care service are you looking for?
3 What budget do you have in mind for senior care?
4 How soon do you need to find care?
5 Additional details

Thank you for your interest!

Our team will be in touch shortly to help with next steps.

Nursing Home in Bradenton

CMS overall rating Info The Overall CMS Rating combines results from health inspections, staffing levels and quality measures. Health inspections carry the most weight. Staffing and quality scores can increase or decrease the final rating based on performance compared to state and national standards.

Surrey Place Healthcare & Rehabilitation

5525 21st Ave W, Bradenton, FL 34209 View map
Overview of Surrey Place Healthcare & Rehabilitation

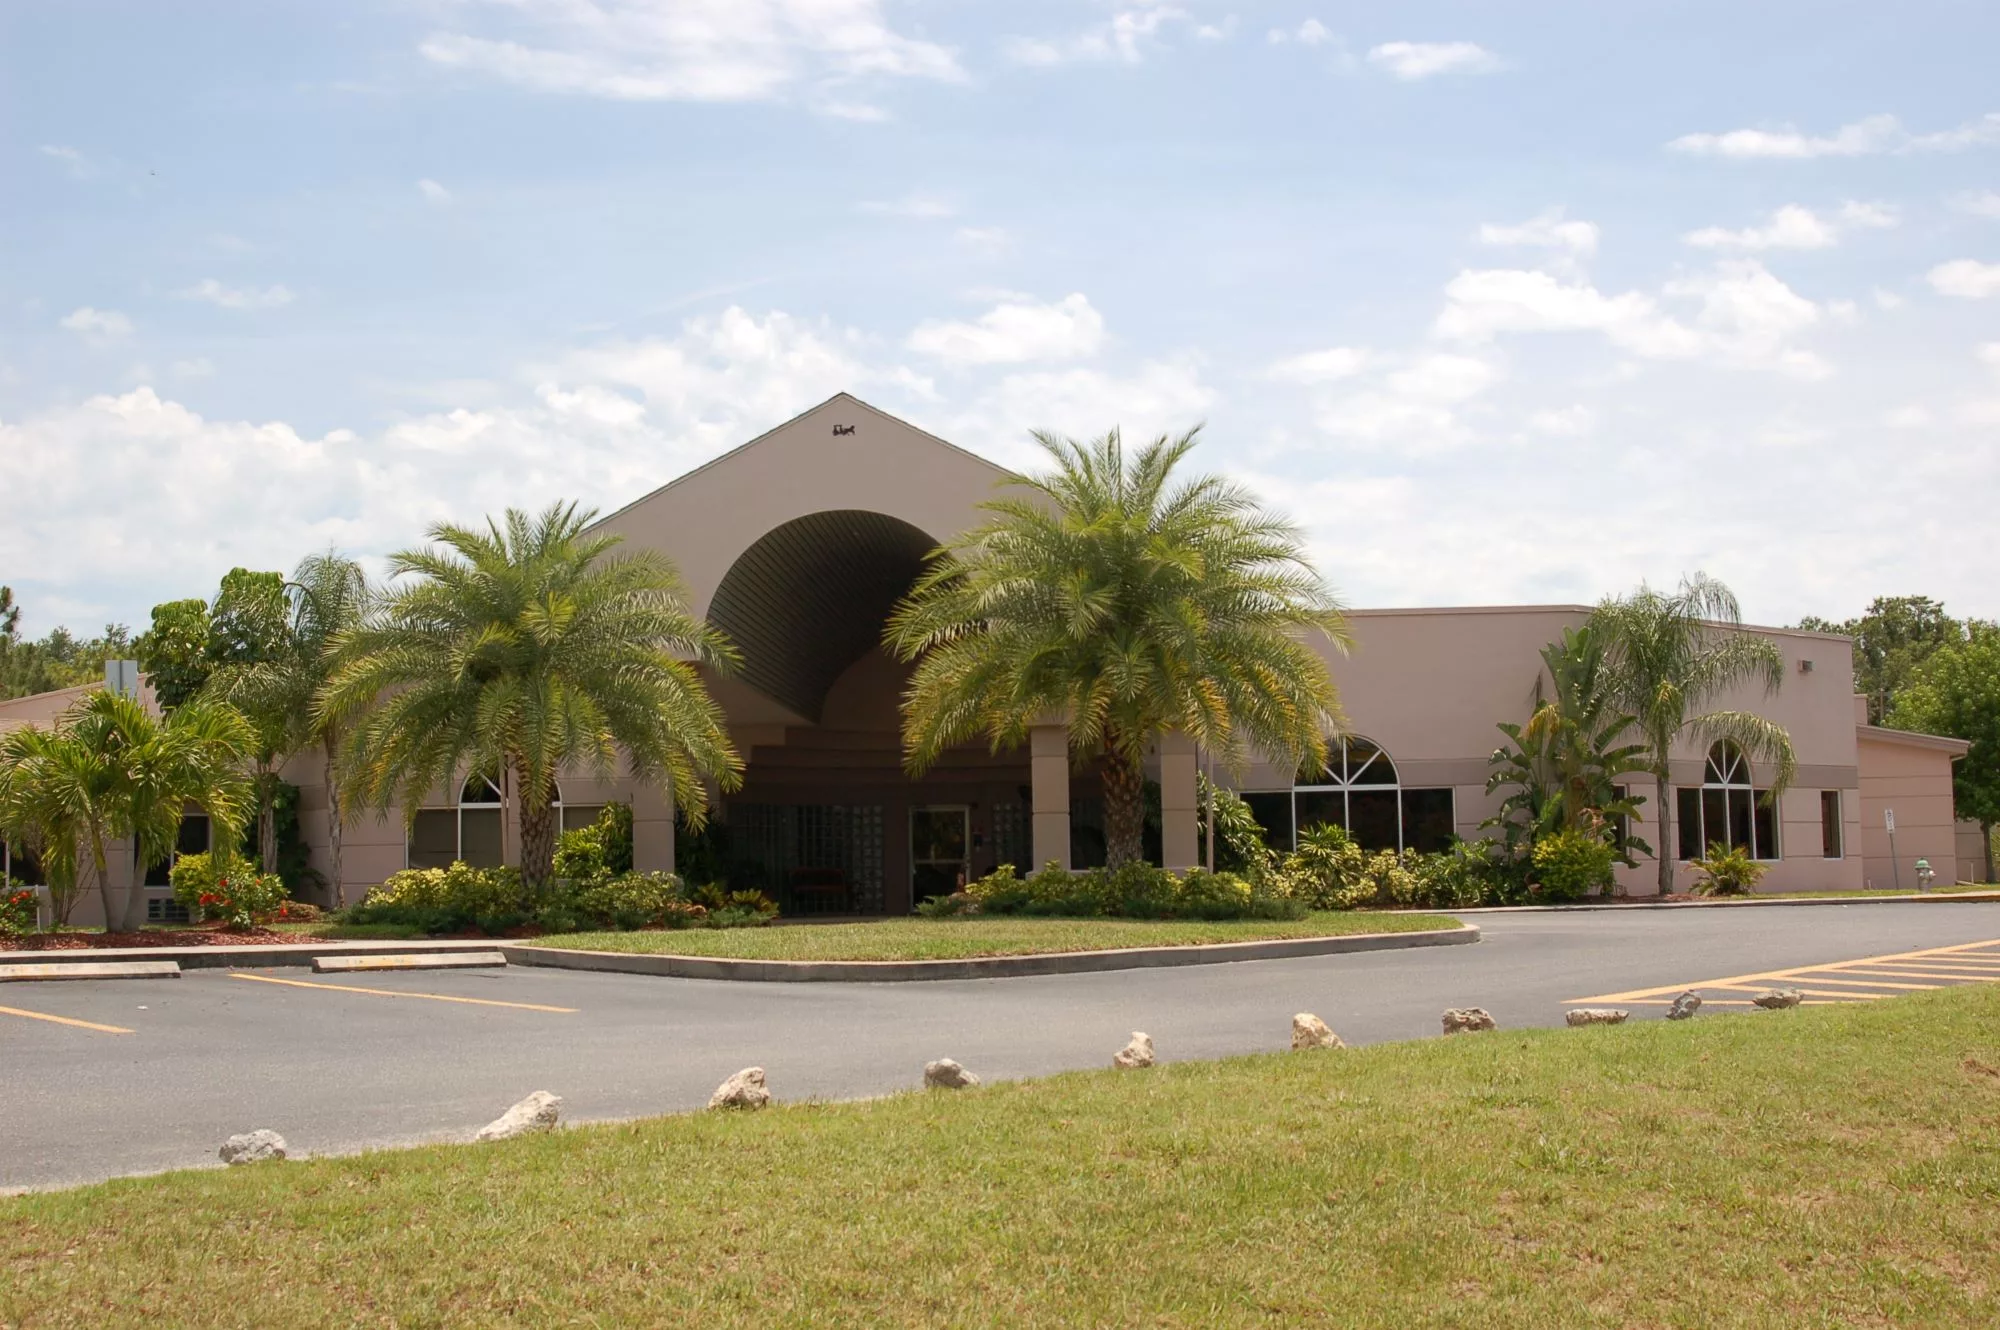
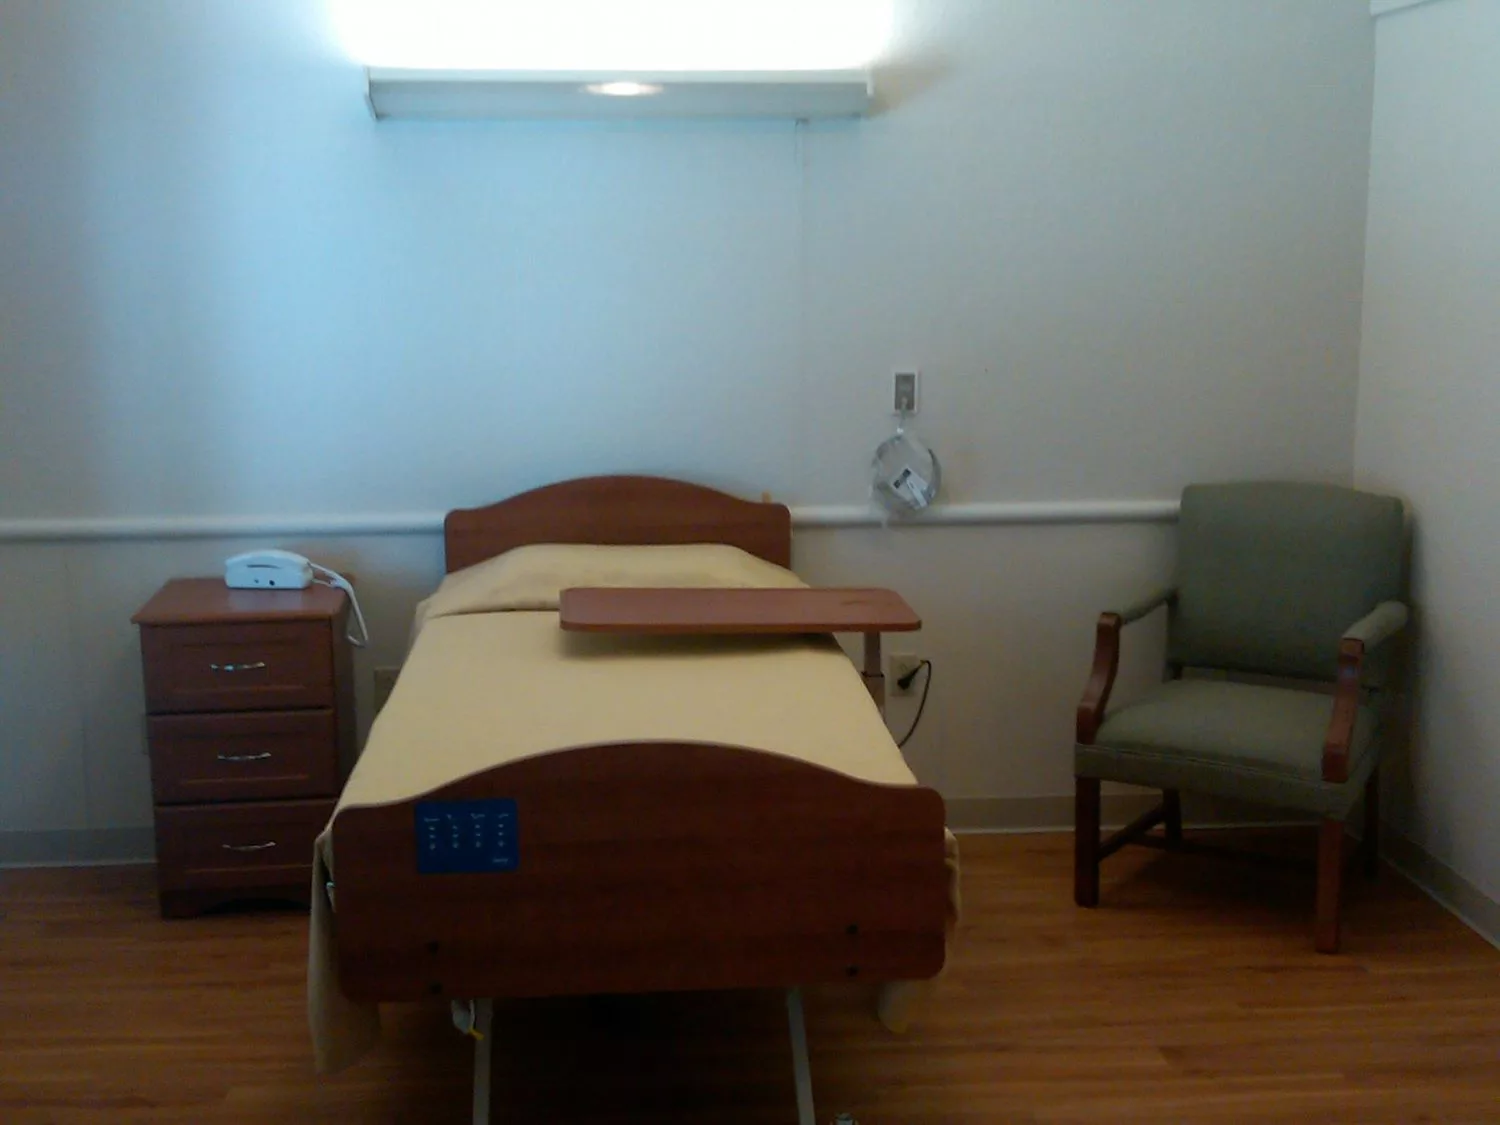
Surrey Place Healthcare & Rehabilitation, nestled in Bradenton, Florida, is more than just a healthcare facility—it’s a haven of top-notch care and rehabilitation. Families can trust its specialized programs, whether for short-term recovery or long-term support, designed to promote the well-being of their loved ones. This nursing home facility takes pride in its 24-hour care staff, ensuring continuous support including specialized services like wound care under physician oversight. From post-surgical recovery to individualized long-term care, Surrey Place offers comprehensive services. Wellness services, including laboratory, podiatry, pharmacy, and dentistry, are seamlessly integrated into their offerings.
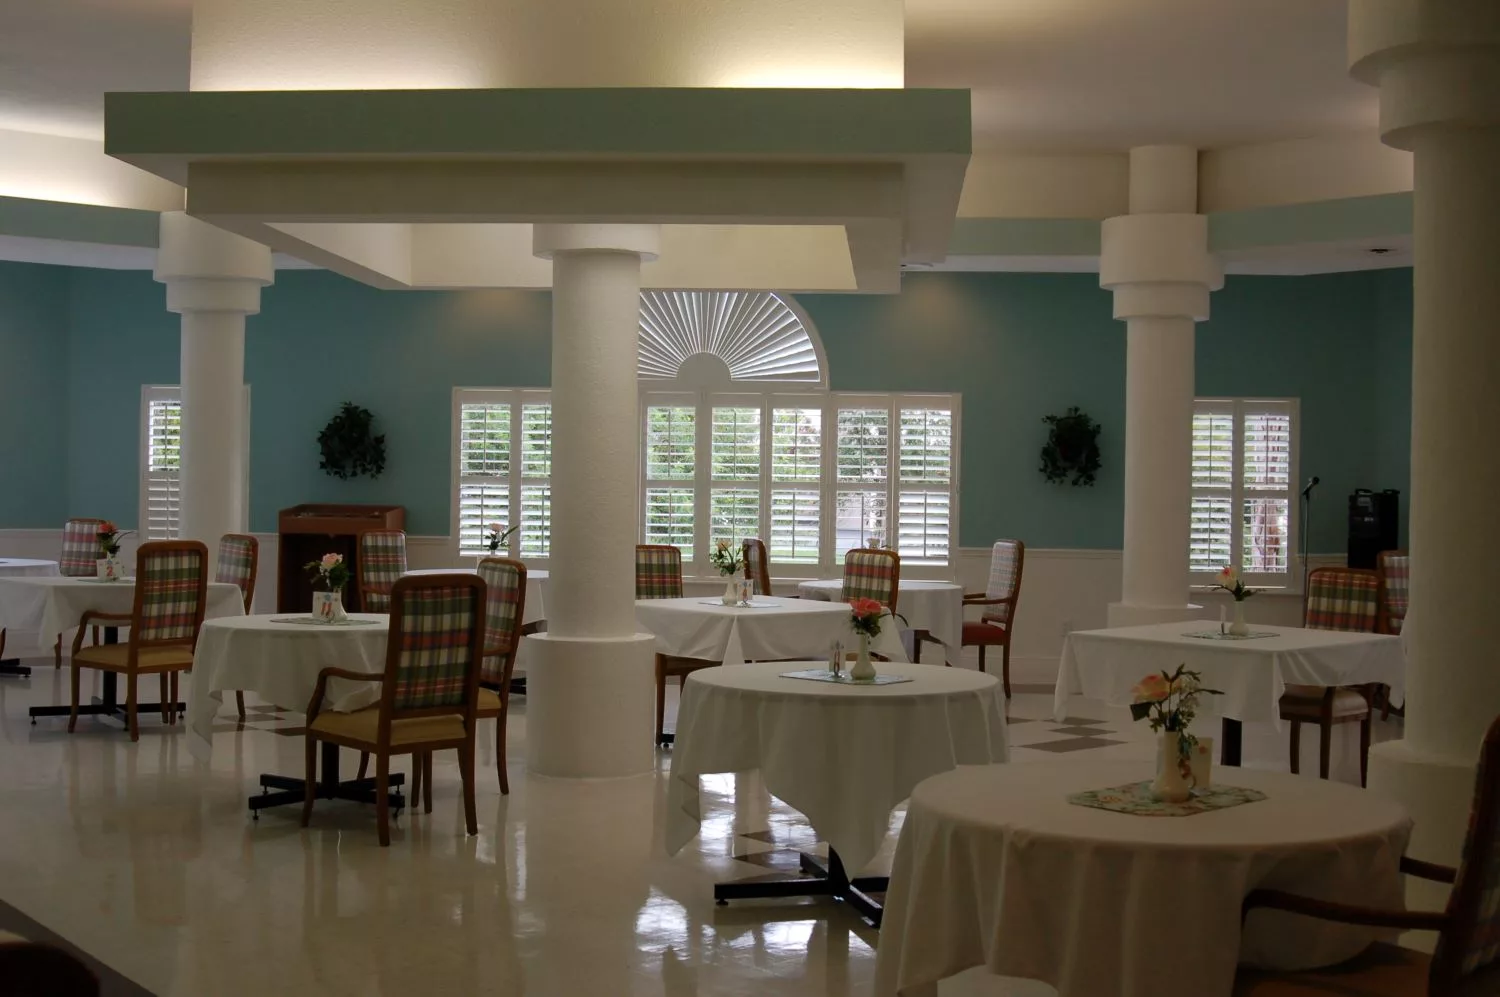
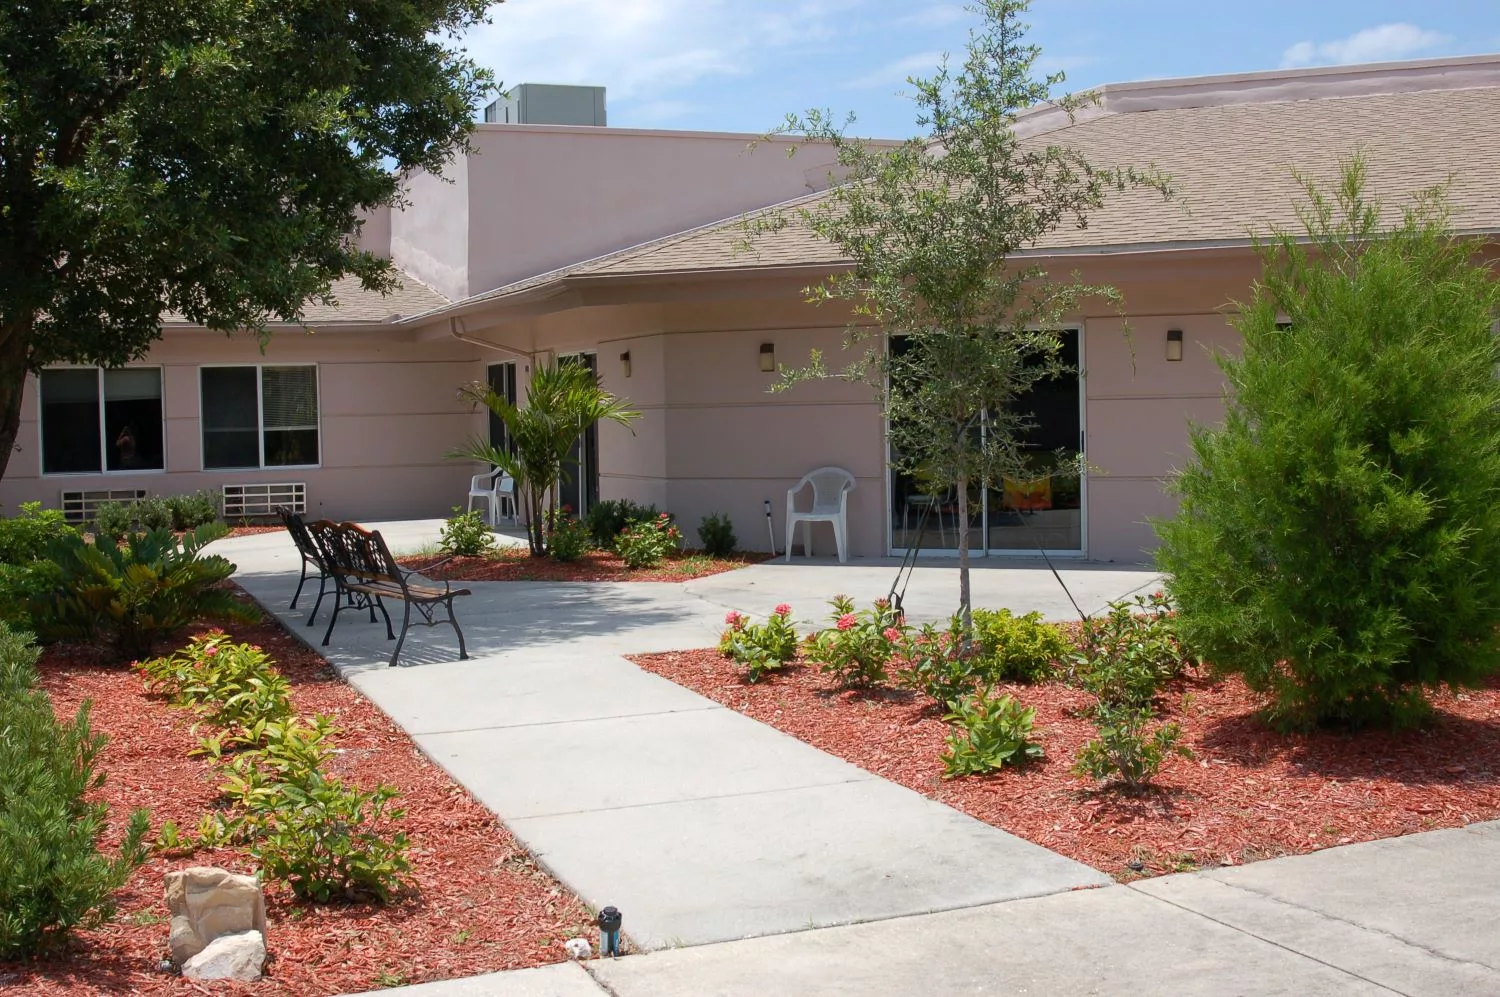
The community exudes elegance, featuring spacious, tastefully designed areas, including a delightful dining space. Residents at this home actively engage in nursing home activities. Expressions and community events foster a vibrant atmosphere, complemented by conveniences like an onsite beauty salon, transportation services, cable TV, and much more. In this nurturing environment, Surrey Place Healthcare & Rehabilitation goes beyond traditional care, providing not just healthcare services but a fulfilling experience that enhances the lives of its residents.

(941) 795-0448

Quality ratings

Measured by Centers for Medicare & Medicaid Services (CMS)

Overall rating Info The Overall CMS Rating combines results from health inspections, staffing levels and quality measures. Health inspections carry the most weight. Staffing and quality scores can increase or decrease the final rating based on performance compared to state and national standards.
4/5
Florida average: 3.2/5
Health Inspection Info Based on the results of the facility's three most recent standard inspections and any complaint investigations. CMS reviews the number, scope, and severity of deficiencies, with more recent findings weighted more heavily.
3/5
Florida average: 2.8/5
Staffing Info Measures average nursing staff hours per resident per day, including Registered Nurses (RNs) and total nursing staff. Ratings are adjusted based on the level of care residents require and are compared to state and national benchmarks.
3/5
Florida average: 3.4/5
Quality Measures Info Based on clinical and physical health indicators reported to CMS, such as hospital readmissions, falls, pressure ulcers, and improvements in mobility. These measures reflect how well residents' health needs are being managed.
5/5
Florida average: 4.1/5

Nursing care per resident

Info This shows how many total hours of nursing staff time are available per resident each day. Higher numbers usually mean more staff support.
3h 33m per day

This home provides 12% less nursing time per resident than the Florida average.

Florida average: 4h 2m per day

Staffing hours breakdown

Info Hours of care per resident per day, broken down by staff type. Data from CMS Medicare.
Staff type Facility State avg National avg
Registered Nurse (RN) Info Registered nurse hours per resident per day. 43m per day 44m per day 41m per day
Nurse Aide Info Nurse aide hours per resident per day. 2h 18m per day 2h 20m per day 2h 21m per day
Total Nursing (Weekend) Info Total number of nurse staff hours per resident per day on weekends. 3h 45m per day 3h 31m per day 3h 26m per day
Physical Therapist Info Physical therapist staff hours per resident per day. 11m per day 5m per day 4m per day
RN (Weekend) Info Registered nurse hours per resident per day on weekends. 31m per day 32m per day 29m per day

Capacity and availability

Smaller home

May offer a more intimate, personalized care environment.

Total beds 74

This home usually has limited availability

Occupancy is moderate, suggesting balanced demand.

Similar demand to the Florida average
Occupancy rate 90.2%
Residents per day (avg) 68
Occupancy rate
90.2%
Residents per day (avg)
68

Who this home usually serves

TYPE OF STAY

Mostly short-term rehab stays

Most residents typically stay for a few weeks or months before returning home or moving on.

Might be optimal for
Short stays Recovery Medicare-covered care

Breakdown by payment type

Medicare

94% of new residents, usually for short-term rehab.

Typical stay 29 days

Private pay

1% of new residents, often for short stays.

Typical stay 3 years

Medicaid

5% of new residents, often for long-term daily care.

Typical stay 11 - 12 months

Finances and operations

Privately-owned community
Operated by a business corporation.
Home revenue
$14.2M
Profit
$1.7M
Privately-owned community Operated by a business corporation.
Home revenue
$14,236,474.00
Profit
$1,705,243.00
Payroll costs Info The portion of the home's budget spent on staff, including nurses, caregivers, and other employees who support care and operations.
$5.0M
35.4% of revenue
Other operating costs Info All remaining costs needed to run the home, such as food, utilities, building maintenance, supplies and administrative expenses.
$7.5M
Total costs $12.5M
Contact Surrey Place Healthcare & Rehabilitation

Health Inspection History

Inspections
Total health inspections 3

Florida average 4.3


Last Health inspection on Mar 2025

Total health citations 11

Florida average 19.7

Citations per inspection
3.67

Florida average 4.48


Health citations are formal notices following inspections when they fail to comply with safety and care standards.

10 of 11 citations resulted from standard inspections; and 1 of 11 resulted from complaint investigations.

Breakdown of citation severity (last 3 years)
Critical Health citations More info 0
100% better than Florida average

Florida average: 0.8


Serious Health citations More info 0
100% better than Florida average

Florida average: 0.4

0 critical citations More info Florida average: 0.8

0 serious citations More info Florida average: 0.4

11 moderate citations More info Florida average: 18.4

0 minor citations More info Florida average: 0.2
Citations history (last 3 years)
Nutrition moderate citation Info Issues related to food quality, meal service, and resident's nutritional needs. Mar 13, 2025
Corrected

Quality of Care moderate citation Info Issues related to how well residents receive appropriate treatment and support for their medical and daily care needs. Mar 13, 2025
Corrected

Care Planning moderate citation Info Issues related to creating and updating personalized care plans for residents based on their needs and conditions. Mar 13, 2025
Corrected

Care Planning moderate citation Info Issues related to creating and updating personalized care plans for residents based on their needs and conditions. Mar 13, 2025
Corrected

Compare Nursing Homes around Bradenton The information below is reported by the Florida Agency for Health Care Administration (AHCA).

4 facilities compared · CMS & FL Dept. of Health data · Updated Apr 2026

Filter by care type
Heritage Park Care & Rehabilitation Center
NH

Nursing Home Licensed facility providing 24/7 skilled nursing care for residents with complex, ongoing medical needs. Staffed by RNs, LPNs, and CNAs. Inspected and star-rated annually by CMS. Accepts Medicare (short-term rehab) and Medicaid (long-term care).

AL

Assisted Living A licensed, long-term care setting for seniors or individuals with disabilities who need help with daily activities — like bathing, dressing, and medication management — but not 24-hour skilled nursing. Offers housing, meals, and around-the-clock support while aiming to maximize resident independence.

Bradenton
120
76.4%
-9%
3.81
-39%
-6%
1
11
3.7
0
111
A+
33
Heritage Park Nursing Center Llc
$10.6M
$4.8M
45.6%
105529
Surrey Place Healthcare & Rehabilitation
NH

Nursing Home Licensed facility providing 24/7 skilled nursing care for residents with complex, ongoing medical needs. Staffed by RNs, LPNs, and CNAs. Inspected and star-rated annually by CMS. Accepts Medicare (short-term rehab) and Medicaid (long-term care).

AL

Assisted Living A licensed, long-term care setting for seniors or individuals with disabilities who need help with daily activities — like bathing, dressing, and medication management — but not 24-hour skilled nursing. Offers housing, meals, and around-the-clock support while aiming to maximize resident independence.

Bradenton
74
90.2%
+7%
3.54
-17%
-12%
0
11
3.7
0
68
-
30
Christian, Shelley
$14.2M
$5.0M
35.5%
105629
Greenbriar Rehabilitation and Nursing Center
NH

Nursing Home Licensed facility providing 24/7 skilled nursing care for residents with complex, ongoing medical needs. Staffed by RNs, LPNs, and CNAs. Inspected and star-rated annually by CMS. Accepts Medicare (short-term rehab) and Medicaid (long-term care).

AL

Assisted Living A licensed, long-term care setting for seniors or individuals with disabilities who need help with daily activities — like bathing, dressing, and medication management — but not 24-hour skilled nursing. Offers housing, meals, and around-the-clock support while aiming to maximize resident independence.

Bradenton
79
94.1%
+12%
3.83
+33%
-5%
3
20
5.0
1
75
-
50
Greenbriar Snf Holdco Llc
$11.9M
$4.0M
33.6%
105159
Bay Vue Nursing & Rehabilitation Center
NH

Nursing Home Licensed facility providing 24/7 skilled nursing care for residents with complex, ongoing medical needs. Staffed by RNs, LPNs, and CNAs. Inspected and star-rated annually by CMS. Accepts Medicare (short-term rehab) and Medicaid (long-term care).

AL

Assisted Living A licensed, long-term care setting for seniors or individuals with disabilities who need help with daily activities — like bathing, dressing, and medication management — but not 24-hour skilled nursing. Offers housing, meals, and around-the-clock support while aiming to maximize resident independence.

Bradenton
110
86.3%
+2%
3.81
-23%
-6%
0
20
4.0
1
95
A+
47
15Th Street East Snf Parent Llc
$9.9M
$5.4M
54.6%
105551

Places of interest near Surrey Place Healthcare & Rehabilitation

Address 3.0 miles from city center — 0.38 miles to nearest hospital (HCA Florida Blake Hospital)
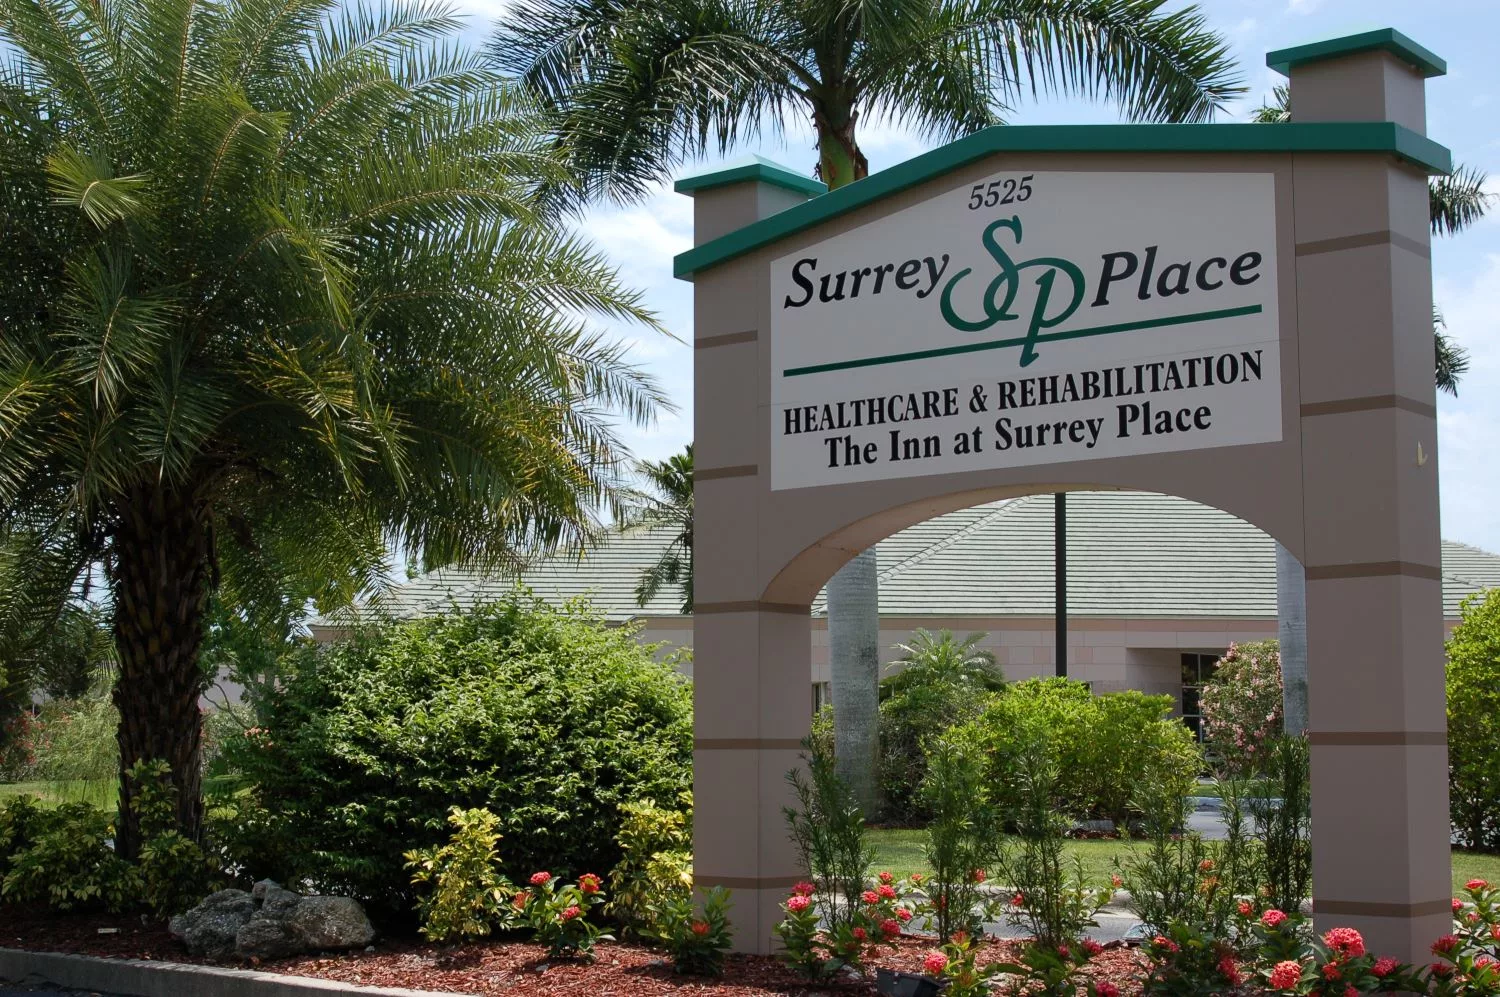
Address 5525 21st Ave W, Bradenton, FL 34209

Calculate Travel Distance to Surrey Place Healthcare & Rehabilitation

Add your location

Address

Staffing Data (Q2 2025)

This data corresponds to Q2 2025 and is based on CMS Payroll-Based Journal.

Total staff 123
Employees 100
Contractors 23
Staff to resident ratio 1.78:1
17% better than Florida average

Florida average ratio: 1.52:1

Avg staff/day 44
Average shift 7.7 hours
0% compared with Florida average

Florida average: 7.9 hours

Total staff hours (quarter) 30,712
Nursing staff breakdown
Registered Nurse

Manages medical care and health needs.

Total count 12
Average shift length Info Average shift length. Calculated as total hours divided by days worked and average staff per day. 8.6 hours

No contractors work on this role.

Licensed Practical Nurse

Assists with medical care and medications.

Total count 19
Average shift length Info Average shift length. Calculated as total hours divided by days worked and average staff per day. 8.3 hours

No contractors work on this role.

Certified Nursing Assistant

Helps with daily care and mobility.

Total count 57
Average shift length Info Average shift length. Calculated as total hours divided by days worked and average staff per day. 7.7 hours

No contractors work on this role.

Contractor staffing

Total hours from contractors

11.4%

3,511 contractor hours this quarter

Respiratory Therapy Technician: 6 Speech Language Pathologist: 5 Physical Therapy Aide: 3 Occupational Therapy Aide: 3 Physical Therapy Assistant: 2 Qualified Social Worker: 2 Medical Director: 1 Occupational Therapy Assistant: 1
Staff by category
Certified Nursing Assistant5705714,05591100%7.7
Licensed Practical Nurse190196,29491100%8.3
Registered Nurse120122,30391100%8.6
Clinical Nurse Specialist3031,3456774%7.7
Dietitian3031,10791100%7.2
Respiratory Therapy Technician0669157380%6.9
Physical Therapy Assistant0228776976%7.1
Physical Therapy Aide0338586673%6.4
Speech Language Pathologist0556627481%6.6
Administrator1015126470%8
Mental Health Service Worker1014886167%8
Nurse Practitioner1014806066%8
RN Director of Nursing2024575763%7.9
Dental Services Staff1011615055%3.2
Occupational Therapy Aide033961314%7.4
Occupational Therapy Assistant0113978%5.5
Qualified Social Worker022352527%1.4
Medical Director011302527%1.2
57 Certified Nursing Assistant
% of Days 100%
19 Licensed Practical Nurse
% of Days 100%
12 Registered Nurse
% of Days 100%
3 Clinical Nurse Specialist
% of Days 74%
3 Dietitian
% of Days 100%
6 Respiratory Therapy Technician
% of Days 80%
2 Physical Therapy Assistant
% of Days 76%
3 Physical Therapy Aide
% of Days 73%
5 Speech Language Pathologist
% of Days 81%
1 Administrator
% of Days 70%
1 Mental Health Service Worker
% of Days 67%
1 Nurse Practitioner
% of Days 66%
2 RN Director of Nursing
% of Days 63%
1 Dental Services Staff
% of Days 55%
3 Occupational Therapy Aide
% of Days 14%
1 Occupational Therapy Assistant
% of Days 8%
2 Qualified Social Worker
% of Days 27%
1 Medical Director
% of Days 27%

Facility Characteristics

Source: CMS Long-Term Care Facility Characteristics (Data as of Jan 2026)

Total census
69 residents
Residents by payment source
Medicare
34 residents (49.3%)
Medicaid
15 residents (21.7%)
Private pay or other
20 residents (29%)
Programs & Services
Residents' Group

Residents meet regularly to discuss policies, care quality, and activities

Family Member Group

Family members meet regularly to discuss policies, care quality, and activities

Active Family Council

Organized group of family members that meets regularly to discuss facility policies, resident care, and activities.

Active Resident Council

Organized group of residents that meets regularly to discuss facility policies, quality of life, and activities.

Quality of care over time

These measures show how residents usually do over time at this home, based on health outcomes and preventive care.

High-risk clinical events score Info A composite score based on pressure ulcers, falls with injury, weight loss, walking ability decline, and activities of daily living decline. 6.6
11% better than Florida average

Florida average: 7.4

Functional decline score Info A composite score based on activities of daily living decline, walking ability decline, and incontinence. 7.2
42% better than Florida average

Florida average: 12.4

Long-stay resident measures
Significantly above average Florida avg: 4.6 Info CMS star rating based on long-stay quality measure performance. 5 stars = significantly above average, 1 star = significantly below average.
Need for Help with Daily Activities Increased Info Percent of long-stay residents whose need for help with daily activities has increased 4.8%
55% better than Florida average

Florida average: 10.5%

Walking Ability Worsened Info Percent of long-stay residents whose ability to move independently worsened 9.1%
30% better than Florida average

Florida average: 12.9%

Low Risk Residents with Bowel/Bladder Incontinence Info Percent of low risk long-stay residents who lose control of their bowels or bladder 7.8%
43% better than Florida average

Florida average: 13.5%

Falls with Major Injury Info Percent of long-stay residents experiencing one or more falls with major injury 0.7%
73% better than Florida average

Florida average: 2.6%

High Risk Residents with Pressure Ulcers Info Percent of long-stay high risk residents with pressure ulcers 7.1%
32% worse than Florida average

Florida average: 5.4%

Urinary Tract Infection Info Percent of long-stay residents with a urinary tract infection 0.0%
100% better than Florida average

Florida average: 0.9%

Lost Too Much Weight Info Percent of long-stay residents who lose too much weight 11.4%
91% worse than Florida average

Florida average: 6.0%

Depressive Symptoms Info Percent of long-stay residents who have depressive symptoms 0.7%
78% better than Florida average

Florida average: 3.3%

Antipsychotic Use Info Percent of long-stay residents who received an antipsychotic medication 3.6%
55% better than Florida average

Florida average: 8.0%

Pneumococcal Vaccine Info Percent of long-stay residents assessed and appropriately given the pneumococcal vaccine 100.0%
In line with Florida average

Florida average: 97.7%

Influenza Vaccine Info Percent of long-stay residents assessed and appropriately given the seasonal influenza vaccine 100.0%
In line with Florida average

Florida average: 99.2%

Hospitalizations per 1,000 days Info Number of hospitalizations per 1,000 long-stay resident days. 1.78
15% better than Florida average

Florida average: 2.10

ED visits per 1,000 days Info Number of outpatient emergency department visits per 1,000 long-stay resident days. 1.25
6% worse than Florida average

Florida average: 1.18

Short-stay resident measures
Significantly above average Florida avg: 2.9 Info CMS star rating based on short-stay quality measure performance. 5 stars = much above average, 1 star = much below average.
Pneumococcal Vaccine Info Percent of short-stay residents assessed and appropriately given the pneumococcal vaccine 99.4%
6% better than Florida average

Florida average: 94.0%

Antipsychotic medication increase Info Percent of short-stay residents who newly received an antipsychotic medication 0.3%
77% better than Florida average

Florida average: 1.5%

Influenza Vaccine Info Percent of short-stay residents assessed and appropriately given the seasonal influenza vaccine 98.5%
In line with Florida average

Florida average: 94.7%

Re-hospitalized after SNF stay Info Percentage of short-stay residents who were re-hospitalized after their nursing home admission. 24.3%
7% better than Florida average

Florida average: 26.2%

Emergency department visits Info Percentage of short-stay residents who had an outpatient emergency department visit. 6.9%
26% better than Florida average

Florida average: 9.3%

Falls with major injury Info Percentage of SNF residents who experience falls with major injury during their stay. 1.5%
97% worse than Florida average

Florida average: 0.8%

Ability to care for self at discharge Info Percentage of residents at or above expected ability to care for themselves at discharge. 65.9%
23% better than Florida average

Florida average: 53.7%

Successful return to home or community Info Rate of successful return to home or community from a skilled nursing facility. 66.9%
32% better than Florida average

Florida average: 50.6%

Guides for Better Senior Living

Care Cost Calculator: See Prices in Your Area

Nursing Home Data Explorer

Don’t Wait Too Long: 7 Red Flag Signs Your Parent Needs Assisted Living Now

The True Cost of Assisted Living in 2025 – And How Families Are Paying For It

Understanding Senior Living Costs: Pricing Models, Discounts & Financial Assistance

Financial Aid for Florida Seniors

Get financial aid guidance

Long-Term Care Waiver

Florida Medicaid LTC Waiver

Age 65+ or 21+ disabled, Florida resident, Medicaid- eligible, nursing home-level care need.

~$2,829/month (300% FBR, individual).

$2,000 (individual), $3,000 (couple).

High demand; waitlists common.

Community Care for the Elderly (CCE)

Florida CCE

Age 60+, Florida resident, at risk of nursing home.

~$2,000/month (varies).

$5,000 (individual).

Limited funding; regional variation.

Home Care for the Elderly (HCE)

Florida Home Care for the Elderly

Age 60+, Florida resident, at risk of nursing home placement; caregiver must be approved.

~$2,829/month (individual, aligned with Medicaid thresholds).

~$2,000 (individual); varies by case manager discretion.

Limited funding (~3,500 served annually); prioritizes low-income frail seniors.

Program of All-Inclusive Care for the Elderly (PACE)

Florida Medicaid PACE

Age 55+, Florida resident, nursing home-level care need, safe with PACE support.

~$2,829/month (300% FBR).

$2,000 (individual), $3,000 (couple).

Limited to specific counties (e.g., Hillsborough, Miami-Dade); ~10 sites statewide.

Optional State Supplementation (OSS)

Florida Optional State Supplementation

Age 65+ or disabled, Florida resident, living in approved facility, receiving SSI or low-income.

~$1,004/month (individual, including SSI).

$2,000 (individual), $3,000 (couple).

Limited to specific facility types; ~$78.40/month max supplement.

Senior Community Service Employment Program (SCSEP)

Florida SCSEP (federally funded, state-administered)

Age 55+, unemployed, low-income, Florida resident.

~$1,983/month (125% FPL, individual).

Not specified; income-focused.

Priority for veterans, rural residents; ~1,000 slots/year.