


Total staff
469
Employees
185
Contractors
284
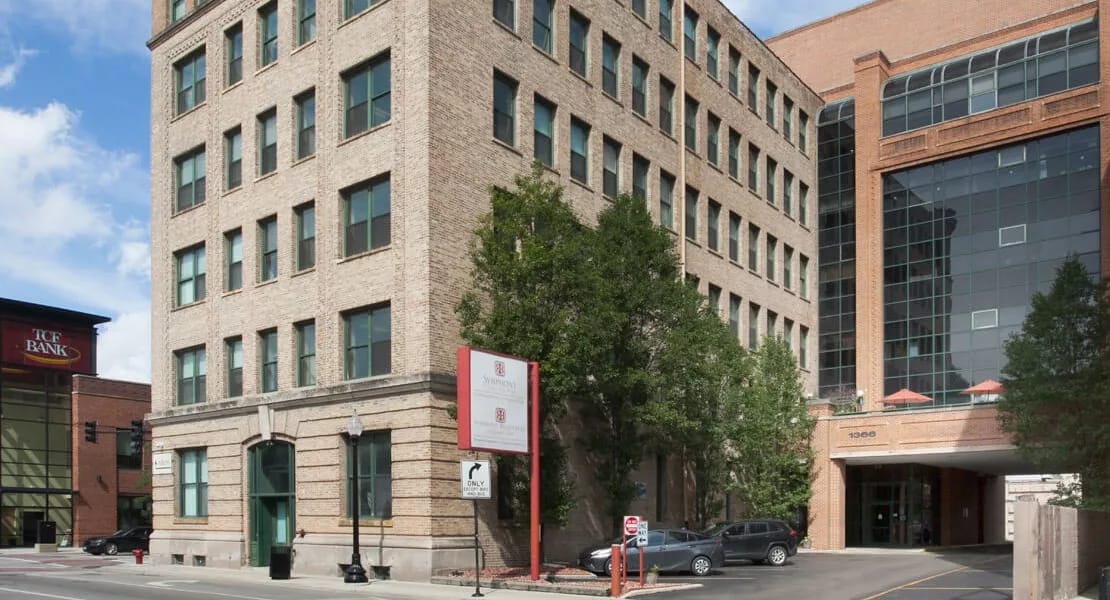

In Chicago’s Lincoln Park neighborhood, Symphony Lincoln Park operates a 248-bed skilled nursing facility at 1366 W Fullerton Ave, just 5.1 miles from downtown and steps from shopping, dining, and services (Walk Score 93; ranked among the state’s most walkable nursing homes). Louise Dihiansan owns the privately-operated community, which accepts Medicare, Medicaid, and private-pay residents and maintains.
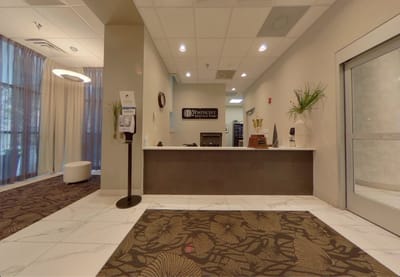
The resident census of 209 tilts heavily toward Medicaid coverage (71.3%), with private pay accounting for 23% and Medicare 5.7%. Average length of stay runs 240 days; that’s eight months and it shows a pattern typical of long-term placements. Housing options include studio, one-bedroom, and two-bedroom apartments with housekeeping and laundry. Community amenities span an executive-chef dining program, salon and barbershop, library, outdoor patio, and respite services.
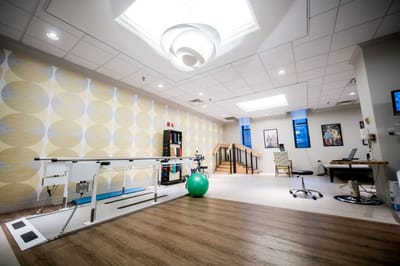
The facility accepts skilled nursing, memory care, and respite-stay admissions.
The workforce totals 469 staff with an above-average staff-to-resident ratio of 2.24:1 (25% better than Illinois norms). However, daily nursing hours are at 2 hours 48 minutes per resident, running 10% below the Illinois average of 3 hours 6 minutes, placing the facility below the 3.0-hour threshold regulators flag as concerning for care adequacy. The facility relies heavily on contract labor, with 284 of 469 staff (60%) filling contractor roles. Nursing composition includes 90 RNs, 84 LPNs, and 248 CNAs.
The CMS rating is 2-star overall, 20.6% below Illinois average, with identical 2-star scores on Health Inspection (28% below state) and Staffing (6.4% below state). Quality Measures earned 3-star (6.6% above state average). The facility faced $139,000 in recent federal fines, which is in line with Illinois average, with and zero payment denials.
Long-stay clinical outcomes reveal low functional decline; ADL needs increased by only 6.3% (60% better than state), yet report depressive symptoms at 98.8% (105% worse than Illinois average, a striking rate). Short-stay residents struggled with re-hospitalization at 40.7% (55% above state average) and community return at 46.6% (8% below state average).
The facility combines urban walkability and long-term Medicaid capacity with documented staffing hours and mental health outcome pressures.
Staffing hours
![]() Daily nursing hours per resident by staff type, reported to CMS. Higher is generally better — compare this facility to state and national averages to see where staffing stands.
Daily nursing hours per resident by staff type, reported to CMS. Higher is generally better — compare this facility to state and national averages to see where staffing stands.
Hours per resident per day vs Illinois averages
Total nursing care
![]() This home is ranked 89th out of 155 homes in Illinois for nurse hours. Total adjusted nursing hours per resident per day, combining RN, LPN, and aide time. CMS adjusts this for case-mix so facilities can be fairly compared.
This home is ranked 89th out of 155 homes in Illinois for nurse hours. Total adjusted nursing hours per resident per day, combining RN, LPN, and aide time. CMS adjusts this for case-mix so facilities can be fairly compared.
2h 48m
10% below state avg2 of 6 metrics below state avg
Reporting period: October 1 – December 31, 2025 (Q4 2025). Source: CMS Payroll-Based Journal report.
Manages medical care and health needs.
Assists with medical care and medications.
Helps with daily care and mobility.
Total hours from contractors
11,528 contractor hours this quarter
| Certified Nursing Assistant | 100 | 148 | 248 | 35,835 | 92 | 100% | 7.2 |
| Licensed Practical Nurse | 36 | 48 | 84 | 16,160 | 92 | 100% | 9.2 |
| Registered Nurse | 23 | 67 | 90 | 11,568 | 92 | 100% | 9 |
| Other Dietary Services Staff | 8 | 0 | 8 | 3,123 | 92 | 100% | 7.2 |
| Dental Services Staff | 5 | 0 | 5 | 1,772 | 92 | 100% | 5.6 |
| Clinical Nurse Specialist | 5 | 0 | 5 | 1,715 | 91 | 99% | 5.8 |
| RN Director of Nursing | 4 | 0 | 4 | 1,226 | 92 | 100% | 5.2 |
| Physical Therapy Aide | 0 | 4 | 4 | 1,223 | 70 | 76% | 7.5 |
| Respiratory Therapy Technician | 0 | 4 | 4 | 1,103 | 85 | 92% | 7.8 |
| Physical Therapy Assistant | 0 | 5 | 5 | 743 | 85 | 92% | 6.3 |
| Speech Language Pathologist | 0 | 4 | 4 | 602 | 74 | 80% | 7.1 |
| Administrator | 1 | 0 | 1 | 512 | 91 | 99% | 5.6 |
| Nurse Practitioner | 1 | 0 | 1 | 508 | 90 | 98% | 5.6 |
| Qualified Social Worker | 0 | 4 | 4 | 493 | 67 | 73% | 7.4 |
| Dietitian | 1 | 0 | 1 | 446 | 82 | 89% | 5.4 |
| Mental Health Service Worker | 1 | 0 | 1 | 421 | 75 | 82% | 5.6 |
Includes penalties issued in 2024-2025
Federal penalties imposed by CMS for regulatory violations, including civil money penalties (fines) and denials of payment for new Medicare/Medicaid admissions.
Source: CMS Penalties Database (Data as of Jan 2026)
Illinois average: $143K
Illinois average: 3.0
Illinois average: 1.1
Penalties are imposed by CMS for violations of federal nursing home regulations.
2 penalties in the past 3 years
Multiple penalties were reported in the last 3 years.
Last updated: Jan 2026
These measures show how residents usually do over time at this home, based on health outcomes and preventive care.
Illinois average: 9.7
Illinois average: 18.6
Illinois average: 15.5%
Illinois average: 18.4%
Illinois average: 21.6%
Illinois average: 3.4%
Illinois average: 5.3%
Illinois average: 1.8%
Illinois average: 6.5%
Illinois average: 48.1%
Illinois average: 20.2%
Illinois average: 89.2%
Illinois average: 91.6%
Illinois average: 2.05
Illinois average: 2.25
Illinois average: 68.3%
Illinois average: 2.3%
Illinois average: 63.0%
Illinois average: 26.2%
Illinois average: 14.0%
Illinois average: 0.8%
Illinois average: 53.7%
Illinois average: 50.6%
Quality measures are calculated from Minimum Data Set (MDS) assessments. For most measures, lower percentages indicate better care quality.
78% of new residents, usually for short-term rehab.
20% of new residents, often for short stays.
2% of new residents, often for long-term daily care.
Source: CMS Long-Term Care Facility Characteristics (Data as of Jan 2026)
Residents meet regularly to discuss policies, care quality, and activities
Organized group of residents that meets regularly to discuss facility policies, quality of life, and activities.
Data sourced from CMS Long-Term Care Facility Characteristics quarterly report. Payer mix reflects the current resident census by primary payment source.
Historical financial and operational data for Symphony Lincoln Park from 2011–2022, based on CMS SNF Cost Reports.
Key figures below are for fiscal year ending in 10/2022 — the home's most recent complete cost report, an older period than most facilities report.
Based on the home's most recent complete CMS SNF Cost Report — fiscal year ending in 10/2022. This is an older period than most facilities report, so compare with that in mind.
Most residents typically stay for a few weeks or months before returning home or moving on.
Most new residents arrive under Medicare (78% of admissions), and a typical Medicare stay runs around 22 days.
Coverage residents most often arrive under.
Coverage residents most often leave under.
![]() 3.3 miles from city center
3.3 miles from city center
![]() Estimated distance in miles from Chicago's city center to Symphony Lincoln Park's address, calculated via Google Maps.
— 1.45 miles to nearest hospital (Ascension Saint Joseph - Chicago)
Estimated distance in miles from Chicago's city center to Symphony Lincoln Park's address, calculated via Google Maps.
— 1.45 miles to nearest hospital (Ascension Saint Joseph - Chicago)
Add your location
Info below is compiled from CMS reports & the IL Dept. of Public Health (IDPH), senior community websites & trusted data sources such as Walk Score & BBB.
Communities are listed from highest to lowest based on our ranking methodology.
| Mercy Circle Senior Living | NH AL IL MC SNF | Chicago (Mount Greenwood) | 43
Facility
43
IL AVG
85
Rank
#330 / 419 | - | - | 4.57
Facility
4.57
IL AVG
3.10
Rank
#24 / 155 | -8% | +47% | $0
Facility
$0
IL AVG
$151.3k
Rank
#1 / 155 | 16
Facility
16
IL AVG
36.8
Rank
#24 / 155 | 4.0
Facility
4.0
IL AVG
3.7
Rank
#105 / 155 | - | 22 | - |
44
Facility
44
IL AVG
51
Rank
#392 / 648 | Sisters Of Mercy Of The Americas West Midwest Community Inc | $10.3MFiscal year ending 06/2024
Facility
$10.3MFiscal year ending 06/2024
IL AVG
$12.2M
Rank
#95 / 154 | $5.1MFiscal year ending 06/2024
Facility
$5.1MFiscal year ending 06/2024
IL AVG
$4.8M
Rank
#112 / 154 | 49.8%Fiscal year ending 06/2024
Facility
49.8%Fiscal year ending 06/2024
IL AVG
44.3%
Rank
#105 / 154 | 146174 | ||||
| The Selfhelp Home Senior Living Community | NH AL IL RC SNF | Chicago (Uptown) | 72
Facility
72
IL AVG
85
Rank
#204 / 419 |
81.9%
Facility
81.9%
IL AVG
73
Rank
#63 / 157 | +12% | 5.56
Facility
5.56
IL AVG
3.10
Rank
#8 / 155 | +44% | +79% | $0
Facility
$0
IL AVG
$151.3k
Rank
#1 / 155 | 21
Facility
21
IL AVG
36.8
Rank
#41 / 155 | 5.3
Facility
5.3
IL AVG
3.7
Rank
#138 / 155 | 1 | 59 | A+ |
92
Facility
92
IL AVG
51
Rank
#28 / 648 | Marvin Rubin | $9.3MFiscal year ending 09/2023
Facility
$9.3MFiscal year ending 09/2023
IL AVG
$12.2M
Rank
#76 / 154 | $7.0MFiscal year ending 09/2023
Facility
$7.0MFiscal year ending 09/2023
IL AVG
$4.8M
Rank
#72 / 154 | 75.3%Fiscal year ending 09/2023
Facility
75.3%Fiscal year ending 09/2023
IL AVG
44.3%
Rank
#59 / 154 | 146009 | ||||
| The Clare | NH AL IL MC SNF | Chicago (Rush & Division) | 49
Facility
49
IL AVG
85
Rank
#294 / 419 |
92.2%
Facility
92.2%
IL AVG
73
Rank
#23 / 157 | +26% | 3.69
Facility
3.69
IL AVG
3.10
Rank
#48 / 155 | +61% | +19% | $0
Facility
$0
IL AVG
$151.3k
Rank
#1 / 155 | 13
Facility
13
IL AVG
36.8
Rank
#19 / 155 | 2.6
Facility
2.6
IL AVG
3.7
Rank
#25 / 155 | 1 | 45 | A+ |
100
Facility
100
IL AVG
51
Rank
#1 / 648 | County Of Fulton | $4.4MFiscal year ending 11/2023
Facility
$4.4MFiscal year ending 11/2023
IL AVG
$12.2M
Rank
#147 / 154 | $3.6MFiscal year ending 11/2023
Facility
$3.6MFiscal year ending 11/2023
IL AVG
$4.8M
Rank
#146 / 154 | 81.8%Fiscal year ending 11/2023
Facility
81.8%Fiscal year ending 11/2023
IL AVG
44.3%
Rank
#14 / 154 | 146151 | ||||
| Asbury Gardens | NH HOS MC PC SNF | North Aurora (Airport Road) | 75
Facility
75
IL AVG
85
Rank
#193 / 419 |
76.5%
Facility
76.5%
IL AVG
73
Rank
#78 / 157 | +5% | 4.00
Facility
4.00
IL AVG
3.10
Rank
#41 / 155 | +6% | +29% | $6.4k
Facility
$6.4k
IL AVG
$151.3k
Rank
#66 / 155 | 21
Facility
21
IL AVG
36.8
Rank
#41 / 155 | 3.5
Facility
3.5
IL AVG
3.7
Rank
#72 / 155 | - | 57 | A+ |
38
Facility
38
IL AVG
51
Rank
#434 / 648 | Abraham Diamond | $6.7MFiscal year ending 12/2023
Facility
$6.7MFiscal year ending 12/2023
IL AVG
$12.2M
Rank
#137 / 154 | $3.8MFiscal year ending 12/2023
Facility
$3.8MFiscal year ending 12/2023
IL AVG
$4.8M
Rank
#128 / 154 | 56.5%Fiscal year ending 12/2023
Facility
56.5%Fiscal year ending 12/2023
IL AVG
44.3%
Rank
#28 / 154 | 146170 | ||||
| Symphony Lincoln Park | NH MC PC SNF | Chicago (Lincoln Park) | 248
Facility
248
IL AVG
85
Rank
#9 / 419 |
90.2%
Facility
90.2%
IL AVG
73
Rank
#29 / 157 | +24% | 2.80
Facility
2.80
IL AVG
3.10
Rank
#89 / 155 | +35% | -10% | $98.0k
Facility
$98.0k
IL AVG
$151.3k
Rank
#117 / 155 | 65
Facility
65
IL AVG
36.8
Rank
#137 / 155 | 3.8
Facility
3.8
IL AVG
3.7
Rank
#90 / 155 | 6 | 224 | - |
93
Facility
93
IL AVG
51
Rank
#23 / 648 | Louise Dihiansan | $20.0M*Fiscal year ending 10/2022These figures are from this home's most recent complete cost report — an older period than most facilities report. Compare with that in mind.
Facility
$20.0M*Fiscal year ending 10/2022These figures are from this home's most recent complete cost report — an older period than most facilities report. Compare with that in mind.
IL AVG
$12.2M
Rank
#40 / 154 | $11.7M*Fiscal year ending 10/2022These figures are from this home's most recent complete cost report — an older period than most facilities report. Compare with that in mind.
Facility
$11.7M*Fiscal year ending 10/2022These figures are from this home's most recent complete cost report — an older period than most facilities report. Compare with that in mind.
IL AVG
$4.8M
Rank
#21 / 154 | 58.4%*Fiscal year ending 10/2022These figures are from this home's most recent complete cost report — an older period than most facilities report. Compare with that in mind.
Facility
58.4%*Fiscal year ending 10/2022These figures are from this home's most recent complete cost report — an older period than most facilities report. Compare with that in mind.
IL AVG
44.3%
Rank
#43 / 154 | 145510 |
Symphony Lincoln Park is located in Chicago, Illinois.
Here are the financial assistance programs available to residents in Illinois.
Symphony Lincoln Park is in the Lincoln Park neighborhood.
Symphony Lincoln Park has a walk score of 93. Walker's paradise. Daily errands do not require a car, with many shops and services nearby.
Symphony Lincoln Park's occupancy is 76.6%.
No, Symphony Lincoln Park has a no-pet policy.
Symphony Lincoln Park is registered as a for-profit.
Yes — there are 4 photos of Symphony Lincoln Park in the photo gallery on this page.
Symphony Lincoln Park is located at 1366 W Fullerton Ave, Chicago, IL 60614.
Care Cost Calculator: See Prices in Your Area
Nursing Home Data Explorer
Don’t Wait Too Long: 7 Red Flag Signs Your Parent Needs Assisted Living Now
The True Cost of Assisted Living in 2025 – And How Families Are Paying For It
Understanding Senior Living Costs: Pricing Models, Discounts & Financial Assistance


