The Bridge at Ocala
Nursing Home & Assisted Living · Florida, FL
CMS overall rating Info The Overall CMS Rating is scored from 1 to 5 stars and combines results from health inspections, staffing levels, and quality measures. Health inspections carry the most weight. Staffing and quality scores can increase or decrease the final rating based on performance compared to state and national standards.

The Bridge at Ocala

Nursing Home & Assisted Living · Florida, FL
CMS overall rating Info The Overall CMS Rating is scored from 1 to 5 stars and combines results from health inspections, staffing levels, and quality measures. Health inspections carry the most weight. Staffing and quality scores can increase or decrease the final rating based on performance compared to state and national standards.
Calculator: See prices in your area
The Bridge at Ocala accepts Medicare, Medicaid, and private pay.

Overview of The Bridge at Ocala

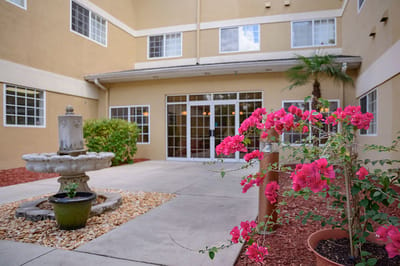
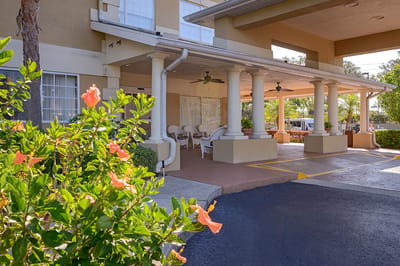
The Bridge at Ocala has gained recognition for its praised service and consumer satisfaction.  Assisted living residents are encouraged to find independence amid the quality service they receive. The luxury assisted living community strives to accommodate diverse individuals who can meet all their needs. The Bridge is a person-centered community that guarantees residents can live life on their terms as independently as possible.

As a proud member of Century Park Associates, The Bridge provides exceptional and resort-like hospitality. Seniors can find a list of possibilities that interest them, including the amenities and services that cater to their day-to-day living: social and cultural events, indoor pool and hot tub, recreational activities, and many more.

(352) 873-2036

Quality ratings

Measured by Centers for Medicare & Medicaid Services (CMS)

Overall rating Info The Overall CMS Rating combines results from health inspections, staffing levels and quality measures. Health inspections carry the most weight. Staffing and quality scores can increase or decrease the final rating based on performance compared to state and national standards.
▲ 9.3% Above FL avg. ▲ 9.3% Above FL avg.Click the badge to see the full State ranking.Click here to see the full State ranking.
Health Inspection Info Based on the results of the facility's three most recent standard inspections and any complaint investigations. CMS reviews the number, scope, and severity of deficiencies, with more recent findings weighted more heavily.
▼ 5.4% Below FL avg. ▼ 5.4% Below FL avg.Click the badge to see the full State ranking.Click here to see the full State ranking.
Staffing Info Measures average nursing staff hours per resident per day, including Registered Nurses (RNs) and total nursing staff. Ratings are adjusted based on the level of care residents require and are compared to state and national benchmarks.
▼ 19.6% Below FL avg. ▼ 19.6% Below FL avg.Click the badge to see the full State ranking.Click here to see the full State ranking.
Quality Measures Info Based on clinical and physical health indicators reported to CMS, such as hospital readmissions, falls, pressure ulcers, and improvements in mobility. These measures reflect how well residents' health needs are being managed.
▲ 17.1% Above FL avg. ▲ 17.1% Above FL avg.Click the badge to see the full State ranking.Click here to see the full State ranking.

Staffing hours breakdown

Info Daily nursing hours per resident by staff type, reported to CMS. Higher is generally better — compare this facility to state and national averages to see where staffing stands.

Hours per resident per day — compared to Florida state averages

Total nursing care / resident Info This home is ranked 143rd out of 252 homes in Florida. Total adjusted nursing hours per resident per day, combining RN, LPN, and aide time. CMS adjusts this for case-mix so facilities can be fairly compared.
3h 49m per day
Rank #143 / 252Nurse hours — State benchmarkedThis home is ranked 143rd out of 252 homes in Florida. Shows adjusted nurse hours per resident per day benchmarked to the Florida average, with a ranking across 252 Florida SNFs. More hours mean more direct care. The national average is about 3.5 hrs; below 3.0 is a red flag.Click the rank badge to see the full State ranking.Click here to see the full State ranking.
This facility Florida avg (4h 25m per day)
vs Florida avg
-14%
Staff typeHours / Day / Residentvs state avg
Weekend Total Nursing Info Combined nursing hours (RN + LPN + Nurse Aide) per resident per day on weekends. Staffing often drops on weekends — this figure reveals whether the facility maintains adequate coverage outside of weekday hours. 3h 17m per day

Types of Care at The Bridge at Ocala

Assisted Living

Capacity and availability

This home usually has limited availability

Occupancy between 85% and 95% suggests balanced demand.

Higher occupancy than the Florida average: 84.3%
Occupancy rate 92.5% Rank #72 / 255Occupancy rate — State benchmarkedThis home is ranked 72nd out of 255 homes in Florida. Shows this facility's occupancy rate versus the Florida average, with its Statewide rank out of 255. Higher occupancy signals strong local demand and financial stability.Click the rank badge to see the full State ranking.Click here to see the full State ranking.
Avg. Length of Stay 110 days
Occupancy rate
92.5% Rank #72 / 255Occupancy rate — State benchmarkedThis home is ranked 72nd out of 255 homes in Florida. Shows this facility's occupancy rate versus the Florida average, with its Statewide rank out of 255. Higher occupancy signals strong local demand and financial stability.Click the rank badge to see the full State ranking.Click here to see the full State ranking.
Avg. Length of Stay
110 days
Bed community size
95-bed community Rank #512 / 1065Bed count — State benchmarkedThis home is ranked 512th out of 1065 homes in Florida. Shows this facility's certified or reported bed count compared to other Florida SNFs. Larger communities may offer more amenities, programs, and on-site services for residents and families.Click the rank badge to see the full State ranking.Click here to see the full State ranking.
A larger shared setting that may offer more common spaces and organized community services.
Walk Score
Walk Score: 44 / 100 Rank #637 / 1486Walk Score — State benchmarkedThis home is ranked 637th out of 1486 homes in Florida. Shows how walkable this facility's neighborhood is compared to the average Walk Score across Florida SNFs. Higher scores benefit residents, families, and staff.Click the rank badge to see the full State ranking.Click here to see the full State ranking.
Somewhat walkable. A few nearby services may be reachable on foot, but most trips require transportation.
BBB Rating
BBB Rating: A+ (Accredited)
An independent rating from the Better Business Bureau based on factors such as complaint history, transparency, and business practices.
How BBB ratings work

About this community

License Details

Facility TypeAssisted Living Facility
StatusLicensed
IssuanceOctober 27, 2025
ExpirationOctober 26, 2027
CountyMarion
License Number9612

Ownership & Operating Entity

The Bridge at Ocala is legally operated by Life Care Centers Of America, Inc, and administrated by Lori Gomillion.

Management CompanyCENTURY PARK ASSOCIATES, LLC
Profit StatusFor-Profit

Staffing

Key information about the people who lead and staff this community.

Contact The Bridge at Ocala

Inspection History

In Florida, the Agency for Health Care Administration (AHCA) is the primary authority that conducts unannounced inspections and completes official health quality reports for all healthcare facilities.

Since 2013 · 13 years of data 13 citations 16 inspections

Inspection Scorecard Info This scorecard compares key inspection, citation, and complaint metrics at this facility against the Florida state average. Metrics rated ≥15% worse than average are highlighted in red; those ≥15% better are highlighted in green.

Since 2013 vs. Florida state average
Overall vs. FL average 0 Worse No metrics in this bucket. 6 Better Metrics better than Florida average:
• Total citations (61% below)
• Citations per year (60% below)
• Citations per inspection (38% below)
• Total inspections (38% below)
• Inspections with citations (63% below)
• Inspection citation rate (39% below)
Latest Inspection June 11, 2025 Monitor

Citations Info Citations are formal regulatory issues recorded during state inspections.

This FacilityFL Averagevs. FL Avg
Total citations Info Formal regulatory issues recorded by inspectors across all inspection types. 1333 This facility has 61% fewer total citations than a typical Florida nursing home (13 vs. FL avg 33).↓ 61% better
Citations per year Info Average citations per year since 2013. 12.5 This facility has 60% fewer citations per year than a typical Florida nursing home (1 vs. FL avg 2.5).↓ 60% better
Citations per inspection Info Average citations per inspection. 0.81.3 This facility has 38% fewer citations per inspection than a typical Florida nursing home (0.8 vs. FL avg 1.3).↓ 38% better

Inspections Info State inspections evaluate whether the facility meets health and safety standards.

This FacilityFL Averagevs. FL Avg
Total inspections Info Combined count of all routine and focused inspections. Excludes complaint investigations. 1626 This facility has 38% fewer total inspections than a typical Florida nursing home (16 vs. FL avg 26).↓ 38% better
Inspections with citations Info Inspections that resulted in at least one regulatory citation. 616 This facility has 63% fewer inspections with citations than a typical Florida nursing home (6 vs. FL avg 16).↓ 63% better
Inspection citation rate Info Percentage of inspections that resulted in at least one citation. 38%62% This facility has 24 percentage points lower inspection citation rate than a typical Florida nursing home (38% vs. FL avg 62%).↓ 24% better

Inspection Reports Summary Info An editor-reviewed summary of the themes and findings across this facility's recent inspection reports.

The Bridge at Life Care Center of Ocala (The) underwent its latest inspection on June 11, 2025, which reported no deficiencies. Over the reporting period from January 14, 2013 to June 11, 2025, a total of 15 inspections were conducted, with all but one citing deficiencies. The facility accumulated 12 total deficiencies across these inspections, primarily related to records and documentation, resident care and rights, and dietary services. Notably, the facility has demonstrated improvement in addressing past issues, as indicated by the correction notes showing that previously cited deficiencies have been resolved.

Read the full inspection reports for this facility, including detailed findings and corrective actions.

Show Inspection Reports

Health Inspection History

Inspections since 2022
Total health inspections 4

Florida average 4.3


Last Health inspection on Jun 2025

Total health citations
18 Rank #129 / 251Health citations — State benchmarkedThis home is ranked 129th out of 251 homes in Florida. Shows this facility's total health deficiency citations benchmarked to the Florida State average, with a ranking across all 251 FL SNFs. Lower citation counts earn a better rank.Click the rank badge to see the full State ranking.Click here to see the full State ranking.

Florida average 19.7

Citations per inspection
4.5 Rank #140 / 251Citations per inspection — State benchmarkedThis home is ranked 140th out of 251 homes in Florida. Shows average deficiency citations per CMS inspection for this facility versus the Florida mean across 251 SNFs with citation data. Lower is better.Click the rank badge to see the full State ranking.Click here to see the full State ranking.

Florida average 4.48


Health citations are formal notices following inspections when they fail to comply with safety and care standards.

17 of 18 citations resulted from standard inspections; and 1 of 18 resulted from complaint investigations.

Breakdown of citation severity (last 4 years)
Critical Health citations
0
100% better than Florida average

Florida average: 0.8


Serious Health citations
1 Rank #1 / 56Serious citations (G–I) — State benchmarkedThis home is ranked 1st out of 56 homes in Florida. Shows G–I scope serious health citations for this facility versus other Florida SNFs. Lower counts rank better.Click the rank badge to see the full State ranking.Click here to see the full State ranking.
150% worse than Florida average

Florida average: 0.4

0 critical citations Florida average: 0.8

1 serious citation Florida average: 0.4

16 moderate citations Florida average: 18.4

1 minor citation Florida average: 0.2
Citations history (last 4 years)
Nutrition moderate citation Jun 12, 2025
Corrected

Pharmacy moderate citation Jun 12, 2025
Corrected

Quality of Care moderate citation Jun 12, 2025
Corrected

Quality of Care moderate citation Jun 12, 2025
Corrected

Staffing Data

Reporting period: October 1 – December 31, 2025 (Q4 2025). Source: CMS Payroll-Based Journal report.

Total staff 261
Employees 163
Contractors 98
Staff to resident ratio 1.54:1
5% better than Florida average
Florida average ratio: 1.47:1 Florida average ratio: 1.47:1See full Florida ranking
Avg staff/day 87
Average shift 8 hours
0% compared with Florida average
Florida average: 7.9 hours Florida average shift: 7.9 hoursSee full Florida ranking
Total staff hours (quarter) 64,070

Nursing staff breakdown

Q4 2025 · Oct 1 – Dec 31 More info This data comes from the CMS Payroll-Based Journal report covering October 1 – December 31, 2025.
Registered Nurse

Manages medical care and health needs.

RN Staff 9
Average shift length Info Average shift length. Calculated as total hours divided by days worked and average staff per day. 8 hours

No contractors work on this role.

Licensed Practical Nurse

Assists with medical care and medications.

LPN Staff 64
Average shift length Info Average shift length. Calculated as total hours divided by days worked and average staff per day. 8 hours

This role is partially covered by contractors.

Certified Nursing Assistant

Helps with daily care and mobility.

CNA Staff 126
Average shift length Info Average shift length. Calculated as total hours divided by days worked and average staff per day. 8.5 hours

This role is partially covered by contractors.

Contractor staffing

Q4 2025 · Oct 1 – Dec 31 More info This data comes from the CMS Payroll-Based Journal report covering October 1 – December 31, 2025.

Total hours from contractors

8.6%

5,500 contractor hours this quarter

Certified Nursing Assistant: 35 Licensed Practical Nurse: 31 Speech Language Pathologist: 7 Physical Therapy Assistant: 6 Physical Therapy Aide: 5 Occupational Therapy Assistant: 4 Respiratory Therapy Technician: 4 Qualified Social Worker: 3 Dietitian: 1 Occupational Therapy Aide: 1 Medical Director: 1

Staff by category

Q4 2025 · Oct 1 – Dec 31 More info This data comes from the CMS Payroll-Based Journal report covering October 1 – December 31, 2025.
Certified Nursing Assistant913512634,13492100%8.5
Licensed Practical Nurse33316415,62092100%8
Registered Nurse9092,9999199%8
Dietitian4151,95292100%7.7
Speech Language Pathologist67131,7167177%6.5
Clinical Nurse Specialist3031,2806571%8
Mental Health Service Worker5051,1786571%8.6
Physical Therapy Aide3581,0427177%7.3
Respiratory Therapy Technician3479107885%6.6
RN Director of Nursing2028796267%8.1
Physical Therapy Assistant1675735257%6
Qualified Social Worker0334746571%7.1
Nurse Practitioner1014565762%8
Administrator1014005054%8
Occupational Therapy Aide1122954043%7.4
Occupational Therapy Assistant044895358%1.4
Medical Director011753841%2
126 Certified Nursing Assistant
% of Days 100%
64 Licensed Practical Nurse
% of Days 100%
9 Registered Nurse
% of Days 99%
5 Dietitian
% of Days 100%
13 Speech Language Pathologist
% of Days 77%
3 Clinical Nurse Specialist
% of Days 71%
5 Mental Health Service Worker
% of Days 71%
8 Physical Therapy Aide
% of Days 77%
7 Respiratory Therapy Technician
% of Days 85%
2 RN Director of Nursing
% of Days 67%
7 Physical Therapy Assistant
% of Days 57%
3 Qualified Social Worker
% of Days 71%
1 Nurse Practitioner
% of Days 62%
1 Administrator
% of Days 54%
2 Occupational Therapy Aide
% of Days 43%
4 Occupational Therapy Assistant
% of Days 58%
1 Medical Director
% of Days 41%

Penalties and fines

Includes penalties issued in 2024

Federal penalties imposed by CMS for regulatory violations, including civil money penalties (fines) and denials of payment for new Medicare/Medicaid admissions.

Source: CMS Penalties Database (Data as of Jan 2026)

Total fines amount $9K Rank #159 / 257Federal fines — State benchmarkedThis home is ranked 159th out of 257 homes in Florida. Shows this facility's cumulative CMS federal fine dollars versus the Florida average among facilities with fines, and where it ranks among 257 skilled nursing facilities in the pool. Lower total dollars mean a better rank.Click the rank badge to see the full State ranking.Click here to see the full State ranking.
88% lower than Florida average

Florida average: $72K

Number of fines 1
62% fewer fines than Florida average

Florida average: 2.6

Payment Denials Info Serious action where Medicare and/or Medicaid temporarily stops payments for new residents until issues are fixed. 0
100% fewer payment denials than Florida average

Florida average: 0.1

Fines amount comparison
This facility $9K
Florida average $72K
Penalty History

Penalties are imposed by CMS for violations of federal nursing home regulations.

1 penalty in the past 3 years

Dec 19, 2024 · $9K

Civil Money Penalty Info Fines imposed for noncompliance, which can be assessed per day or per instance of violation. Dec 19, 2024
$9K

Last updated: Jan 2026

Quality of care over time

These measures show how residents usually do over time at this home, based on health outcomes and preventive care.

High-risk clinical events score Info A composite score based on pressure ulcers, falls with injury, weight loss, walking ability decline, and activities of daily living decline. 2.9
60% better than Florida average

Florida average: 7.4

Functional decline score Info A composite score based on activities of daily living decline, walking ability decline, and incontinence. 7.0
44% better than Florida average

Florida average: 12.4

Long-stay resident measures
Need for Help with Daily Activities Increased Info Percent of long-stay residents whose need for help with daily activities has increased 5.3%
49% better than Florida average

Florida average: 10.5%

Walking Ability Worsened Info Percent of long-stay residents whose ability to move independently worsened 2.7%
79% better than Florida average

Florida average: 12.9%

Low Risk Residents with Bowel/Bladder Incontinence Info Percent of low risk long-stay residents who lose control of their bowels or bladder 12.9%
5% better than Florida average

Florida average: 13.5%

Falls with Major Injury Info Percent of long-stay residents experiencing one or more falls with major injury 1.8%
33% better than Florida average

Florida average: 2.6%

High Risk Residents with Pressure Ulcers Info Percent of long-stay high risk residents with pressure ulcers 2.0%
63% better than Florida average

Florida average: 5.4%

Urinary Tract Infection Info Percent of long-stay residents with a urinary tract infection 0.4%
59% better than Florida average

Florida average: 0.9%

Lost Too Much Weight Info Percent of long-stay residents who lose too much weight 2.9%
52% better than Florida average

Florida average: 6.0%

Depressive Symptoms Info Percent of long-stay residents who have depressive symptoms 2.8%
17% better than Florida average

Florida average: 3.3%

Antipsychotic Use Info Percent of long-stay residents who received an antipsychotic medication 3.0%
62% better than Florida average

Florida average: 8.0%

Pneumococcal Vaccine Info Percent of long-stay residents assessed and appropriately given the pneumococcal vaccine 100.0%
In line with Florida average

Florida average: 97.7%

Influenza Vaccine Info Percent of long-stay residents assessed and appropriately given the seasonal influenza vaccine 99.4%
In line with Florida average

Florida average: 99.2%

Short-stay resident measures
Pneumococcal Vaccine Info Percent of short-stay residents assessed and appropriately given the pneumococcal vaccine 97.8%
In line with Florida average

Florida average: 94.0%

Antipsychotic medication increase Info Percent of short-stay residents who newly received an antipsychotic medication 0.7%
57% better than Florida average

Florida average: 1.5%

Influenza Vaccine Info Percent of short-stay residents assessed and appropriately given the seasonal influenza vaccine 99.6%
5% better than Florida average

Florida average: 94.7%

Breakdown by payment type

Medicare

33% of new residents, usually for short-term rehab.

Typical stay 1 months

Private pay

57% of new residents, often for short stays.

Typical stay 26 days

Medicaid

9% of new residents, often for long-term daily care.

Typical stay 2 years

Facility Characteristics

Source: CMS Long-Term Care Facility Characteristics (Data as of Jan 2026)

Total residents 169
Medicare
33
19.5% of residents
Medicaid
135
79.9% of residents
Private pay or other
1
0.6% of residents

Finances and operations

Privately-owned community
Operated by a partnership between two or more business owners.
Home revenue
$28.4M
Operating loss
-$1.3M
Privately-owned community Operated by a partnership between two or more business owners.
Home revenue
$28.4M Rank #52 / 256Revenue — State benchmarkedThis home is ranked 52nd out of 256 homes in Florida. Shows this facility's annual revenue compared to the Florida SNF average. Higher revenue generally means more resources for staffing and capital — read alongside Payroll %.Click the rank badge to see the full State ranking.Click here to see the full State ranking.
Operating loss
-$1.3M
Payroll costs Info The portion of the home's budget spent on staff, including nurses, caregivers, and other employees who support care and operations. Rank #64 / 256Payroll — State benchmarkedThis home is ranked 64th out of 256 homes in Florida. Shows total annual staff payroll benchmarked to the Florida average. Higher payroll investment relative to peers often signals better staffing and less reliance on cheaper contract labor.Click the rank badge to see the full State ranking.Click here to see the full State ranking.
$10.3M
36.1% of revenue Rank #202 / 256Payroll % — State benchmarkedThis home is ranked 202nd out of 256 homes in Florida. Shows payroll as a percentage of revenue versus the Florida average. Well-run Florida SNFs typically land around 49–56% — the top third Statewide. Below 25% may signal understaffing or heavy agency use — read with Staffing ratings.Click the rank badge to see the full State ranking.Click here to see the full State ranking.
Other operating costs Info All remaining costs needed to run the home, such as food, utilities, building maintenance, supplies and administrative expenses.
$19.5M
Total costs $29.8M

What does this home offer?

Pets allowed icon
Pets allowed icon

Pets Allowed

Room sizes icon
Room sizes icon

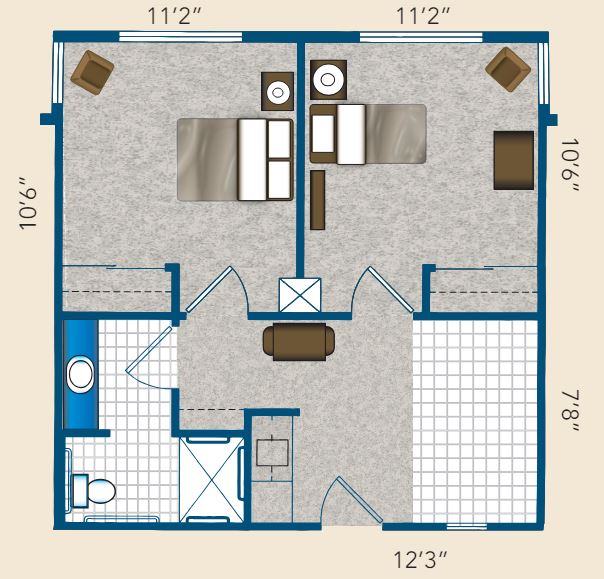
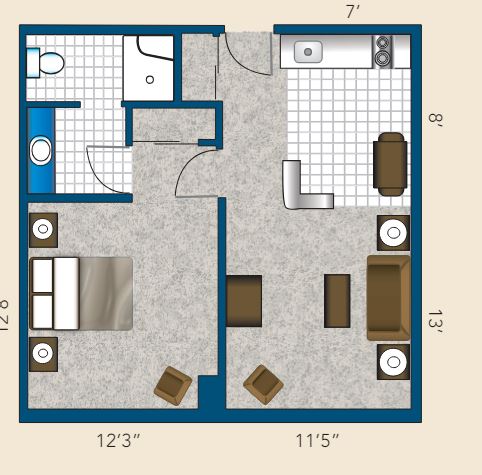
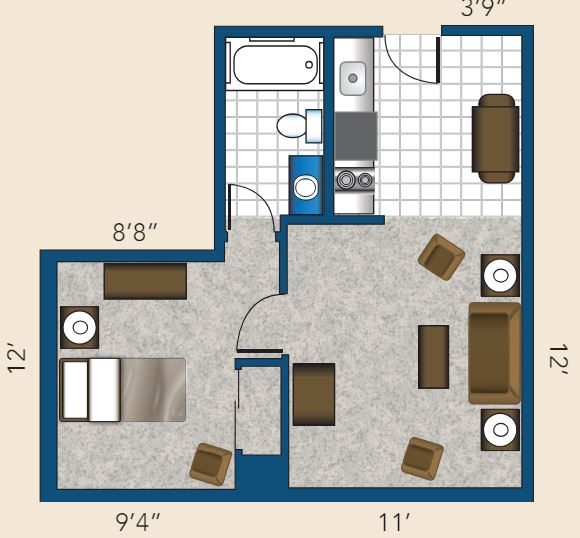
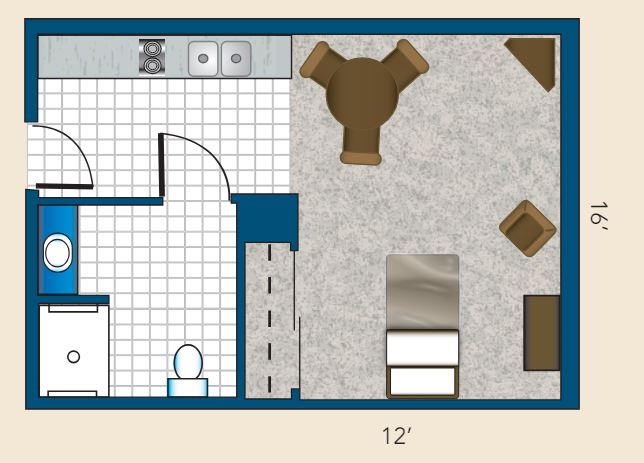
Room Sizes: 342 / 392 / 492 / 576 sq. ft

Housing options icon

Housing Options: Studio / 1 Bed

Building type icon
Building type icon

Building Type: 3-story

Transportation services icon

Transportation Services

Fitness and recreation icon

Fitness and Recreation

Who this home usually serves

TYPE OF STAY

Mix of rehab and long-term care

This home supports both short-term rehab and long-term care, with residents staying for a wide range of durations.

Activities in this home

Living Spaces & Floor Plans for The Bridge at Ocala

The Bridge At Ocala Plan 3
The Bridge At Ocala Plan 2
The Bridge At Ocala Plan 1
The Bridge At Ocala Plan 4

Places of interest near The Bridge at Ocala

Address 4.0 miles from city center Info Estimated distance in miles from Ocala's city center to The Bridge at Ocala's address, calculated via Google Maps. — 0.44 miles to nearest hospital (Surgery Center of Ocala)

Calculate Travel Distance to The Bridge at Ocala

Add your location

Address

Financial Assistance for
Nursing Home in Florida

The Bridge at Ocala is located in Ocala, Florida.
Here are the financial assistance programs available to residents in Florida.

Get Financial aid guidance

Long-Term Care Waiver

Florida Medicaid LTC Waiver

Age 65+ or 21+ disabled
General Florida resident, Medicaid- eligible, nursing home-level care need.
Income Limits (2025) ~$2,829/month 300% FBR, individual
Asset Limits $2,000 (individual), $3,000 (couple).
FL

High demand; waitlists common.

Benefits
In-home care (6-8 hours/day) Assisted living Respite (240 hours/year) Case management

Community Care for the Elderly (CCE)

Florida CCE

Age 60+
General Florida resident, at risk of nursing home.
Income Limits ~$2,000/month varies
Asset Limits $5,000 individual
FL

Limited funding; regional variation.

Benefits
Homemaker services (3-5 hours/week) Adult day care (~$60/day) Respite (up to 10 days/year)

Home Care for the Elderly (HCE)

Florida Home Care for the Elderly

Age 60+
General Florida resident, at risk of nursing home placement; caregiver must be approved.
Income Limits (2025) ~$2,829/month individual, aligned with Medicaid thresholds
Asset Limits ~$2,000 (individual); varies by case manager discretion.
FL

Limited funding (~3,500 served annually); prioritizes low-income frail seniors.

Benefits
Basic subsidy (~$160/month) for housing/medical costs; special subsidies for supplies/services (e.g., incontinence supplies, ~$50-$200/month)

Program of All-Inclusive Care for the Elderly (PACE)

Florida Medicaid PACE

Age 55+
General Florida resident, nursing home-level care need, safe with PACE support.
Income Limits (2025) ~$2,829/month 300% FBR
Asset Limits $2,000 (individual), $3,000 (couple).
FL

Limited to specific counties (e.g., Hillsborough, Miami-Dade); ~10 sites statewide.

Benefits
Personal care (5-7 hours/day) Medical care Meals Transportation Therapy

Optional State Supplementation (OSS)

Florida Optional State Supplementation

Age 65+ or disabled
General Florida resident, living in approved facility, receiving SSI or low-income.
Income Limits (2025) ~$1,004/month individual, including SSI
Asset Limits $2,000 (individual), $3,000 (couple).
FL

Limited to specific facility types; ~$78.40/month max supplement.

Benefits
Cash payment (~$78.40/month) for room/board or personal needs in facilities

Frequently Asked Questions about The Bridge at Ocala

What languages are spoken at The Bridge at Ocala?

The team at The Bridge at Ocala speaks English.

Who is the owner of The Bridge at Ocala?

The legal owner and operator of The Bridge at Ocala is Life Care Centers Of America, Inc.

Is The Bridge at Ocala in a walkable area?

The Bridge at Ocala has a walk score of 44. Somewhat walkable. A few nearby services may be reachable on foot, but most trips require transportation.

What is the license number of The Bridge at Ocala?

According to FL state health department records, The Bridge at Ocala's license number is 9612.

When does The Bridge at Ocala's license expire?

According to FL state health department records, The Bridge at Ocala's license expires on October 26, 2027.

What payment types does The Bridge at Ocala accept?

The Bridge at Ocala accepts Other.

Does The Bridge at Ocala operate as a for-profit or non-profit?

The Bridge at Ocala is registered as a for-profit in FL.

Guides for Better Senior Living

Care Cost Calculator: See Prices in Your Area

Nursing Home Data Explorer

Don’t Wait Too Long: 7 Red Flag Signs Your Parent Needs Assisted Living Now

The True Cost of Assisted Living in 2025 – And How Families Are Paying For It

Understanding Senior Living Costs: Pricing Models, Discounts & Financial Assistance

Explore Open Rooms
1 Contact details
2 What type of senior care service are you looking for?
3 What budget do you have in mind for senior care?
4 How soon do you need to find care?
5 Additional details

Thank you for your interest!

Our team will be in touch shortly to help with next steps.