Explore Open Rooms

1 Contact details
2 What type of senior care service are you looking for?
3 What budget do you have in mind for senior care?
4 How soon do you need to find care?
5 Additional details

Thank you for your interest!

Our team will be in touch shortly to help with next steps.

Nursing Home in Illinois

CMS overall rating Info The Overall CMS Rating combines results from health inspections, staffing levels and quality measures. Health inspections carry the most weight. Staffing and quality scores can increase or decrease the final rating based on performance compared to state and national standards.

The Grove at the Lake Living & Rehabilitation Center

2534 Elim Avenue, Zion, IL 60099 View map
Overview of The Grove at the Lake Living & Rehabilitation Center

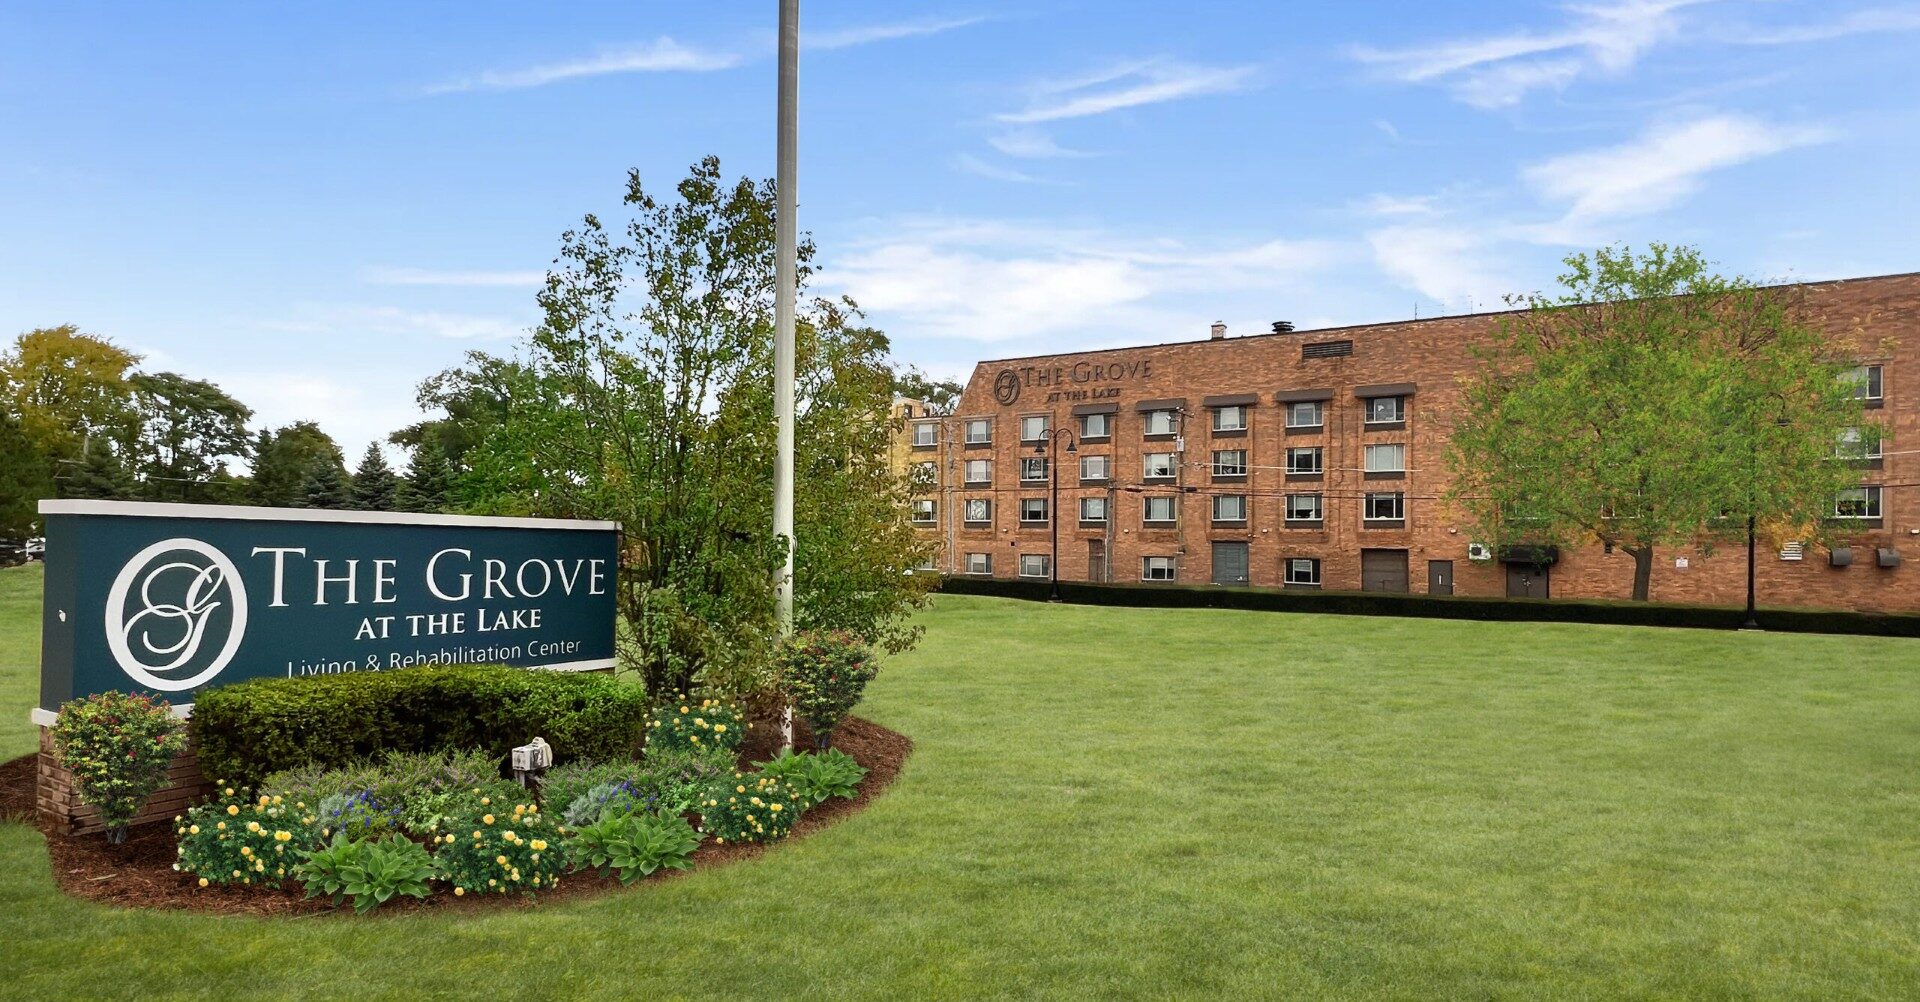
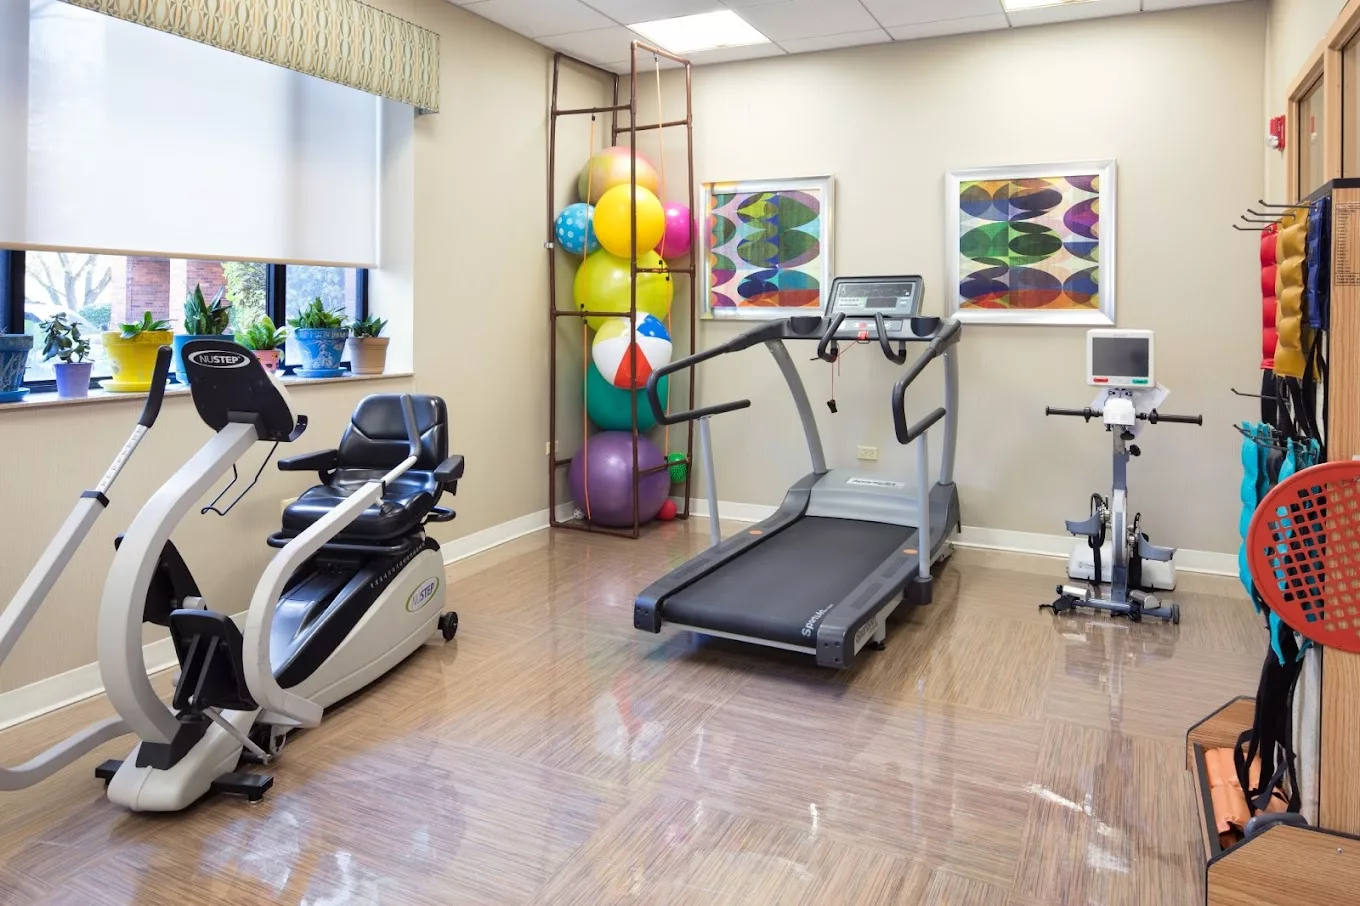
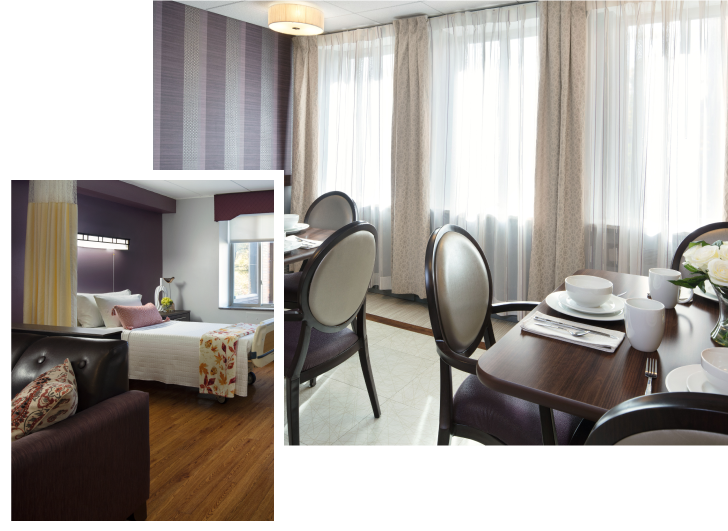
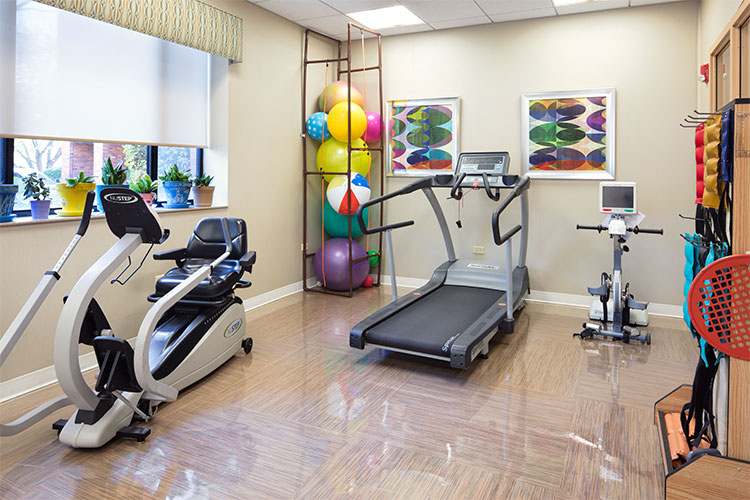
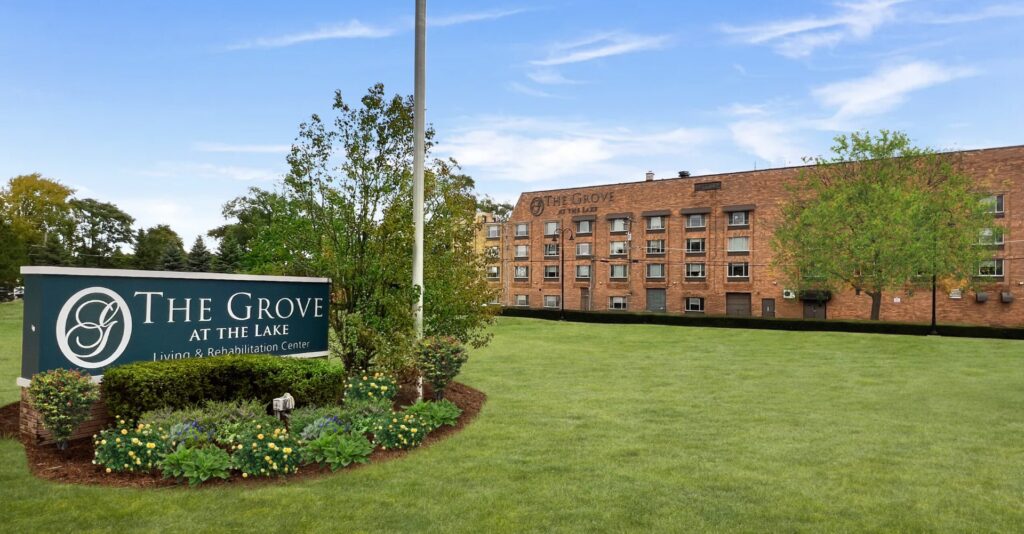
With a focus on the latest advances in clinical care, subacute nursing, and comprehensive therapies, residents in The Grove at the Lake can live their golden years without any worries. The facility offers an array of services to elevate the lives of seniors, including an on-site psychiatrist, full-time nurse practitioner, in-house hemodialysis, and specialized care for those with Alzheimer’s and respiratory issues. Palliative, hospice, and respite care are also available for those who need it.
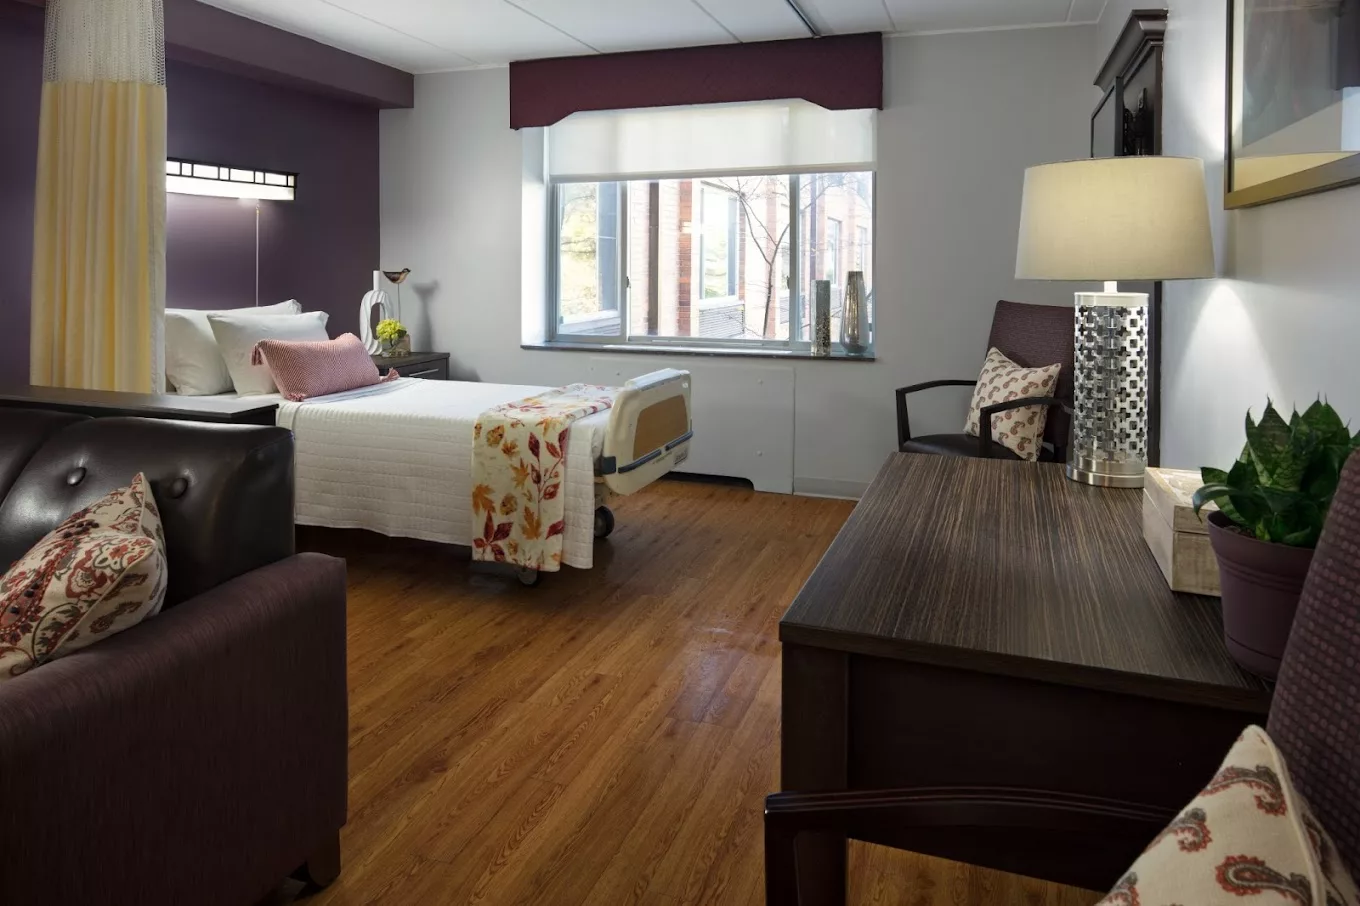
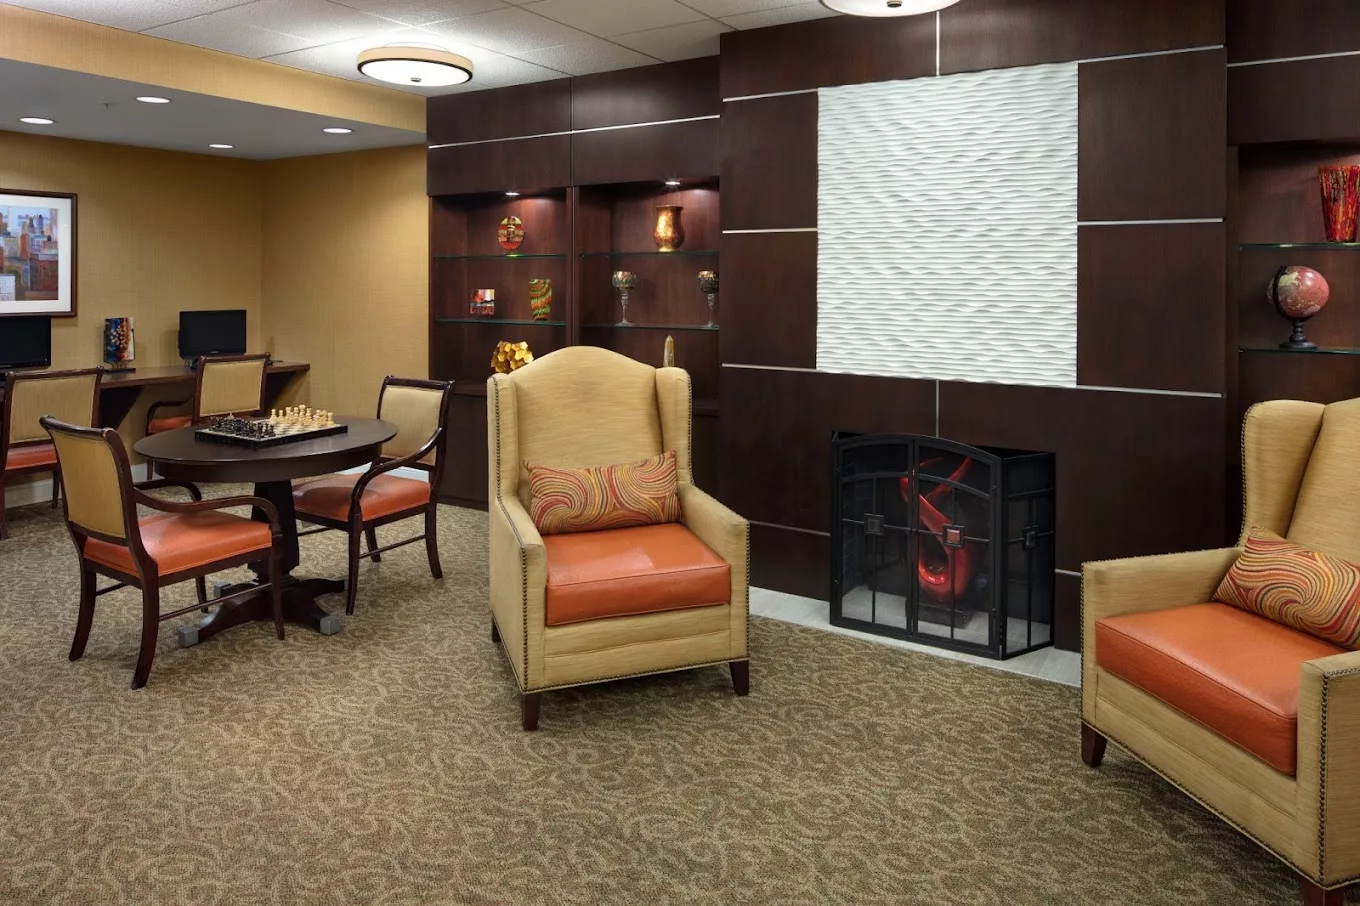
But it’s not just about the services – The Grove at the Lake has crafted a space that’s comfortable and exquisite, with stylish decor and cozy social spaces where residents can connect and their families. And when it comes to cuisine, they take it seriously. With an in-house chef and certified dietitian, they ensure that every meal is not only delicious but also nutritious. Salon services are also available on-site to help residents feel their best. There’s so much more that The Grove at the Lake has to offer, but it’s something that residents need to experience for themselves.

(847) 746-8435

Managed by Julie

Administrator

Julie serves as the administrator at The Grove at the Lake, playing a key role in fostering a nurturing and engaging environment. Known for her open-door policy and focus on recreational activities, she helps residents feel a strong sense of community and belonging, which supports their emotional and mental well-being during recovery.

Quality ratings

Measured by Centers for Medicare & Medicaid Services (CMS)

Overall rating Info The Overall CMS Rating combines results from health inspections, staffing levels and quality measures. Health inspections carry the most weight. Staffing and quality scores can increase or decrease the final rating based on performance compared to state and national standards.
1/5
Illinois average: 2.5/5
Health Inspection Info Based on the results of the facility's three most recent standard inspections and any complaint investigations. CMS reviews the number, scope, and severity of deficiencies, with more recent findings weighted more heavily.
2/5
Illinois average: 2.8/5
Staffing Info Measures average nursing staff hours per resident per day, including Registered Nurses (RNs) and total nursing staff. Ratings are adjusted based on the level of care residents require and are compared to state and national benchmarks.
1/5
Illinois average: 2.1/5
Quality Measures Info Based on clinical and physical health indicators reported to CMS, such as hospital readmissions, falls, pressure ulcers, and improvements in mobility. These measures reflect how well residents' health needs are being managed.
3/5
Illinois average: 2.8/5

Nursing care per resident

Info This shows how many total hours of nursing staff time are available per resident each day. Higher numbers usually mean more staff support.
2h 20m per day

This home provides 25% less nursing time per resident than the Illinois average.

Illinois average: 3h 6m per day

Staffing hours breakdown

Info Hours of care per resident per day, broken down by staff type. Data from CMS Medicare.
Staff type Facility State avg National avg
Registered Nurse (RN) Info Registered nurse hours per resident per day. 34m per day 44m per day 41m per day
Nurse Aide Info Nurse aide hours per resident per day. 1h 54m per day 2h 8m per day 2h 21m per day
Total Nursing (Weekend) Info Total number of nurse staff hours per resident per day on weekends. 3h 8m per day 3h 5m per day 3h 26m per day
RN (Weekend) Info Registered nurse hours per resident per day on weekends. 34m per day 34m per day 29m per day

Capacity and availability

High-capacity home

May provide extensive amenities, services and programs.

Total beds 244

This home usually has availability

Lower occupancy suggests more openings may be available.

Lower demand than the Illinois average
Occupancy rate 61.8%
Residents per day (avg) 151
Occupancy rate
61.8%
Residents per day (avg)
151

Who this home usually serves

TYPE OF STAY

Primarily long-term care, limited rehab

Most residents stay long-term, while a smaller portion are admitted for short-term rehab.

Might be optimal for
Long-term residence Daily assistance Occasional rehab needs

Breakdown by payment type

Medicare

13% of new residents, usually for short-term rehab.

Typical stay 29 days

Private pay

71% of new residents, often for short stays.

Typical stay 3 - 4 months

Medicaid

16% of new residents, often for long-term daily care.

Typical stay 3 months

Finances and operations

Privately-owned community
Home revenue
$24.1M
Operating loss
-$2.6M
Privately-owned community
Home revenue
$24,093,567.00
Operating loss
$-2,639,751.00
Payroll costs Info The portion of the home's budget spent on staff, including nurses, caregivers, and other employees who support care and operations.
$6.8M
28% of revenue
Other operating costs Info All remaining costs needed to run the home, such as food, utilities, building maintenance, supplies and administrative expenses.
$20.0M
Total costs $26.7M
Walk Score
Walk Score: 77 / 100
Very walkable. Most errands can be accomplished on foot, and many essentials are within a short walk.

About this community

Additional Licensing Details

AccreditationsGold Seal of Approval® Certification for Post-Acute Care and Accreditation for Nursing Care from The Joint Commission

Therapy & Rehabilitation

2 services
Rehabilitation Services
Short-Term Rehab

Staffing & Medical

2 services
Skilled Nursing
24-Hour Staffing

Amenities & Lifestyle

0 amenities
Specific ProgramsOn-Site Dialysis, Short-Term Rehabilitation, Respiratory Care, Wound Care, Cardiac Care
Contact The Grove at the Lake Living & Rehabilitation Center

Health Inspection History

Inspections
Total health inspections 17

Illinois average 10.4


Last Health inspection on Nov 2025

Total health citations 48

Illinois average 36.8

Citations per inspection
2.82

Illinois average 3.68


Health citations are formal notices following inspections when they fail to comply with safety and care standards.

27 of 48 citations resulted from standard inspections; and 21 of 48 resulted from complaint investigations.

Breakdown of citation severity (last 3 years)
Critical Health citations More info 1
43% worse than Illinois average

Illinois average: 0.7


Serious Health citations More info 3
17% better than Illinois average

Illinois average: 3.6

1 critical citation More info Illinois average: 0.7

3 serious citations More info Illinois average: 3.6

44 moderate citations More info Illinois average: 32

0 minor citations More info Illinois average: 0.5
Citations history (last 3 years)
Infection Control moderate citation Info Issues related to preventing and controlling infections, including hygiene practices and safety protocols. Nov 14, 2025
Corrected

Resident Rights moderate citation Info Issues related to resident's rights, including dignity, privacy, and the ability to make decisions about their care. Sep 22, 2025
Corrected

Quality of Care serious citation Info Issues related to how well residents receive appropriate treatment and support for their medical and daily care needs. Aug 08, 2025
Corrected

Resident Rights moderate citation Info Issues related to resident's rights, including dignity, privacy, and the ability to make decisions about their care. Dec 17, 2024
Corrected

Compare Nursing Homes around Illinois The information below is reported by the Illinois Department of Public Health, Office of Health Care Regulation.

5 facilities compared · CMS & IL Dept. of Health data · Updated Apr 2026

Filter by care type
Avantara Park Ridge
NH

Nursing Home Licensed facility providing 24/7 skilled nursing care for residents with complex, ongoing medical needs. Staffed by RNs, LPNs, and CNAs. Inspected and star-rated annually by CMS. Accepts Medicare (short-term rehab) and Medicaid (long-term care).

AL

Assisted Living A licensed, long-term care setting for seniors or individuals with disabilities who need help with daily activities — like bathing, dressing, and medication management — but not 24-hour skilled nursing. Offers housing, meals, and around-the-clock support while aiming to maximize resident independence.

Park Ridge
-
82.9%
+20%
3.06
-
-1%
3
0
0.0
0
137
-
70
Levy, Erin
$26.0M
$6.1M
23.7%
145667
Avantara Long Grove
NH

Nursing Home Licensed facility providing 24/7 skilled nursing care for residents with complex, ongoing medical needs. Staffed by RNs, LPNs, and CNAs. Inspected and star-rated annually by CMS. Accepts Medicare (short-term rehab) and Medicaid (long-term care).

AL

Assisted Living A licensed, long-term care setting for seniors or individuals with disabilities who need help with daily activities — like bathing, dressing, and medication management — but not 24-hour skilled nursing. Offers housing, meals, and around-the-clock support while aiming to maximize resident independence.

Long Grove
195
84.9%
+23%
2.60
+32%
-16%
0
27
3.4
0
168
-
34
Osei, Lily
$31.6M
$7.8M
24.8%
145868
The Grove at the Lake Living & Rehabilitation Center
NH

Nursing Home Licensed facility providing 24/7 skilled nursing care for residents with complex, ongoing medical needs. Staffed by RNs, LPNs, and CNAs. Inspected and star-rated annually by CMS. Accepts Medicare (short-term rehab) and Medicaid (long-term care).

AL

Assisted Living A licensed, long-term care setting for seniors or individuals with disabilities who need help with daily activities — like bathing, dressing, and medication management — but not 24-hour skilled nursing. Offers housing, meals, and around-the-clock support while aiming to maximize resident independence.

Zion
244
61.8%
-11%
2.34
-18%
-25%
2
48
2.8
4
151
-
77
Stangel, Julie
$23.6M
$6.8M
28.6%
145665
Avantara Aurora
-
NH

Nursing Home Licensed facility providing 24/7 skilled nursing care for residents with complex, ongoing medical needs. Staffed by RNs, LPNs, and CNAs. Inspected and star-rated annually by CMS. Accepts Medicare (short-term rehab) and Medicaid (long-term care).

AL

Assisted Living A licensed, long-term care setting for seniors or individuals with disabilities who need help with daily activities — like bathing, dressing, and medication management — but not 24-hour skilled nursing. Offers housing, meals, and around-the-clock support while aiming to maximize resident independence.

Aurora
-
-
-
-
-
-
-
-
-
0
0
0.0
0
-
-
31
-
-
-
-
-
Avantara Elgin
-
NH

Nursing Home Licensed facility providing 24/7 skilled nursing care for residents with complex, ongoing medical needs. Staffed by RNs, LPNs, and CNAs. Inspected and star-rated annually by CMS. Accepts Medicare (short-term rehab) and Medicaid (long-term care).

AL

Assisted Living A licensed, long-term care setting for seniors or individuals with disabilities who need help with daily activities — like bathing, dressing, and medication management — but not 24-hour skilled nursing. Offers housing, meals, and around-the-clock support while aiming to maximize resident independence.

Elgin
-
-
-
-
-
-
-
-
-
0
0
0.0
0
-
B-
45
-
-
-
-
-

Places of interest near The Grove at the Lake Living & Rehabilitation Center

Address 0.5 miles from city center — 0.17 miles to nearest hospital (Fresenius Medical Care at Midwestern Regional Medical Center)

Address 2534 Elim Avenue, Zion, IL 60099

Calculate Travel Distance to The Grove at the Lake Living & Rehabilitation Center

Add your location

Address

Staffing Data (Q2 2025)

This data corresponds to Q2 2025 and is based on CMS Payroll-Based Journal.

Total staff 285
Employees 132
Contractors 153
Staff to resident ratio 1.93:1
0% compared with Illinois average

Illinois average ratio: 1.90:1

Avg staff/day 79
Average shift 7.6 hours
0% compared with Illinois average

Illinois average: 7.6 hours

Total staff hours (quarter) 54,311
Nursing staff breakdown
Registered Nurse

Manages medical care and health needs.

Total count 33
Average shift length Info Average shift length. Calculated as total hours divided by days worked and average staff per day. 7.9 hours

This role is partially covered by contractors.

Licensed Practical Nurse

Assists with medical care and medications.

Total count 41
Average shift length Info Average shift length. Calculated as total hours divided by days worked and average staff per day. 7.7 hours

This role is partially covered by contractors.

Certified Nursing Assistant

Helps with daily care and mobility.

Total count 168
Average shift length Info Average shift length. Calculated as total hours divided by days worked and average staff per day. 8 hours

This role is partially covered by contractors.

Contractor staffing

Total hours from contractors

18.2%

9,866 contractor hours this quarter

Certified Nursing Assistant: 116 Registered Nurse: 16 Qualified Activities Professional: 8 Licensed Practical Nurse: 7 Speech Language Pathologist: 2 Physical Therapy Assistant: 2 Respiratory Therapy Technician: 1 Qualified Social Worker: 1
Staff by category
Certified Nursing Assistant5211616825,55191100%8
Licensed Practical Nurse347419,72891100%7.7
Registered Nurse1716336,10391100%7.9
Qualified Activities Professional108182,49891100%8.2
RN Director of Nursing4041,87791100%6.6
Clinical Nurse Specialist4041,83091100%6.6
Other Dietary Services Staff4041,58791100%7.2
Dental Services Staff3031,4779099%5.6
Physical Therapy Assistant0229798189%7.6
Dietitian1015028998%5.6
Mental Health Service Worker1015028998%5.6
Nurse Practitioner1014548290%5.5
Speech Language Pathologist0224466470%7
Administrator1014388088%5.5
Qualified Social Worker0112163640%6
Respiratory Therapy Technician0111253336%3.8
168 Certified Nursing Assistant
% of Days 100%
41 Licensed Practical Nurse
% of Days 100%
33 Registered Nurse
% of Days 100%
18 Qualified Activities Professional
% of Days 100%
4 RN Director of Nursing
% of Days 100%
4 Clinical Nurse Specialist
% of Days 100%
4 Other Dietary Services Staff
% of Days 100%
3 Dental Services Staff
% of Days 99%
2 Physical Therapy Assistant
% of Days 89%
1 Dietitian
% of Days 98%
1 Mental Health Service Worker
% of Days 98%
1 Nurse Practitioner
% of Days 90%
2 Speech Language Pathologist
% of Days 70%
1 Administrator
% of Days 88%
1 Qualified Social Worker
% of Days 40%
1 Respiratory Therapy Technician
% of Days 36%

Facility Characteristics

Source: CMS Long-Term Care Facility Characteristics (Data as of Jan 2026)

Total census
148 residents
Residents by payment source
Medicare
3 residents (2%)
Medicaid
115 residents (77.7%)
Private pay or other
30 residents (20.3%)
Programs & Services
Residents' Group

Residents meet regularly to discuss policies, care quality, and activities

Active Resident Council

Organized group of residents that meets regularly to discuss facility policies, quality of life, and activities.

Quality of care over time

These measures show how residents usually do over time at this home, based on health outcomes and preventive care.

High-risk clinical events score Info A composite score based on pressure ulcers, falls with injury, weight loss, walking ability decline, and activities of daily living decline. 4.7
52% better than Illinois average

Illinois average: 9.7

Functional decline score Info A composite score based on activities of daily living decline, walking ability decline, and incontinence. 8.7
53% better than Illinois average

Illinois average: 18.6

Long-stay resident measures
Average Illinois avg: 3.6 Info CMS star rating based on long-stay quality measure performance. 5 stars = significantly above average, 1 star = significantly below average.
Need for Help with Daily Activities Increased Info Percent of long-stay residents whose need for help with daily activities has increased 3.1%
80% better than Illinois average

Illinois average: 15.5%

Walking Ability Worsened Info Percent of long-stay residents whose ability to move independently worsened 3.7%
80% better than Illinois average

Illinois average: 18.4%

Low Risk Residents with Bowel/Bladder Incontinence Info Percent of low risk long-stay residents who lose control of their bowels or bladder 19.1%
11% better than Illinois average

Illinois average: 21.6%

Falls with Major Injury Info Percent of long-stay residents experiencing one or more falls with major injury 3.0%
12% better than Illinois average

Illinois average: 3.4%

High Risk Residents with Pressure Ulcers Info Percent of long-stay high risk residents with pressure ulcers 6.4%
22% worse than Illinois average

Illinois average: 5.3%

Urinary Tract Infection Info Percent of long-stay residents with a urinary tract infection 0.2%
89% better than Illinois average

Illinois average: 1.8%

Lost Too Much Weight Info Percent of long-stay residents who lose too much weight 7.2%
10% worse than Illinois average

Illinois average: 6.5%

Depressive Symptoms Info Percent of long-stay residents who have depressive symptoms 98.6%
105% worse than Illinois average

Illinois average: 48.1%

Antipsychotic Use Info Percent of long-stay residents who received an antipsychotic medication 20.4%
In line with Illinois average

Illinois average: 20.2%

Pneumococcal Vaccine Info Percent of long-stay residents assessed and appropriately given the pneumococcal vaccine 90.0%
In line with Illinois average

Illinois average: 89.2%

Influenza Vaccine Info Percent of long-stay residents assessed and appropriately given the seasonal influenza vaccine 89.9%
In line with Illinois average

Illinois average: 91.6%

Hospitalizations per 1,000 days Info Number of hospitalizations per 1,000 long-stay resident days. 2.54
24% worse than Illinois average

Illinois average: 2.05

ED visits per 1,000 days Info Number of outpatient emergency department visits per 1,000 long-stay resident days. 2.93
30% worse than Illinois average

Illinois average: 2.25

Short-stay resident measures
Below average Illinois avg: 2.0 Info CMS star rating based on short-stay quality measure performance. 5 stars = much above average, 1 star = much below average.
Pneumococcal Vaccine Info Percent of short-stay residents assessed and appropriately given the pneumococcal vaccine 46.6%
32% worse than Illinois average

Illinois average: 68.3%

Antipsychotic medication increase Info Percent of short-stay residents who newly received an antipsychotic medication 2.2%
5% better than Illinois average

Illinois average: 2.3%

Influenza Vaccine Info Percent of short-stay residents assessed and appropriately given the seasonal influenza vaccine 58.0%
8% worse than Illinois average

Illinois average: 63.0%

Re-hospitalized after SNF stay Info Percentage of short-stay residents who were re-hospitalized after their nursing home admission. 21.0%
20% better than Illinois average

Illinois average: 26.2%

Emergency department visits Info Percentage of short-stay residents who had an outpatient emergency department visit. 13.0%
7% better than Illinois average

Illinois average: 14.0%

Falls with major injury Info Percentage of SNF residents who experience falls with major injury during their stay. 1.3%
65% worse than Illinois average

Illinois average: 0.8%

Ability to care for self at discharge Info Percentage of residents at or above expected ability to care for themselves at discharge. 53.3%
In line with Illinois average

Illinois average: 53.7%

Successful return to home or community Info Rate of successful return to home or community from a skilled nursing facility. 45.8%
9% worse than Illinois average

Illinois average: 50.6%

Penalties and fines

Federal penalties imposed by CMS for regulatory violations, including civil money penalties (fines) and denials of payment for new Medicare/Medicaid admissions.

Source: CMS Penalties Database (Data as of Jan 2026)

Total fines amount $59K
58% lower than Illinois average

Illinois average: $143K

Number of fines 2
33% fewer fines than Illinois average

Illinois average: 3.0

Payment Denials Info Serious action where Medicare and/or Medicaid temporarily stops payments for new residents until issues are fixed. 1
6% fewer payment denials than Illinois average

Illinois average: 1.1

Fines amount comparison
This facility $59K
Illinois average $143K
Penalty History

Penalties are imposed by CMS for violations of federal nursing home regulations.

Civil Money Penalty Info Fines imposed for noncompliance, which can be assessed per day or per instance of violation. Jul 15, 2024
$30K
Civil Money Penalty Info Fines imposed for noncompliance, which can be assessed per day or per instance of violation. Sep 27, 2023
$29K
Payment Denial Info Serious action where Medicare and/or Medicaid temporarily stops payments for new residents until issues are fixed. Sep 27, 2023
7 days

Last updated: Jan 2026

Guides for Better Senior Living

Care Cost Calculator: See Prices in Your Area

Nursing Home Data Explorer

Don’t Wait Too Long: 7 Red Flag Signs Your Parent Needs Assisted Living Now

The True Cost of Assisted Living in 2025 – And How Families Are Paying For It

Understanding Senior Living Costs: Pricing Models, Discounts & Financial Assistance

Financial Aid for Illinois Seniors

Get financial aid guidance

Community Care Program

Illinois CCP

Age 60+, Illinois resident, at risk of nursing home placement.

~$1,215/month (individual).

$17,500 (individual, excludes home, car).

High demand in urban areas; waitlists possible.

Illinois Respite Program

IL Respite (via NFCSP)

Caregiver of someone 60+ (or with dementia), Illinois resident.

No strict limit; prioritizes low-income.

Not applicable.

Limited slots; urban/rural balance.

Supportive Living Program (SLP)

Illinois Medicaid Supportive Living Program

Age 65+ or 22-64 with disability, Illinois resident, Medicaid-eligible, needs moderate assistance (not nursing home-level).

~$2,829/month (300% FBR, individual); QIT allowed.

$2,000 (individual), $3,000 (couple) (excludes home, car).

~200 SLP sites statewide; room/board not covered.

Persons Who Are Elderly Waiver

Illinois Medicaid Elderly Waiver

Age 65+, Illinois resident, Medicaid-eligible, nursing home-level care need.

~$2,829/month (300% FBR, individual).

$2,000 (individual), $3,000 (couple).

Part of HealthChoice Illinois; consumer-directed options available.

Medicare Savings Program (MSP)

Illinois Medicare Savings Program

Age 65+ or disabled, Illinois resident, Medicare Part A/B.

~$2,510/month (QMB), ~$3,380/month (SLMB), ~$3,598/month (QI)—individual.

$9,430 (individual), $14,130 (couple).

Three tiers; no waitlist.

Senior Community Service Employment Program (SCSEP)

Illinois SCSEP

Age 55+, unemployed, low-income, Illinois resident.

~$1,983/month (125% FPL).

Not specified; income-focused.

Priority for veterans, rural residents.

Optional State Supplementation (OSS)

Illinois Optional State Supplementation

Age 65+ or disabled, Illinois resident, in approved facility, SSI recipient or low-income.

~$1,004/month (including SSI).

$2,000 (individual), $3,000 (couple).

~$50-$500/month based on facility type.

VA Aid and Attendance (A&A) and Housebound Benefits

Illinois VA Aid and Attendance/Housebound

Age 65+ or disabled veteran/spouse, Illinois resident, wartime service, need for ADL help (A&A) or homebound.

Net income < ~$1,984/month (veteran with dependent, A&A); pension offsets income.

~$155,356 (net worth limit).

High veteran demand in urban/rural areas.