The Grove at the Lake Living & Rehabilitation Center
Nursing Home · Illinois, IL
CMS overall rating Info The Overall CMS Rating is scored from 1 to 5 stars and combines results from health inspections, staffing levels, and quality measures. Health inspections carry the most weight. Staffing and quality scores can increase or decrease the final rating based on performance compared to state and national standards.

The Grove at the Lake Living & Rehabilitation Center

Nursing Home · Illinois, IL
CMS overall rating Info The Overall CMS Rating is scored from 1 to 5 stars and combines results from health inspections, staffing levels, and quality measures. Health inspections carry the most weight. Staffing and quality scores can increase or decrease the final rating based on performance compared to state and national standards.
Calculator: See prices in your area
The Grove at the Lake Living & Rehabilitation Center accepts Medicare, Medicaid, and private pay.

Overview of The Grove at the Lake Living & Rehabilitation Center

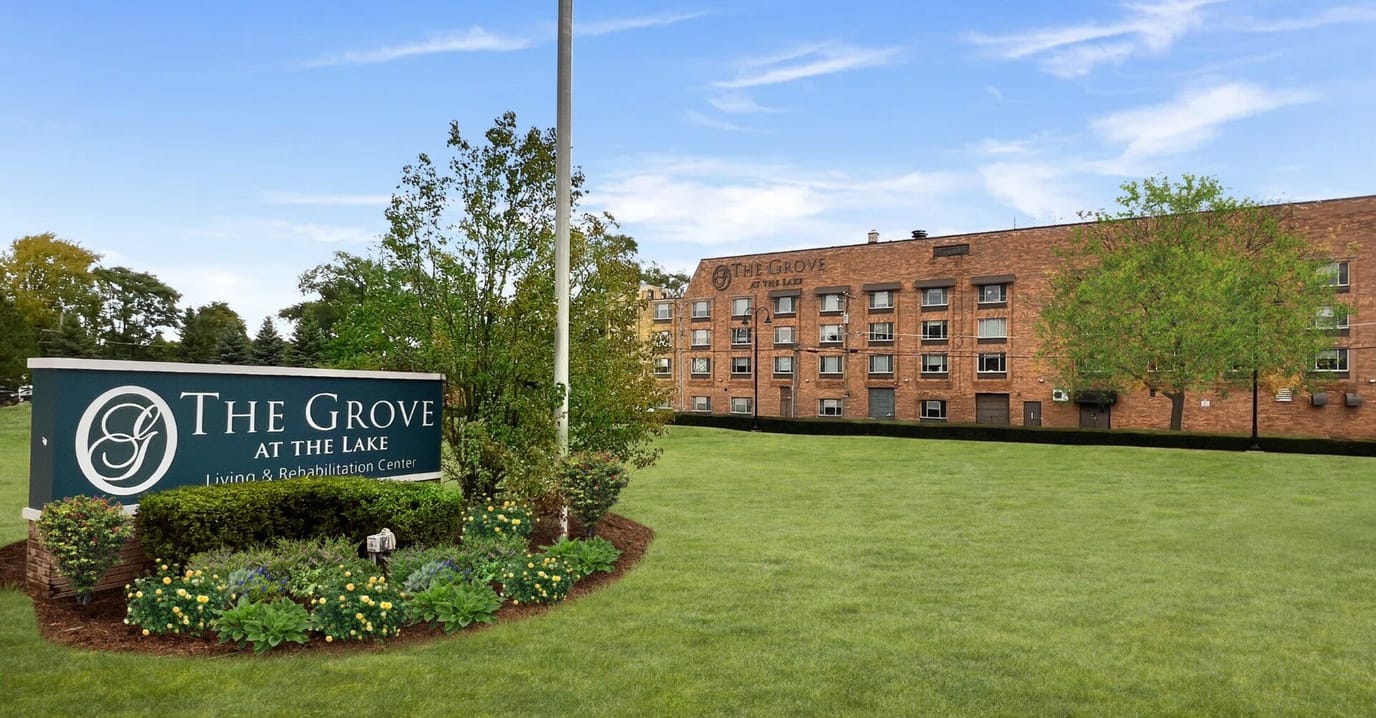
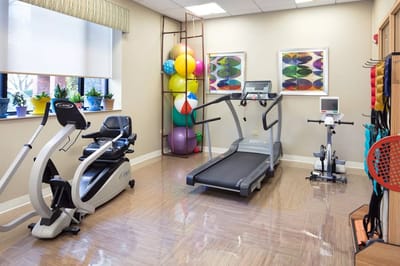
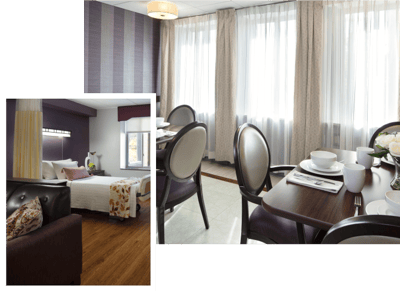
With a focus on the latest advances in clinical care, subacute nursing, and comprehensive therapies, residents in The Grove at the Lake can live their golden years without any worries. The facility offers an array of services to elevate the lives of seniors, including an on-site psychiatrist, full-time nurse practitioner, in-house hemodialysis, and specialized care for those with Alzheimer’s and respiratory issues. Palliative, hospice, and respite care are also available for those who need it.
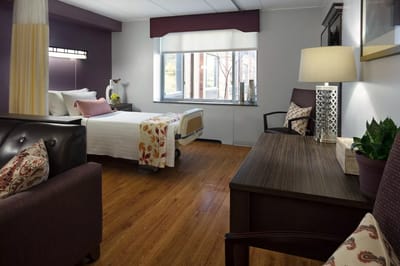
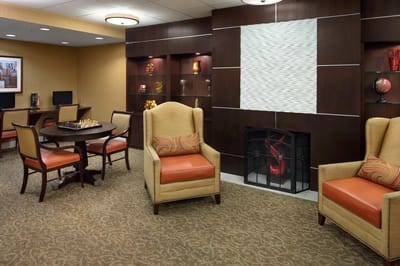
But it’s not just about the services – The Grove at the Lake has crafted a space that’s comfortable and exquisite, with stylish decor and cozy social spaces where residents can connect and their families. And when it comes to cuisine, they take it seriously. With an in-house chef and certified dietitian, they ensure that every meal is not only delicious but also nutritious. Salon services are also available on-site to help residents feel their best. There’s so much more that The Grove at the Lake has to offer, but it’s something that residents need to experience for themselves.

(847) 746-8435

Quality ratings

Measured by Centers for Medicare & Medicaid Services (CMS)

Overall rating Info The Overall CMS Rating combines results from health inspections, staffing levels and quality measures. Health inspections carry the most weight. Staffing and quality scores can increase or decrease the final rating based on performance compared to state and national standards.
▼ 60.3% Below IL avg. ▼ 60.3% Below IL avg.Click the badge to see the full State ranking.Click here to see the full State ranking.
Health Inspection Info Based on the results of the facility's three most recent standard inspections and any complaint investigations. CMS reviews the number, scope, and severity of deficiencies, with more recent findings weighted more heavily.
▼ 28.0% Below IL avg. ▼ 28.0% Below IL avg.Click the badge to see the full State ranking.Click here to see the full State ranking.
Staffing Info Measures average nursing staff hours per resident per day, including Registered Nurses (RNs) and total nursing staff. Ratings are adjusted based on the level of care residents require and are compared to state and national benchmarks.
▼ 53.2% Below IL avg. ▼ 53.2% Below IL avg.Click the badge to see the full State ranking.Click here to see the full State ranking.
Quality Measures Info Based on clinical and physical health indicators reported to CMS, such as hospital readmissions, falls, pressure ulcers, and improvements in mobility. These measures reflect how well residents' health needs are being managed.
▲ 6.6% Above IL avg. ▲ 6.6% Above IL avg.Click the badge to see the full State ranking.Click here to see the full State ranking.

Staffing hours breakdown

Info Daily nursing hours per resident by staff type, reported to CMS. Higher is generally better — compare this facility to state and national averages to see where staffing stands.

Hours per resident per day — compared to Illinois state averages

Total nursing care / resident Info This home is ranked 141st out of 167 homes in Illinois. Total adjusted nursing hours per resident per day, combining RN, LPN, and aide time. CMS adjusts this for case-mix so facilities can be fairly compared.
2h 20m per day
Rank #141 / 167Nurse hours — State benchmarkedThis home is ranked 141st out of 167 homes in Illinois. Shows adjusted nurse hours per resident per day benchmarked to the Illinois average, with a ranking across 167 Illinois SNFs. More hours mean more direct care. The national average is about 3.5 hrs; below 3.0 is a red flag.Click the rank badge to see the full State ranking.Click here to see the full State ranking.
This facility Illinois avg (3h 6m per day)
vs Illinois avg
-25%

2 of 5 metrics below state avg

Standout metric LPN / LVN is +32% above state avg
Staff typeHours / Day / Residentvs state avg
Registered Nurse (RN) Info RNs hold the highest nursing license and can assess residents, interpret test results, and direct care plans. More RN hours per day often signals stronger clinical oversight and faster response to health changes. 34m per day ▼ 23% State avg: 44m per day · National avg: 41m per day
LPN / LVN Info Licensed Practical Nurses (LPNs) or Licensed Vocational Nurses (LVNs) deliver routine hands-on care — medication administration, wound dressing, and monitoring vital signs. They work under RN supervision and make up a large share of daily bedside care. 50m per day ▲ 32% State avg: 38m per day · National avg: 52m per day
Nurse Aide Info Certified Nurse Aides (CNAs) provide the most direct day-to-day assistance: bathing, dressing, feeding, and mobility. Nurse aide hours are typically the largest staffing category and directly affect residents' quality of life. 1h 54m per day ▼ 11% State avg: 2h 8m per day · National avg: 2h 21m per day
Weekend Total Nursing Info Combined nursing hours (RN + LPN + Nurse Aide) per resident per day on weekends. Staffing often drops on weekends — this figure reveals whether the facility maintains adequate coverage outside of weekday hours. 3h 9m per day ■ Avg State avg: 3h 5m per day · National avg: 3h 26m per day
Weekend RN Info Registered nurse hours specifically on weekends. Facilities sometimes reduce RN presence on Saturdays and Sundays — a low weekend RN figure compared to weekday hours can indicate reduced clinical oversight when most administrative staff are absent. 34m per day ■ Avg State avg: 34m per day · National avg: 29m per day

Capacity and availability

This home usually has availability

Lower occupancy than the Illinois average: 69.3%
Occupancy rate
61.8% Rank #149 / 199Occupancy rate — State benchmarkedThis home is ranked 149th out of 199 homes in Illinois. Shows this facility's occupancy rate versus the Illinois average, with its Statewide rank out of 199. Higher occupancy signals strong local demand and financial stability.Click the rank badge to see the full State ranking.Click here to see the full State ranking.
Avg. Length of Stay
87 days
Walk Score
Walk Score: 77 / 100 Rank #121 / 648Walk Score — State benchmarkedThis home is ranked 121st out of 648 homes in Illinois. Shows how walkable this facility's neighborhood is compared to the average Walk Score across Illinois SNFs. Higher scores benefit residents, families, and staff.Click the rank badge to see the full State ranking.Click here to see the full State ranking.
Very walkable. Most errands can be accomplished on foot, and many essentials are within a short walk.

About this community

License Details

AccreditationsGold Seal of Approval® Certification for Post-Acute Care and Accreditation for Nursing Care from The Joint Commission

Therapy & Rehabilitation

2 services
Rehabilitation Services
Short-Term Rehab

Staffing & Medical

1 service
24-Hour Staffing

Amenities & Lifestyle

Specific ProgramsOn-Site Dialysis, Short-Term Rehabilitation, Respiratory Care, Cardiac Care

Contact The Grove at the Lake Living & Rehabilitation Center

Staffing Data

Reporting period: October 1 – December 31, 2025 (Q4 2025). Source: CMS Payroll-Based Journal report.

Total staff 285
Employees 144
Contractors 141
Staff to resident ratio 1.93:1
7% better than Illinois average
Illinois average ratio: 1.80:1 Illinois average ratio: 1.80:1See full Illinois ranking
Avg staff/day 81
Average shift 7.3 hours
0% compared with Illinois average
Illinois average: 7.6 hours Illinois average shift: 7.6 hoursSee full Illinois ranking
Total staff hours (quarter) 54,124

Nursing staff breakdown

Q4 2025 · Oct 1 – Dec 31 More info This data comes from the CMS Payroll-Based Journal report covering October 1 – December 31, 2025.
Registered Nurse

Manages medical care and health needs.

RN Staff 21
Average shift length Info Average shift length. Calculated as total hours divided by days worked and average staff per day. 7.7 hours

This role is partially covered by contractors.

Licensed Practical Nurse

Assists with medical care and medications.

LPN Staff 30
Average shift length Info Average shift length. Calculated as total hours divided by days worked and average staff per day. 7.6 hours

No contractors work on this role.

Certified Nursing Assistant

Helps with daily care and mobility.

CNA Staff 184
Average shift length Info Average shift length. Calculated as total hours divided by days worked and average staff per day. 7.6 hours

This role is partially covered by contractors.

Contractor staffing

Q4 2025 · Oct 1 – Dec 31 More info This data comes from the CMS Payroll-Based Journal report covering October 1 – December 31, 2025.

Total hours from contractors

8.6%

4,670 contractor hours this quarter

Certified Nursing Assistant: 119 Qualified Activities Professional: 6 Speech Language Pathologist: 4 Respiratory Therapy Technician: 4 Registered Nurse: 3 Physical Therapy Aide: 3 Physical Therapy Assistant: 1 Qualified Social Worker: 1

Staff by category

Q4 2025 · Oct 1 – Dec 31 More info This data comes from the CMS Payroll-Based Journal report covering October 1 – December 31, 2025.
Certified Nursing Assistant6511918425,79592100%7.6
Licensed Practical Nurse300309,05692100%7.6
Registered Nurse183216,51092100%7.7
Qualified Activities Professional116172,37092100%8.6
Other Dietary Services Staff4041,89192100%7.4
Clinical Nurse Specialist5051,81092100%6.1
RN Director of Nursing4041,6809098%5.6
Dental Services Staff3031,5239199%5.6
Physical Therapy Aide0335877177%6.6
Mental Health Service Worker1015008997%5.6
Dietitian1014928795%5.6
Nurse Practitioner1014868795%5.6
Administrator1014227784%5.5
Speech Language Pathologist0443055863%5
Qualified Social Worker0112843841%7.5
Respiratory Therapy Technician0442796065%3.9
Physical Therapy Assistant0111374043%3.4
184 Certified Nursing Assistant
% of Days 100%
30 Licensed Practical Nurse
% of Days 100%
21 Registered Nurse
% of Days 100%
17 Qualified Activities Professional
% of Days 100%
4 Other Dietary Services Staff
% of Days 100%
5 Clinical Nurse Specialist
% of Days 100%
4 RN Director of Nursing
% of Days 98%
3 Dental Services Staff
% of Days 99%
3 Physical Therapy Aide
% of Days 77%
1 Mental Health Service Worker
% of Days 97%
1 Dietitian
% of Days 95%
1 Nurse Practitioner
% of Days 95%
1 Administrator
% of Days 84%
4 Speech Language Pathologist
% of Days 63%
1 Qualified Social Worker
% of Days 41%
4 Respiratory Therapy Technician
% of Days 65%
1 Physical Therapy Assistant
% of Days 43%

Penalties and fines

Includes penalties issued in 2023-2024

Federal penalties imposed by CMS for regulatory violations, including civil money penalties (fines) and denials of payment for new Medicare/Medicaid admissions.

Source: CMS Penalties Database (Data as of Jan 2026)

Total fines amount $59K Rank #109 / 168Federal fines — State benchmarkedThis home is ranked 109th out of 168 homes in Illinois. Shows this facility's cumulative CMS federal fine dollars versus the Illinois average among facilities with fines, and where it ranks among 168 skilled nursing facilities in the pool. Lower total dollars mean a better rank.Click the rank badge to see the full State ranking.Click here to see the full State ranking.
58% lower than Illinois average

Illinois average: $143K

Number of fines 2
33% fewer fines than Illinois average

Illinois average: 3.0

Payment Denials Info Serious action where Medicare and/or Medicaid temporarily stops payments for new residents until issues are fixed. 1
6% fewer payment denials than Illinois average

Illinois average: 1.1

Fines amount comparison
This facility $59K
Illinois average $143K
Penalty History

Penalties are imposed by CMS for violations of federal nursing home regulations.

3 penalties in the past 3 years

Multiple penalties were reported in the last 3 years.

Civil Money Penalty Info Fines imposed for noncompliance, which can be assessed per day or per instance of violation. Jul 15, 2024
$30K
Civil Money Penalty Info Fines imposed for noncompliance, which can be assessed per day or per instance of violation. Sep 27, 2023
$29K
Payment Denial Info Serious action where Medicare and/or Medicaid temporarily stops payments for new residents until issues are fixed. Sep 27, 2023
7 days

Last updated: Jan 2026

Quality of care over time

These measures show how residents usually do over time at this home, based on health outcomes and preventive care.

High-risk clinical events score Info A composite score based on pressure ulcers, falls with injury, weight loss, walking ability decline, and activities of daily living decline. 4.7
52% better than Illinois average

Illinois average: 9.7

Functional decline score Info A composite score based on activities of daily living decline, walking ability decline, and incontinence. 8.7
53% better than Illinois average

Illinois average: 18.6

Long-stay resident measures
Average Illinois avg: 3.6 Info CMS star rating based on long-stay quality measure performance. 5 stars = significantly above average, 1 star = significantly below average.
Need for Help with Daily Activities Increased Info Percent of long-stay residents whose need for help with daily activities has increased 3.1%
80% better than Illinois average

Illinois average: 15.5%

Walking Ability Worsened Info Percent of long-stay residents whose ability to move independently worsened 3.7%
80% better than Illinois average

Illinois average: 18.4%

Low Risk Residents with Bowel/Bladder Incontinence Info Percent of low risk long-stay residents who lose control of their bowels or bladder 19.1%
11% better than Illinois average

Illinois average: 21.6%

Falls with Major Injury Info Percent of long-stay residents experiencing one or more falls with major injury 3.0%
12% better than Illinois average

Illinois average: 3.4%

High Risk Residents with Pressure Ulcers Info Percent of long-stay high risk residents with pressure ulcers 6.4%
22% worse than Illinois average

Illinois average: 5.3%

Urinary Tract Infection Info Percent of long-stay residents with a urinary tract infection 0.2%
89% better than Illinois average

Illinois average: 1.8%

Lost Too Much Weight Info Percent of long-stay residents who lose too much weight 7.2%
10% worse than Illinois average

Illinois average: 6.5%

Depressive Symptoms Info Percent of long-stay residents who have depressive symptoms 98.6%
105% worse than Illinois average

Illinois average: 48.1%

Antipsychotic Use Info Percent of long-stay residents who received an antipsychotic medication 20.4%
In line with Illinois average

Illinois average: 20.2%

Pneumococcal Vaccine Info Percent of long-stay residents assessed and appropriately given the pneumococcal vaccine 90.0%
In line with Illinois average

Illinois average: 89.2%

Influenza Vaccine Info Percent of long-stay residents assessed and appropriately given the seasonal influenza vaccine 89.9%
In line with Illinois average

Illinois average: 91.6%

Hospitalizations per 1,000 days Info Number of hospitalizations per 1,000 long-stay resident days. 2.54
24% worse than Illinois average

Illinois average: 2.05

ED visits per 1,000 days Info Number of outpatient emergency department visits per 1,000 long-stay resident days. 2.93
30% worse than Illinois average

Illinois average: 2.25

Short-stay resident measures
Below average Illinois avg: 2.3 Info CMS star rating based on short-stay quality measure performance. 5 stars = much above average, 1 star = much below average.
Pneumococcal Vaccine Info Percent of short-stay residents assessed and appropriately given the pneumococcal vaccine 46.6%
32% worse than Illinois average

Illinois average: 68.3%

Antipsychotic medication increase Info Percent of short-stay residents who newly received an antipsychotic medication 2.2%
5% better than Illinois average

Illinois average: 2.3%

Influenza Vaccine Info Percent of short-stay residents assessed and appropriately given the seasonal influenza vaccine 58.0%
8% worse than Illinois average

Illinois average: 63.0%

Re-hospitalized after SNF stay Info Percentage of short-stay residents who were re-hospitalized after their nursing home admission. 21.0%
20% better than Illinois average

Illinois average: 26.2%

Emergency department visits Info Percentage of short-stay residents who had an outpatient emergency department visit. 13.0%
7% better than Illinois average

Illinois average: 14.0%

Falls with major injury Info Percentage of SNF residents who experience falls with major injury during their stay. 1.3%
65% worse than Illinois average

Illinois average: 0.8%

Ability to care for self at discharge Info Percentage of residents at or above expected ability to care for themselves at discharge. 53.3%
In line with Illinois average

Illinois average: 53.7%

Successful return to home or community Info Rate of successful return to home or community from a skilled nursing facility. 45.8%
9% worse than Illinois average

Illinois average: 50.6%

Breakdown by payment type

Medicare

13% of new residents, usually for short-term rehab.

Typical stay 29 days

Private pay

71% of new residents, often for short stays.

Typical stay 3 - 4 months

Medicaid

16% of new residents, often for long-term daily care.

Typical stay 3 months

Facility Characteristics

Source: CMS Long-Term Care Facility Characteristics (Data as of Jan 2026)

Total residents 148
Medicare
3
2% of residents
Medicaid
115
77.7% of residents
Private pay or other
30
20.3% of residents
Programs & Services
Residents Group

Residents meet regularly to discuss policies, care quality, and activities

Active Resident Council

Organized group of residents that meets regularly to discuss facility policies, quality of life, and activities.

Finances and operations

Privately-owned community
Home revenue
$24.1M
Operating loss
-$2.6M
Privately-owned community
Home revenue
$24.1M Rank #43 / 166Revenue — State benchmarkedThis home is ranked 43rd out of 166 homes in Illinois. Shows this facility's annual revenue compared to the Illinois SNF average. Higher revenue generally means more resources for staffing and capital — read alongside Payroll %.Click the rank badge to see the full State ranking.Click here to see the full State ranking.
Operating loss
-$2.6M
Payroll costs Info The portion of the home's budget spent on staff, including nurses, caregivers, and other employees who support care and operations. Rank #41 / 166Payroll — State benchmarkedThis home is ranked 41st out of 166 homes in Illinois. Shows total annual staff payroll benchmarked to the Illinois average. Higher payroll investment relative to peers often signals better staffing and less reliance on cheaper contract labor.Click the rank badge to see the full State ranking.Click here to see the full State ranking.
$10.5M
43.4% of revenue Rank #106 / 166Payroll % — State benchmarkedThis home is ranked 106th out of 166 homes in Illinois. Shows payroll as a percentage of revenue versus the Illinois average. Well-run Illinois SNFs typically land around 54–67% — the top third Statewide. Below 25% may signal understaffing or heavy agency use — read with Staffing ratings.Click the rank badge to see the full State ranking.Click here to see the full State ranking.
Other operating costs Info All remaining costs needed to run the home, such as food, utilities, building maintenance, supplies and administrative expenses.
$16.3M
Total costs $26.7M

Who this home usually serves

TYPE OF STAY

Primarily long-term care, limited rehab

Most residents stay long-term, while a smaller portion are admitted for short-term rehab.

Managed by Julie

Administrator

Julie serves as the administrator at The Grove at the Lake, playing a key role in fostering a nurturing and engaging environment. Known for her open-door policy and focus on recreational activities, she helps residents feel a strong sense of community and belonging, which supports their emotional and mental well-being during recovery.

Places of interest near The Grove at the Lake Living & Rehabilitation Center

Address 0.5 miles from city center Info Estimated distance in miles from Zion's city center to The Grove at the Lake Living & Rehabilitation Center's address, calculated via Google Maps. — 0.17 miles to nearest hospital (Fresenius Medical Care at Midwestern Regional Medical Center)

Calculate Travel Distance to The Grove at the Lake Living & Rehabilitation Center

Add your location

Address

Financial Assistance for
Nursing Home in Illinois

The Grove at the Lake Living & Rehabilitation Center is located in Zion, Illinois.
Here are the financial assistance programs available to residents in Illinois.

Get Financial aid guidance

Community Care Program

Illinois CCP

Age 60+
General Illinois resident, at risk of nursing home placement.
Income Limits (2025) ~$1,215/month individual
Asset Limits $17,500 individual, excludes home, car
IL

High demand in urban areas; waitlists possible.

Benefits
In-home care (3-5 hours/day) Adult day services ($65/day) Emergency home response systems ($30/month)

Illinois Respite Program

IL Respite (via NFCSP)

Age Caregiver of someone 60+ (or with dementia)
General Illinois resident.
Income Limits No strict limit; prioritizes low-income.
Asset Limits Not applicable.
IL

Limited slots; urban/rural balance.

Benefits
In-home respite (4-6 hours/day) Adult day care (~$65/day) Short-term facility care (up to 5 days)

Supportive Living Program (SLP)

Illinois Medicaid Supportive Living Program

Age 65+ or 22-64 with disability
General Illinois resident, Medicaid-eligible, needs moderate assistance (not nursing home-level).
Income Limits (2025) ~$2,829/month (300% FBR, individual); QIT allowed.
Asset Limits $2,000 (individual), $3,000 (couple) (excludes home, car).
IL

~200 SLP sites statewide; room/board not covered.

Benefits
Personal care (5-7 hours/day, e.g., bathing, mobility) Meals Housekeeping Medication management Respite (~240 hours/year)

Persons Who Are Elderly Waiver

Illinois Medicaid Elderly Waiver

Age 65+
General Illinois resident, Medicaid-eligible, nursing home-level care need.
Income Limits (2025) ~$2,829/month 300% FBR, individual
Asset Limits $2,000 (individual), $3,000 (couple).
IL

Part of HealthChoice Illinois; consumer-directed options available.

Benefits
Personal care (5-7 hours/day, e.g., dressing, eating) Homemaker Adult day care (~$60/day) Respite (240 hours/year) Home mods ($1,000 avg.)

Medicare Savings Program (MSP)

Illinois Medicare Savings Program

Age 65+ or disabled
General Illinois resident, Medicare Part A/B.
Income Limits (2025) ~$2,510/month (QMB), ~$3,380/month (SLMB), ~$3,598/month (QI)—individual.
Asset Limits $9,430 (individual), $14,130 (couple).
IL

Three tiers; no waitlist.

Benefits
Covers Part B premiums ($174.70/month) Deductibles ($240/year) Copays (~20%)

Optional State Supplementation (OSS)

Illinois Optional State Supplementation

Age 65+ or disabled
General Illinois resident, in approved facility, SSI recipient or low-income.
Income Limits (2025) ~$1,004/month including SSI
Asset Limits $2,000 (individual), $3,000 (couple).
IL

~$50-$500/month based on facility type.

Benefits
Cash (~$50-$500/month) for room/board in personal care homes or SLFs

VA Aid and Attendance (A&A) and Housebound Benefits

Illinois VA Aid and Attendance/Housebound

Age 65+ or disabled veteran/spouse
General Illinois resident, wartime service, need for ADL help (A&A) or homebound.
Income Limits (2025) Net income < ~$1,984/month (veteran with dependent, A&A); pension offsets income.
Asset Limits ~$155,356 net worth limit
IL

High veteran demand in urban/rural areas.

Benefits
Cash (~$1,433-$2,642/month veteran, ~$951-$1,318 spouse) for care costs (e.g., in-home, assisted living)

Compare Nursing Home around Illinois

The information below is reported by the Illinois Department of Public Health, Office of Health Care Regulation.

5 facilities compared · CMS & IL Dept. of Health data

Filter by care type
GreenFields of Geneva
NH

Nursing Home Licensed facility providing 24/7 skilled nursing care for residents with complex, ongoing medical needs. Staffed by RNs, LPNs, and CNAs. Inspected and star-rated annually by CMS. Accepts Medicare (short-term rehab) and Medicaid (long-term care).

AL

Assisted Living A licensed, long-term care setting for seniors or individuals with disabilities who need help with daily activities — like bathing, dressing, and medication management — but not 24-hour skilled nursing. Offers housing, meals, and around-the-clock support while aiming to maximize resident independence.

IL

Independent Living Lifestyle-focused communities for older adults offering dining, activities, and transportation with minimal personal care. Best for active, independent seniors who want community without medical support.

MC

Memory Care Secured, specialized care for people living with Alzheimer's or dementia. Staff trained in cognitive impairment, with higher staff-to-resident ratios and an environment designed to reduce confusion and wandering risk.

Geneva77 93.3% +35%4.58 +61%+48%$14.2k194.8342- 6 Brian Robbins$30.1M$10.4M34.4%146166
Dobson Plaza Rehabilitation and Healthcare
NH

Nursing Home Licensed facility providing 24/7 skilled nursing care for residents with complex, ongoing medical needs. Staffed by RNs, LPNs, and CNAs. Inspected and star-rated annually by CMS. Accepts Medicare (short-term rehab) and Medicaid (long-term care).

AL

Assisted Living A licensed, long-term care setting for seniors or individuals with disabilities who need help with daily activities — like bathing, dressing, and medication management — but not 24-hour skilled nursing. Offers housing, meals, and around-the-clock support while aiming to maximize resident independence.

MC

Memory Care Secured, specialized care for people living with Alzheimer's or dementia. Staff trained in cognitive impairment, with higher staff-to-resident ratios and an environment designed to reduce confusion and wandering risk.

Evanston (Dodge Avenue)97 7.1% -90%2.39 +45%-23%$19.4k165.3182A+ 74 Charlotte Kohn$8.5M$3.7M44%145122
Admiral at the Lake
NH

Nursing Home Licensed facility providing 24/7 skilled nursing care for residents with complex, ongoing medical needs. Staffed by RNs, LPNs, and CNAs. Inspected and star-rated annually by CMS. Accepts Medicare (short-term rehab) and Medicaid (long-term care).

AL

Assisted Living A licensed, long-term care setting for seniors or individuals with disabilities who need help with daily activities — like bathing, dressing, and medication management — but not 24-hour skilled nursing. Offers housing, meals, and around-the-clock support while aiming to maximize resident independence.

IL

Independent Living Lifestyle-focused communities for older adults offering dining, activities, and transportation with minimal personal care. Best for active, independent seniors who want community without medical support.

MC

Memory Care Secured, specialized care for people living with Alzheimer's or dementia. Staff trained in cognitive impairment, with higher staff-to-resident ratios and an environment designed to reduce confusion and wandering risk.

Chicago (Uptown)56 88.6% +28%4.93 -22%+59%$0265.2127A+ 90 Nadia Geigler$25.6M$11.0M42.8%146165
Encore Village of Schaumburg
NH

Nursing Home Licensed facility providing 24/7 skilled nursing care for residents with complex, ongoing medical needs. Staffed by RNs, LPNs, and CNAs. Inspected and star-rated annually by CMS. Accepts Medicare (short-term rehab) and Medicaid (long-term care).

AL

Assisted Living A licensed, long-term care setting for seniors or individuals with disabilities who need help with daily activities — like bathing, dressing, and medication management — but not 24-hour skilled nursing. Offers housing, meals, and around-the-clock support while aiming to maximize resident independence.

IL

Independent Living Lifestyle-focused communities for older adults offering dining, activities, and transportation with minimal personal care. Best for active, independent seniors who want community without medical support.

MC

Memory Care Secured, specialized care for people living with Alzheimer's or dementia. Staff trained in cognitive impairment, with higher staff-to-resident ratios and an environment designed to reduce confusion and wandering risk.

Schaumburg109 55.4% -20%3.46 +8%+12%$25.5k282.62114A+ 58 Il Ccrc, LLC$96.9M$18.2M18.8%145341
The Grove at the Lake Living & Rehabilitation Center
NH

Nursing Home Licensed facility providing 24/7 skilled nursing care for residents with complex, ongoing medical needs. Staffed by RNs, LPNs, and CNAs. Inspected and star-rated annually by CMS. Accepts Medicare (short-term rehab) and Medicaid (long-term care).

AL

Assisted Living A licensed, long-term care setting for seniors or individuals with disabilities who need help with daily activities — like bathing, dressing, and medication management — but not 24-hour skilled nursing. Offers housing, meals, and around-the-clock support while aiming to maximize resident independence.

Zion244 61.8% -11%2.34 -48%-25%$59.4k482.84151- 77 Julie Stangel$24.1M$10.5M43.4%145665

Frequently Asked Questions about The Grove at the Lake Living & Rehabilitation Center

What neighborhood is The Grove at the Lake Living & Rehabilitation Center in?

The Grove at the Lake Living & Rehabilitation Center is in the Zion neighborhood.

Is The Grove at the Lake Living & Rehabilitation Center in a walkable area?

The Grove at the Lake Living & Rehabilitation Center has a walk score of 77. Very walkable. Most errands can be accomplished on foot, and many essentials are within a short walk.

Are there photos of The Grove at the Lake Living & Rehabilitation Center?

Yes — there are 4 photos of The Grove at the Lake Living & Rehabilitation Center in the photo gallery on this page.

What is the phone number of The Grove at the Lake Living & Rehabilitation Center?

(847) 746-8435 will put you in contact with the team at The Grove at the Lake Living & Rehabilitation Center.

Is The Grove at the Lake Living & Rehabilitation Center Medicare or Medicaid certified?

Yes — The Grove at the Lake Living & Rehabilitation Center is a CMS-certified provider of Medicare and Medicaid.

Guides for Better Senior Living

Care Cost Calculator: See Prices in Your Area

Nursing Home Data Explorer

Don’t Wait Too Long: 7 Red Flag Signs Your Parent Needs Assisted Living Now

The True Cost of Assisted Living in 2025 – And How Families Are Paying For It

Understanding Senior Living Costs: Pricing Models, Discounts & Financial Assistance

Explore Open Rooms
1 Contact details
2 What type of senior care service are you looking for?
3 What budget do you have in mind for senior care?
4 How soon do you need to find care?
5 Additional details

Thank you for your interest!

Our team will be in touch shortly to help with next steps.