


Total health inspections
6
Illinois average 10.4
Last Health inspection on Apr 2025
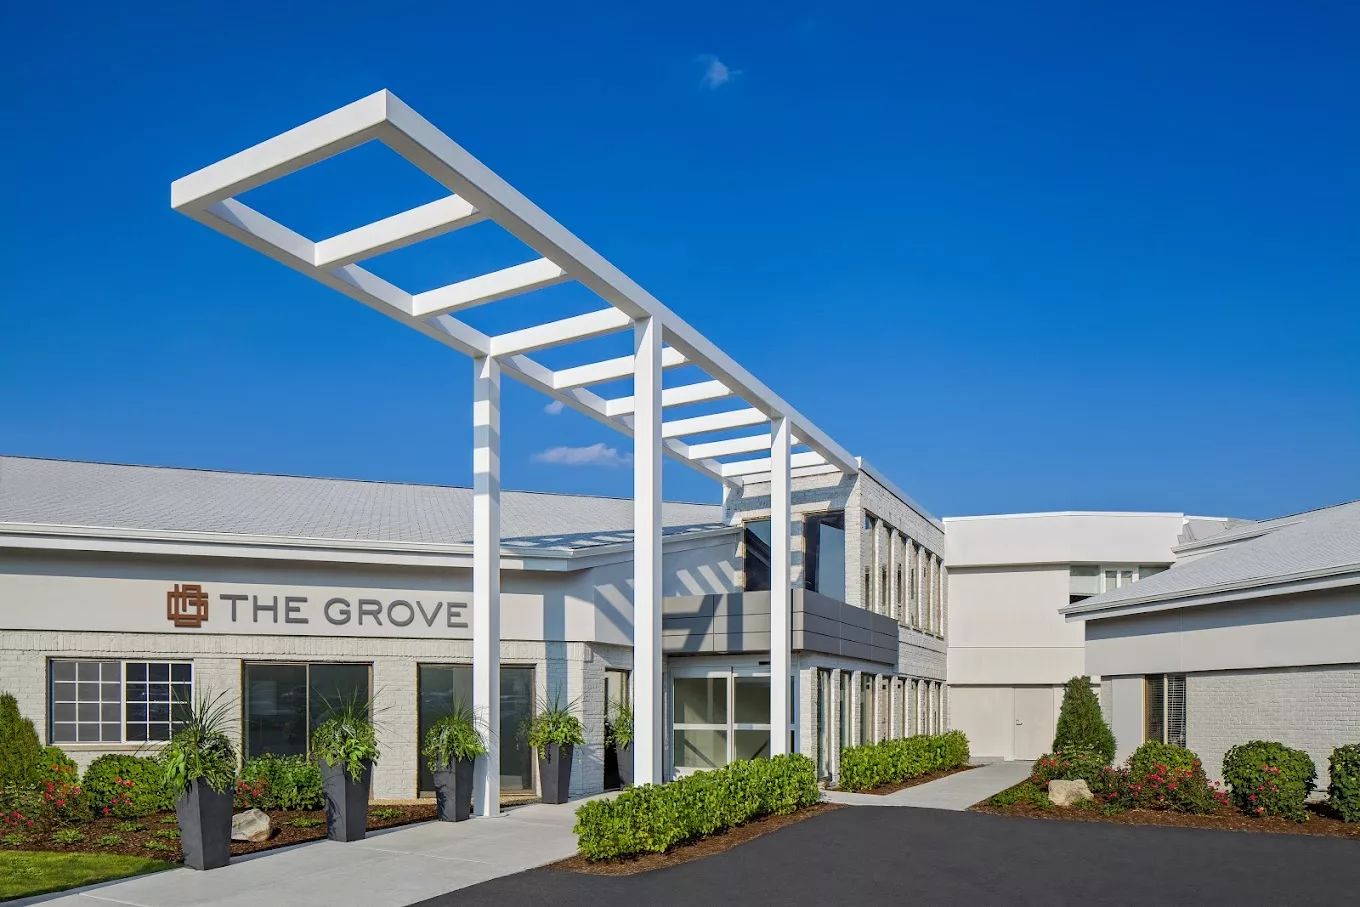


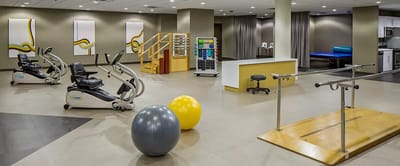


Tucked in a serene and peaceful neighborhood, residents in The Grove Fox Valley will find an exceptional experience here that’s personalized just for them. Their main focus is on post-hospital care and rehabilitation, and they offer the best of both worlds with luxurious amenities and advanced therapy equipment. They specialize in cardiac care, hemodialysis, stroke, oncology, and more, and their full-time therapists are always on hand to provide expert care. And with a state-of-the-art rehab facility that’s second to none, residents will find that their recovery process is fast and effective.
Residents can relax in spacious private suites with all the modern comforts they could want, including high-speed Wi-Fi and wall-mounted flat screen TVs. And when it comes to dining, The Grove Fox Valley delivers nutritionally balanced meals that are also delicious and satisfying. They also provide free transportation for families, as well as round-trip transportation to medical appointments.
Staffing hours
![]() Daily nursing hours per resident by staff type, reported to CMS. Higher is generally better — compare this facility to state and national averages to see where staffing stands.
Daily nursing hours per resident by staff type, reported to CMS. Higher is generally better — compare this facility to state and national averages to see where staffing stands.
Hours per resident per day vs Illinois averages
Total nursing care
![]() This home is ranked 121st out of 154 homes in Illinois for nurse hours. Total adjusted nursing hours per resident per day, combining RN, LPN, and aide time. CMS adjusts this for case-mix so facilities can be fairly compared.
This home is ranked 121st out of 154 homes in Illinois for nurse hours. Total adjusted nursing hours per resident per day, combining RN, LPN, and aide time. CMS adjusts this for case-mix so facilities can be fairly compared.
2h 30m
19% below state avg2 of 6 metrics below state avg
In Illinois, the Department of Public Health, Office of Health Care Regulation conducts annual unannounced surveys to assess compliance with state and federal healthcare facility standards.
Deficiencies
| This Facility | IL Average | vs. IL Avg |
|---|---|---|---|
|
Total deficiencies
| 25 | 7 | This facility has 257% more total deficiencies than a typical Illinois nursing home (25 vs. IL avg 7).↑ 257% worse |
|
Deficiencies per inspection
| 4.2 | 0.8 | This facility has 425% more deficiencies per inspection than a typical Illinois nursing home (4.2 vs. IL avg 0.8).↑ 425% worse |
Inspections
| This Facility | IL Average | vs. IL Avg |
|---|---|---|---|
|
Total inspections
| 6 | 9 | This facility has had 33% fewer total inspections than the Illinois average (6 vs. IL avg 9). More inspections can mean more regulatory scrutiny rather than worse care.↓ 33% fewer |
Illinois average 10.4
Last Health inspection on Apr 2025
Illinois average 36.8
Illinois average 3.68
Health citations are formal notices following inspections when they fail to comply with safety and care standards.
22 of 25 citations resulted from standard inspections; and 3 of 25 resulted from complaint investigations.
Illinois average: 0.7
Illinois average: 3.6
Reporting period: October 1 – December 31, 2025 (Q4 2025). Source: CMS Payroll-Based Journal report.
Manages medical care and health needs.
Assists with medical care and medications.
Helps with daily care and mobility.
Total hours from contractors
3,646 contractor hours this quarter
| Certified Nursing Assistant | 65 | 77 | 142 | 21,298 | 92 | 100% | 7.2 |
| Registered Nurse | 23 | 9 | 32 | 7,592 | 92 | 100% | 8 |
| Licensed Practical Nurse | 15 | 0 | 15 | 6,832 | 92 | 100% | 7.9 |
| Other Dietary Services Staff | 8 | 0 | 8 | 2,779 | 92 | 100% | 6.5 |
| Clinical Nurse Specialist | 9 | 0 | 9 | 2,497 | 92 | 100% | 5.7 |
| Dental Services Staff | 2 | 0 | 2 | 749 | 89 | 97% | 5.8 |
| Physical Therapy Assistant | 0 | 4 | 4 | 516 | 66 | 72% | 7.2 |
| RN Director of Nursing | 2 | 0 | 2 | 508 | 88 | 96% | 5.7 |
| Speech Language Pathologist | 0 | 2 | 2 | 486 | 61 | 66% | 7.8 |
| Dietitian | 1 | 0 | 1 | 484 | 87 | 95% | 5.6 |
| Occupational Therapy Aide | 1 | 0 | 1 | 480 | 86 | 93% | 5.6 |
| Administrator | 1 | 0 | 1 | 476 | 86 | 93% | 5.5 |
| Nurse Practitioner | 1 | 0 | 1 | 458 | 83 | 90% | 5.5 |
| Physical Therapy Aide | 0 | 2 | 2 | 443 | 59 | 64% | 7.5 |
| Mental Health Service Worker | 1 | 0 | 1 | 431 | 76 | 83% | 5.7 |
| Respiratory Therapy Technician | 0 | 3 | 3 | 430 | 55 | 60% | 7.7 |
| Qualified Social Worker | 0 | 1 | 1 | 329 | 62 | 67% | 5.3 |
Federal penalties imposed by CMS for regulatory violations, including civil money penalties (fines) and denials of payment for new Medicare/Medicaid admissions.
Source: CMS Penalties Database
No penalties in the past 3 years
No civil money penalties or payment denials were reported in the last 3 years.
These measures show how residents usually do over time at this home, based on health outcomes and preventive care.
Illinois average: 9.7
Illinois average: 18.6
Illinois average: 15.5%
Illinois average: 18.4%
Illinois average: 21.6%
Illinois average: 3.4%
Illinois average: 5.3%
Illinois average: 1.8%
Illinois average: 6.5%
Illinois average: 48.1%
Illinois average: 20.2%
Illinois average: 89.2%
Illinois average: 91.6%
Illinois average: 2.05
Illinois average: 2.25
Illinois average: 68.3%
Illinois average: 2.3%
Illinois average: 63.0%
Illinois average: 26.2%
Illinois average: 14.0%
Illinois average: 0.8%
Illinois average: 53.7%
Illinois average: 50.6%
Quality measures are calculated from Minimum Data Set (MDS) assessments. For most measures, lower percentages indicate better care quality.
20% of new residents, usually for short-term rehab.
68% of new residents, often for short stays.
12% of new residents, often for long-term daily care.
Source: CMS Long-Term Care Facility Characteristics (Data as of Jan 2026)
Residents meet regularly to discuss policies, care quality, and activities
Organized group of residents that meets regularly to discuss facility policies, quality of life, and activities.
Data sourced from CMS Long-Term Care Facility Characteristics quarterly report. Payer mix reflects the current resident census by primary payment source.
Historical financial and operational data for The Grove Fox Valley from 2011–2023, based on CMS SNF Cost Reports.
Key figures below are for fiscal year ending in 12/2023.
Based on CMS SNF Cost Report for fiscal year ending in 12/2023.
Residents typically stay for brief periods, with frequent admissions and discharges throughout the year.
Most new residents arrive under private pay (68% of admissions), and a typical private pay stay runs around 4 months.
Coverage residents most often arrive under.
Coverage residents most often leave under.
![]() 2.9 miles from city center
2.9 miles from city center
![]() Estimated distance in miles from Aurora's city center to The Grove Fox Valley's address, calculated via Google Maps.
— 4.26 miles to nearest hospital (Rush Copley Medical Center)
Estimated distance in miles from Aurora's city center to The Grove Fox Valley's address, calculated via Google Maps.
— 4.26 miles to nearest hospital (Rush Copley Medical Center)
Add your location
Info below is compiled from CMS reports & the IL Dept. of Public Health (IDPH), senior community websites & trusted data sources such as Walk Score & BBB.
Communities are listed from highest to lowest based on our ranking methodology.
| Thrive of Fox Valley | NH MC SNF | Aurora | 68
Facility
68
IL AVG
85
Rank
#214 / 418 |
98.8%
Facility
98.8%
IL AVG
73
Rank
#3 / 156 | +35% | 3.09
Facility
3.09
IL AVG
3.10
Rank
#63 / 154 | +82% | 0% | $0
Facility
$0
IL AVG
$151.3k
Rank
#1 / 154 | 23
Facility
23
IL AVG
36.8
Rank
#49 / 154 | 2.1
Facility
2.1
IL AVG
3.7
Rank
#11 / 154 | - | 67 | - |
79
Facility
79
IL AVG
52
Rank
#109 / 634 | Ih Fox Valley LLC | $13.5MFiscal year ending 12/2023
Facility
$13.5MFiscal year ending 12/2023
IL AVG
$13.2M
Rank
#53 / 135 | $6.7MFiscal year ending 12/2023
Facility
$6.7MFiscal year ending 12/2023
IL AVG
$7.4M
Rank
#68 / 135 | 49.4%Fiscal year ending 12/2023
Facility
49.4%Fiscal year ending 12/2023
IL AVG
60.5%
Rank
#81 / 135 | 146194 | ||||
| Alden Courts of Waterford | NH AL MC RC SNF | Aurora | 60
Facility
60
IL AVG
85
Rank
#248 / 418 |
90.0%
Facility
90.0%
IL AVG
73
Rank
#30 / 156 | +23% | 3.60
Facility
3.60
IL AVG
3.10
Rank
#50 / 154 | +38% | +16% | $0
Facility
$0
IL AVG
$151.3k
Rank
#1 / 154 | 20
Facility
20
IL AVG
36.8
Rank
#37 / 154 | 3.3
Facility
3.3
IL AVG
3.7
Rank
#58 / 154 | - | 54 | A+ |
58
Facility
58
IL AVG
52
Rank
#253 / 634 | Steven Kroll | $6.8MFiscal year ending 12/2023
Facility
$6.8MFiscal year ending 12/2023
IL AVG
$13.2M
Rank
#119 / 135 | $3.8MFiscal year ending 12/2023
Facility
$3.8MFiscal year ending 12/2023
IL AVG
$7.4M
Rank
#119 / 135 | 56.2%Fiscal year ending 12/2023
Facility
56.2%Fiscal year ending 12/2023
IL AVG
60.5%
Rank
#52 / 135 | 146182 | ||||
| The Grove Fox Valley | NH MC SNF | Farnsworth Aurora (North Farnsworth Avenue) | 158
Facility
158
IL AVG
85
Rank
#41 / 418 |
80.3%
Facility
80.3%
IL AVG
73
Rank
#68 / 156 | +10% | 2.50
Facility
2.50
IL AVG
3.10
Rank
#121 / 154 | -1% | -19% | $0
Facility
$0
IL AVG
$151.3k
Rank
#1 / 154 | 25
Facility
25
IL AVG
36.8
Rank
#55 / 154 | 4.2
Facility
4.2
IL AVG
3.7
Rank
#114 / 154 | 1 | 127 | A+ |
49
Facility
49
IL AVG
52
Rank
#344 / 634 | Doros Generation Trust U/A/D 1/3/12 | $13.7MFiscal year ending 12/2023
Facility
$13.7MFiscal year ending 12/2023
IL AVG
$13.2M
Rank
#52 / 135 | $8.0MFiscal year ending 12/2023
Facility
$8.0MFiscal year ending 12/2023
IL AVG
$7.4M
Rank
#47 / 135 | 58%Fiscal year ending 12/2023
Facility
58%Fiscal year ending 12/2023
IL AVG
60.5%
Rank
#46 / 135 | 145006 | ||||
| Jennings Terrace | NH HOS RC SNF | Aurora | 60
Facility
60
IL AVG
85
Rank
#248 / 418 |
80.0%
Facility
80.0%
IL AVG
73
Rank
#70 / 156 | +10% | 2.93
Facility
2.93
IL AVG
3.10
Rank
#78 / 154 | +27% | -5% | $0
Facility
$0
IL AVG
$151.3k
Rank
#1 / 154 | 21
Facility
21
IL AVG
36.8
Rank
#40 / 154 | 5.3
Facility
5.3
IL AVG
3.7
Rank
#137 / 154 | - | 48 | - |
80
Facility
80
IL AVG
52
Rank
#104 / 634 | Jomarie Silver | $5.6MFiscal year ending 06/2024
Facility
$5.6MFiscal year ending 06/2024
IL AVG
$13.2M
Rank
#124 / 135 | $3.5MFiscal year ending 06/2024
Facility
$3.5MFiscal year ending 06/2024
IL AVG
$7.4M
Rank
#127 / 135 | 62.6%Fiscal year ending 06/2024
Facility
62.6%Fiscal year ending 06/2024
IL AVG
60.5%
Rank
#34 / 135 | 146197 | ||||
| Alden of Waterford | NH SNF | Aurora | 99
Facility
99
IL AVG
85
Rank
#121 / 418 |
80.9%
Facility
80.9%
IL AVG
73
Rank
#64 / 156 | +11% | 3.15
Facility
3.15
IL AVG
3.10
Rank
#60 / 154 | +52% | +2% | $106.5k
Facility
$106.5k
IL AVG
$151.3k
Rank
#117 / 154 | 31
Facility
31
IL AVG
36.8
Rank
#80 / 154 | 2.4
Facility
2.4
IL AVG
3.7
Rank
#19 / 154 | 1 | 80 | A+ |
51
Facility
51
IL AVG
52
Rank
#325 / 634 | Alden Of Waterford Investments LLC | $12.2MFiscal year ending 12/2023
Facility
$12.2MFiscal year ending 12/2023
IL AVG
$13.2M
Rank
#63 / 135 | $5.5MFiscal year ending 12/2023
Facility
$5.5MFiscal year ending 12/2023
IL AVG
$7.4M
Rank
#90 / 135 | 45%Fiscal year ending 12/2023
Facility
45%Fiscal year ending 12/2023
IL AVG
60.5%
Rank
#110 / 135 | 146008 |
The Grove Fox Valley is located in Farnsworth Aurora, Illinois.
Here are the financial assistance programs available to residents in Illinois.
The Grove Fox Valley is in the North Farnsworth Avenue neighborhood of Aurora.
The Grove Fox Valley has a walk score of 49. Somewhat walkable. A few nearby services may be reachable on foot, but most trips require transportation.
The Grove Fox Valley's occupancy is 77.1%.
The Grove Fox Valley has been operating for approximately 12 years, based on available licensing and registration records.
No, The Grove Fox Valley has a no-pet policy.
The Grove Fox Valley is registered as a for-profit in IL.
The Grove Fox Valley has had 25 reported deficiencies since 2023 according to records from Illinois Department of Public Health (IDPH).
Care Cost Calculator: See Prices in Your Area
Nursing Home Data Explorer
Don’t Wait Too Long: 7 Red Flag Signs Your Parent Needs Assisted Living Now
The True Cost of Assisted Living in 2025 – And How Families Are Paying For It
Understanding Senior Living Costs: Pricing Models, Discounts & Financial Assistance


