The Heritage at Brentwood
Nursing Home & Independent Living · Brentwood, TN
CMS overall rating Info The Overall CMS Rating is scored from 1 to 5 stars and combines results from health inspections, staffing levels, and quality measures. Health inspections carry the most weight. Staffing and quality scores can increase or decrease the final rating based on performance compared to state and national standards.

The Heritage at Brentwood

Nursing Home & Independent Living · Brentwood, TN
CMS overall rating Info The Overall CMS Rating is scored from 1 to 5 stars and combines results from health inspections, staffing levels, and quality measures. Health inspections carry the most weight. Staffing and quality scores can increase or decrease the final rating based on performance compared to state and national standards.
Calculator: See prices in your area
The Heritage at Brentwood accepts Medicare and private pay.

Overview of The Heritage at Brentwood

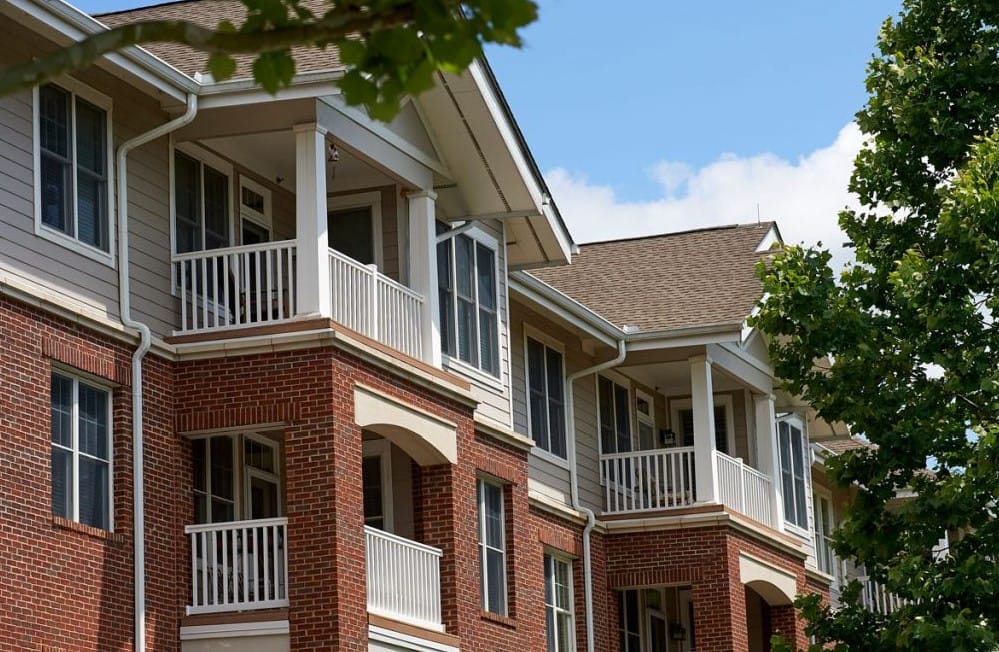
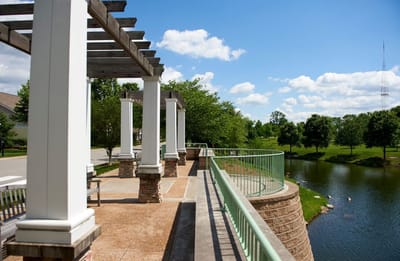
Set in the neighborhood of Brentwood, Tennessee, The Heritage at Brentwood is a welcoming senior living community that offers independent living. Sprawled on 48 acres of beautifully maintained grounds, the community provides residents with a peaceful living environment with their stunning accommodations and inviting common spaces. Offering LifeCare®, the community ensures residents have access to other levels of care, including assisted living, memory care, skilled nursing, and rehabilitation.

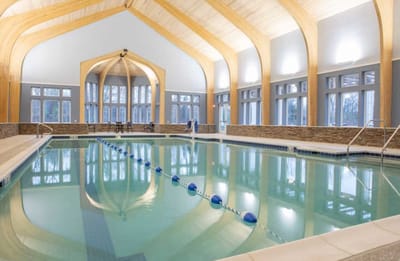
Various activities like fitness classes, lectures, and events are available to make sure residents are able to enjoy a fulfilling and purposeful retirement experience. Residents also benefit from having access to a variety of amenities, such as a fitness center, pool, and refreshing walking and biking paths. Delicious and nutritious meals are also offered to elevate residents’ quality of life even more.

(615) 564-4900

Quality ratings

Measured by Centers for Medicare & Medicaid Services (CMS)

Overall rating Info The Overall CMS Rating combines results from health inspections, staffing levels and quality measures. Health inspections carry the most weight. Staffing and quality scores can increase or decrease the final rating based on performance compared to state and national standards.
▲ 63.4% Above TN avg. ▲ 63.4% Above TN avg.Click the badge to see the full State ranking.Click here to see the full State ranking.
Health Inspection Info Based on the results of the facility's three most recent standard inspections and any complaint investigations. CMS reviews the number, scope, and severity of deficiencies, with more recent findings weighted more heavily.
▲ 71.2% Above TN avg. ▲ 71.2% Above TN avg.Click the badge to see the full State ranking.Click here to see the full State ranking.
Staffing Info Measures average nursing staff hours per resident per day, including Registered Nurses (RNs) and total nursing staff. Ratings are adjusted based on the level of care residents require and are compared to state and national benchmarks.
▲ 63.3% Above TN avg. ▲ 63.3% Above TN avg.Click the badge to see the full State ranking.Click here to see the full State ranking.
Quality Measures Info Based on clinical and physical health indicators reported to CMS, such as hospital readmissions, falls, pressure ulcers, and improvements in mobility. These measures reflect how well residents' health needs are being managed.
▼ 19.6% Below TN avg. ▼ 19.6% Below TN avg.Click the badge to see the full State ranking.Click here to see the full State ranking.

Staffing hours breakdown

Info Daily nursing hours per resident by staff type, reported to CMS. Higher is generally better — compare this facility to state and national averages to see where staffing stands.

Hours per resident per day — compared to Tennessee state averages

Total nursing care / resident Info This home is ranked 10th out of 172 homes in Tennessee. Total adjusted nursing hours per resident per day, combining RN, LPN, and aide time. CMS adjusts this for case-mix so facilities can be fairly compared.
5h 1m per day
Rank #10 / 172Nurse hours — State benchmarkedThis home is ranked 10th out of 172 homes in Tennessee. Shows adjusted nurse hours per resident per day benchmarked to the Tennessee average, with a ranking across 172 Tennessee SNFs. More hours mean more direct care. The national average is about 3.5 hrs; below 3.0 is a red flag.Click the rank badge to see the full State ranking.Click here to see the full State ranking.
This facility Tennessee avg (3h 40m per day)
vs Tennessee avg
+37%
Staff typeHours / Day / Residentvs state avg
Weekend Total Nursing Info Combined nursing hours (RN + LPN + Nurse Aide) per resident per day on weekends. Staffing often drops on weekends — this figure reveals whether the facility maintains adequate coverage outside of weekday hours. 3h 38m per day

Types of Care at The Heritage at Brentwood

Independent Living

Capacity and availability

This home usually has limited availability

Occupancy between 85% and 95% suggests balanced demand.

Higher occupancy than the Tennessee average: 73%
Occupancy rate 88.2% Rank #69 / 302Occupancy rate — State benchmarkedThis home is ranked 69th out of 302 homes in Tennessee. Shows this facility's occupancy rate versus the Tennessee average, with its Statewide rank out of 302. Higher occupancy signals strong local demand and financial stability.Click the rank badge to see the full State ranking.Click here to see the full State ranking.
Avg. Length of Stay 145 days
Occupancy rate
88.2% Rank #69 / 302Occupancy rate — State benchmarkedThis home is ranked 69th out of 302 homes in Tennessee. Shows this facility's occupancy rate versus the Tennessee average, with its Statewide rank out of 302. Higher occupancy signals strong local demand and financial stability.Click the rank badge to see the full State ranking.Click here to see the full State ranking.
Avg. Length of Stay
145 days
Years in operation
26 years in operation Rank #230 / 383Years in operation — State benchmarkedThis home is ranked 230th out of 383 homes in Tennessee. Shows how long this facility has been in operation compared to other Tennessee SNFs. Longer operating histories may benefit residents, families, and staff.Click the rank badge to see the full State ranking.Click here to see the full State ranking.
A longer operating history, which may indicate experience navigating regulations and delivering ongoing care.
Walk Score
Walk Score: 7 / 100 Rank #472 / 555Walk Score — State benchmarkedThis home is ranked 472nd out of 555 homes in Tennessee. Shows how walkable this facility's neighborhood is compared to the average Walk Score across Tennessee SNFs. Higher scores benefit residents, families, and staff.Click the rank badge to see the full State ranking.Click here to see the full State ranking.
Car-dependent. Most errands require a car, with limited nearby walkable options.
BBB Rating
BBB Rating: A+ (Accredited)
An independent rating from the Better Business Bureau based on factors such as complaint history, transparency, and business practices.
How BBB ratings work

License Details

CMS Certification Number445488

Staffing

Key information about the people who lead and staff this community.

Leadership

ContactMr. Jon Tagatz, Executive Director

Contact The Heritage at Brentwood

Inspection History

In Tennessee, the Department of Health, Division of Health Care Facilities performs unannounced inspections and investigations to ensure facilities provide high-quality resident care.

Read the full inspection reports for this facility, including detailed findings and corrective actions.

Show Inspection Reports

Health Inspection History

Inspections since 2019
Total health inspections 2

Tennessee average 3.5


Last Health inspection on Apr 2022

Total health citations
6 Rank #24 / 176Health citations — State benchmarkedThis home is ranked 24th out of 176 homes in Tennessee. Shows this facility's total health deficiency citations benchmarked to the Tennessee State average, with a ranking across all 176 TN SNFs. Lower citation counts earn a better rank.Click the rank badge to see the full State ranking.Click here to see the full State ranking.

Tennessee average 15.4

Citations per inspection
3 Rank #42 / 176Citations per inspection — State benchmarkedThis home is ranked 42nd out of 176 homes in Tennessee. Shows average deficiency citations per CMS inspection for this facility versus the Tennessee mean across 176 SNFs with citation data. Lower is better.Click the rank badge to see the full State ranking.Click here to see the full State ranking.

Tennessee average 4.39


Health citations are formal notices following inspections when they fail to comply with safety and care standards.

All 6 citations resulted from standard inspections.

Breakdown of citation severity (last 7 years)
Critical Health citations
0
100% better than Tennessee average

Tennessee average: 1.1


Serious Health citations
0
100% better than Tennessee average

Tennessee average: 0.6

0 critical citations Tennessee average: 1.1

0 serious citations Tennessee average: 0.6

6 moderate citations Tennessee average: 13.7

0 minor citations Tennessee average: 0.1
Citations history (last 7 years)
Quality of Care moderate citation Apr 20, 2022
Corrected

Resident Rights moderate citation Apr 20, 2022
Corrected

Pharmacy moderate citation Jan 29, 2019
Corrected

Pharmacy moderate citation Jan 29, 2019
Corrected

Staffing Data

Reporting period: October 1 – December 31, 2025 (Q4 2025). Source: CMS Payroll-Based Journal report.

Total staff 102
Employees 87
Contractors 15
Staff to resident ratio 9.27:1
430% better than Tennessee average
Tennessee average ratio: 1.75:1 Tennessee average ratio: 1.75:1See full Tennessee ranking
Avg staff/day 44
Average shift 7.4 hours
11% worse than Tennessee average
Tennessee average: 8.3 hours Tennessee average shift: 8.3 hoursSee full Tennessee ranking
Total staff hours (quarter) 29,797

Nursing staff breakdown

Q4 2025 · Oct 1 – Dec 31 More info This data comes from the CMS Payroll-Based Journal report covering October 1 – December 31, 2025.
Registered Nurse

Manages medical care and health needs.

RN Staff 20
Average shift length Info Average shift length. Calculated as total hours divided by days worked and average staff per day. 8.1 hours

No contractors work on this role.

Licensed Practical Nurse

Assists with medical care and medications.

LPN Staff 14
Average shift length Info Average shift length. Calculated as total hours divided by days worked and average staff per day. 8.1 hours

No contractors work on this role.

Certified Nursing Assistant

Helps with daily care and mobility.

CNA Staff 36
Average shift length Info Average shift length. Calculated as total hours divided by days worked and average staff per day. 8 hours

No contractors work on this role.

Contractor staffing

Q4 2025 · Oct 1 – Dec 31 More info This data comes from the CMS Payroll-Based Journal report covering October 1 – December 31, 2025.

Total hours from contractors

9.4%

2,810 contractor hours this quarter

Speech Language Pathologist: 4 Feeding Assistant: 2 Respiratory Therapy Technician: 2 Physical Therapy Aide: 2 Physical Therapy Assistant: 2 Medical Director: 1 Administrator: 1 Qualified Social Worker: 1

Staff by category

Q4 2025 · Oct 1 – Dec 31 More info This data comes from the CMS Payroll-Based Journal report covering October 1 – December 31, 2025.
Certified Nursing Assistant3603613,04892100%8
Registered Nurse200204,99092100%8.1
Licensed Practical Nurse140142,98192100%8.1
Other Dietary Services Staff5051,8639098%7.3
Medication Aide/Technician5059398390%6
Nurse Practitioner2028966368%8
RN Director of Nursing2028956571%8.4
Physical Therapy Aide0227746874%6
Speech Language Pathologist0446077683%4.6
Clinical Nurse Specialist1014966267%8
Administrator0114485661%8
Occupational Therapy Aide1014485661%8
Dental Services Staff1014325459%8
Respiratory Therapy Technician0223398188%2.6
Feeding Assistant0222646672%2.2
Qualified Social Worker0112205054%4.4
Physical Therapy Assistant0221022325%4.4
Medical Director011561415%4
36 Certified Nursing Assistant
% of Days 100%
20 Registered Nurse
% of Days 100%
14 Licensed Practical Nurse
% of Days 100%
5 Other Dietary Services Staff
% of Days 98%
5 Medication Aide/Technician
% of Days 90%
2 Nurse Practitioner
% of Days 68%
2 RN Director of Nursing
% of Days 71%
2 Physical Therapy Aide
% of Days 74%
4 Speech Language Pathologist
% of Days 83%
1 Clinical Nurse Specialist
% of Days 67%
1 Administrator
% of Days 61%
1 Occupational Therapy Aide
% of Days 61%
1 Dental Services Staff
% of Days 59%
2 Respiratory Therapy Technician
% of Days 88%
2 Feeding Assistant
% of Days 72%
1 Qualified Social Worker
% of Days 54%
2 Physical Therapy Assistant
% of Days 25%
1 Medical Director
% of Days 15%

Penalties and fines

Federal penalties imposed by CMS for regulatory violations, including civil money penalties (fines) and denials of payment for new Medicare/Medicaid admissions.

Source: CMS Penalties Database

No penalties in the past 3 years

No civil money penalties or payment denials were reported in the last 3 years.

Quality of care over time

These measures show how residents usually do over time at this home, based on health outcomes and preventive care.

High-risk clinical events score Info A composite score based on pressure ulcers, falls with injury, weight loss, walking ability decline, and activities of daily living decline. 8.3
21% better than Tennessee average

Tennessee average: 10.5

Functional decline score Info A composite score based on activities of daily living decline, walking ability decline, and incontinence. 13.9
29% better than Tennessee average

Tennessee average: 19.5

Long-stay resident measures
Need for Help with Daily Activities Increased Info Percent of long-stay residents whose need for help with daily activities has increased 14.6%
9% better than Tennessee average

Tennessee average: 16.0%

Walking Ability Worsened Info Percent of long-stay residents whose ability to move independently worsened 15.3%
29% better than Tennessee average

Tennessee average: 21.7%

Low Risk Residents with Bowel/Bladder Incontinence Info Percent of low risk long-stay residents who lose control of their bowels or bladder 11.7%
44% better than Tennessee average

Tennessee average: 20.7%

Falls with Major Injury Info Percent of long-stay residents experiencing one or more falls with major injury 4.5%
23% worse than Tennessee average

Tennessee average: 3.7%

High Risk Residents with Pressure Ulcers Info Percent of long-stay high risk residents with pressure ulcers 1.6%
70% better than Tennessee average

Tennessee average: 5.4%

Urinary Tract Infection Info Percent of long-stay residents with a urinary tract infection 0.5%
76% better than Tennessee average

Tennessee average: 2.1%

Lost Too Much Weight Info Percent of long-stay residents who lose too much weight 5.3%
16% better than Tennessee average

Tennessee average: 6.3%

Depressive Symptoms Info Percent of long-stay residents who have depressive symptoms 1.7%
84% better than Tennessee average

Tennessee average: 11.0%

Antipsychotic Use Info Percent of long-stay residents who received an antipsychotic medication 10.0%
39% better than Tennessee average

Tennessee average: 16.5%

Pneumococcal Vaccine Info Percent of long-stay residents assessed and appropriately given the pneumococcal vaccine 99.5%
11% better than Tennessee average

Tennessee average: 89.9%

Influenza Vaccine Info Percent of long-stay residents assessed and appropriately given the seasonal influenza vaccine 94.6%
In line with Tennessee average

Tennessee average: 94.5%

Short-stay resident measures
Pneumococcal Vaccine Info Percent of short-stay residents assessed and appropriately given the pneumococcal vaccine 98.3%
23% better than Tennessee average

Tennessee average: 79.7%

Antipsychotic medication increase Info Percent of short-stay residents who newly received an antipsychotic medication 0.0%
100% better than Tennessee average

Tennessee average: 1.7%

Influenza Vaccine Info Percent of short-stay residents assessed and appropriately given the seasonal influenza vaccine 88.8%
11% better than Tennessee average

Tennessee average: 79.8%

Breakdown by payment type

Medicare

33% of new residents, usually for short-term rehab.

Typical stay 27 days

Private pay

67% of new residents, often for short stays.

Typical stay 7 - 8 months

Facility Characteristics

Source: CMS Long-Term Care Facility Characteristics (Data as of Jan 2026)

Total residents 11
Medicare
3
27.3% of residents
Private pay or other
8
72.7% of residents
Programs & Services
Residents Group

Residents meet regularly to discuss policies, care quality, and activities

Family Member Group

Family members meet regularly to discuss policies, care quality, and activities

CCRC

Part of a Continuing Care Retirement Community offering multiple care levels

Active Family Council

Organized group of family members that meets regularly to discuss facility policies, resident care, and activities.

Active Resident Council

Organized group of residents that meets regularly to discuss facility policies, quality of life, and activities.

Finances and operations

Privately-owned community
Operated by a business corporation.
Home revenue
$33.6M
Operating loss
-$607.5K
Privately-owned community Operated by a business corporation.
Home revenue
$33.6M Rank #4 / 176Revenue — State benchmarkedThis home is ranked 4th out of 176 homes in Tennessee. Shows this facility's annual revenue compared to the Tennessee SNF average. Higher revenue generally means more resources for staffing and capital — read alongside Payroll %.Click the rank badge to see the full State ranking.Click here to see the full State ranking.
Operating loss
-$607.5K
Payroll costs Info The portion of the home's budget spent on staff, including nurses, caregivers, and other employees who support care and operations. Rank #14 / 176Payroll — State benchmarkedThis home is ranked 14th out of 176 homes in Tennessee. Shows total annual staff payroll benchmarked to the Tennessee average. Higher payroll investment relative to peers often signals better staffing and less reliance on cheaper contract labor.Click the rank badge to see the full State ranking.Click here to see the full State ranking.
$12.2M
36.3% of revenue Rank #141 / 176Payroll % — State benchmarkedThis home is ranked 141st out of 176 homes in Tennessee. Shows payroll as a percentage of revenue versus the Tennessee average. Well-run Tennessee SNFs typically land around 50–60% — the top third Statewide. Below 25% may signal understaffing or heavy agency use — read with Staffing ratings.Click the rank badge to see the full State ranking.Click here to see the full State ranking.
Other operating costs Info All remaining costs needed to run the home, such as food, utilities, building maintenance, supplies and administrative expenses.
$22.0M
Total costs $34.2M

What does this home offer?

Housing options icon

Housing Options: 1 Bed / 2 Bed / 3 Bed

Building type icon
Building type icon

Building Type: 3-story

Dining services icon

Dining Services

Parking Available icon

Parking Available

Transportation services icon

Transportation Services

Housekeeping icon
Housekeeping icon

Housekeeping Services

Who this home usually serves

TYPE OF STAY

Primarily short stays

Residents typically stay for brief periods, with frequent admissions and discharges throughout the year.

Places of interest near The Heritage at Brentwood

Address 4.2 miles from city center Info Estimated distance in miles from Brentwood's city center to The Heritage at Brentwood's address, calculated via Google Maps.

Calculate Travel Distance to The Heritage at Brentwood

Add your location

Address

Financial Assistance for
Nursing Home in Tennessee

The Heritage at Brentwood is located in Brentwood, Tennessee.
Here are the financial assistance programs available to residents in Tennessee.

Get Financial aid guidance

CHOICES Program

TN Medicaid CHOICES

Age 65+ or disabled
General Tennessee resident, Medicaid-eligible, nursing home-level care need.
Income Limits (2025) ~$2,829/month 300% FBR, individual
Asset Limits $2,000 (individual), $3,000 (couple).
TN

Managed care model; high rural demand.

Benefits
Personal care (5-7 hours/day) Respite (240 hours/year) Adult day care ($65/day) Home modifications ($1,500 avg.)

Tennessee Options for Community Living

TN Options

Age 60+
General Tennessee resident, at risk of nursing home.
Income Limits ~$2,000/month individual, varies
Asset Limits $5,000 individual
TN

Limited funding; rural/urban balance.

Benefits
In-home care (3-5 hours/week) Respite (up to 10 days/year) Transportation (~5 trips/month)

Medicare Savings Program (MSP)

Tennessee Medicare Savings Program

Age 65+ or disabled
General TN resident, Medicare Part A/B.
Income Limits (2025) ~$2,510/month (QMB), ~$3,380/month (SLMB), ~$3,598/month (QI)—individual.
Asset Limits $9,430 (individual), $14,130 (couple).
TN

Three tiers; includes Extra Help for Part D; no waitlist.

Benefits
Covers Part B premiums ($174.70/month) Deductibles ($240/year) Copays (~20%)

Family Caregiver Support Program (FCSP)

Tennessee Family Caregiver Support Program

Age
General Caregivers of 60+ needing care or 55+ caregivers of others; TN resident; functional needs (2+ ADLs).
Income Limits (2025) No strict cap; prioritizes low-income ~$24,980/year
Asset Limits Not assessed; need-based.
TN

Includes grandparent caregivers; high rural demand.

Benefits
Respite (4-6 hours/week or 5 days/year) Adult day care ($60/day) Training Supplies (~$500/year)

VA Aid and Attendance (A&A) and Housebound Benefits

Tennessee VA Aid and Attendance/Housebound

Age 65+ or disabled veteran/spouse
General TN resident, wartime service, need for ADL help (A&A) or homebound.
Income Limits (2025) Net income < ~$1,984/month (veteran with dependent, A&A); pension offsets income.
Asset Limits ~$155,356 net worth limit
TN

High veteran population; supports rural/urban care needs.

Benefits
Cash (~$1,433-$2,642/month veteran, ~$951-$1,318 spouse) for care costs (e.g., in-home, assisted living)

Elderly Nutrition Program

Tennessee Elderly Nutrition Program

Age 60+
General TN resident; no income limit but prioritizes low-income.
Income Limits (2025) None; donations encouraged.
Asset Limits Not assessed.
TN

Serves ~50,000 annually; 200+ congregate sites plus Meals on Wheels.

Benefits
Congregate meals ($5-$7/meal value) at senior centers Home-delivered meals ($5-$7/meal)

Property Tax Relief Program

Tennessee Property Tax Relief Program

Age 65+
General TN resident, homeowner/renter (or widow/er 50+, disabled 18+).
Income Limits (2025) ~$45,000/year household, excludes half of Social Security
Asset Limits Not assessed; income-focused.
TN

Rebates up to $1,000; serves ~100,000 annually.

Benefits
Tax rebates (~$250-$1,000 based on income; e.g., $1,000 if income < $8,000)

Frequently Asked Questions about The Heritage at Brentwood

Is The Heritage at Brentwood in a walkable area?

The Heritage at Brentwood has a walk score of 7. Car-dependent. Most errands require a car, with limited nearby walkable options.

What is the occupancy rate at The Heritage at Brentwood?

The Heritage at Brentwood's occupancy is 88.2%.

What is the address of The Heritage at Brentwood?

The Heritage at Brentwood is located at 900 Heritage Way, Brentwood, TN 37027, United States.

What is the phone number of The Heritage at Brentwood?

(615) 564-4900 will put you in contact with the team at The Heritage at Brentwood.

Is The Heritage at Brentwood Medicare or Medicaid certified?

Yes — The Heritage at Brentwood is a CMS-certified provider of Medicare and Medicaid.

Guides for Better Senior Living

Care Cost Calculator: See Prices in Your Area

Nursing Home Data Explorer

Don’t Wait Too Long: 7 Red Flag Signs Your Parent Needs Assisted Living Now

The True Cost of Assisted Living in 2025 – And How Families Are Paying For It

Understanding Senior Living Costs: Pricing Models, Discounts & Financial Assistance

Explore Open Rooms
1 Contact details
2 What type of senior care service are you looking for?
3 What budget do you have in mind for senior care?
4 How soon do you need to find care?
5 Additional details

Thank you for your interest!

Our team will be in touch shortly to help with next steps.