• Home
  • Nursing Home in Florida
The Inn at Freedom Square
Nursing Home, Assisted Living, Independent Living, Memory Care & Respite Care · Seminole, FL
CMS overall rating Info CMS (the Centers for Medicare & Medicaid Services) is the federal agency that rates nursing home quality. Its Overall Rating runs from 1 to 5 stars, combining health inspections, staffing, and quality measures, with inspections weighted most heavily.

The Inn at Freedom Square

Nursing Home, Assisted Living, Independent Living, Memory Care & Respite Care · Seminole, FL
CMS overall rating Info CMS (the Centers for Medicare & Medicaid Services) is the federal agency that rates nursing home quality. Its Overall Rating runs from 1 to 5 stars, combining health inspections, staffing, and quality measures, with inspections weighted most heavily.
Calculator: See prices in your area
The Inn at Freedom Square accepts Medicare, Medicaid, and private pay.

Overview of The Inn at Freedom Square

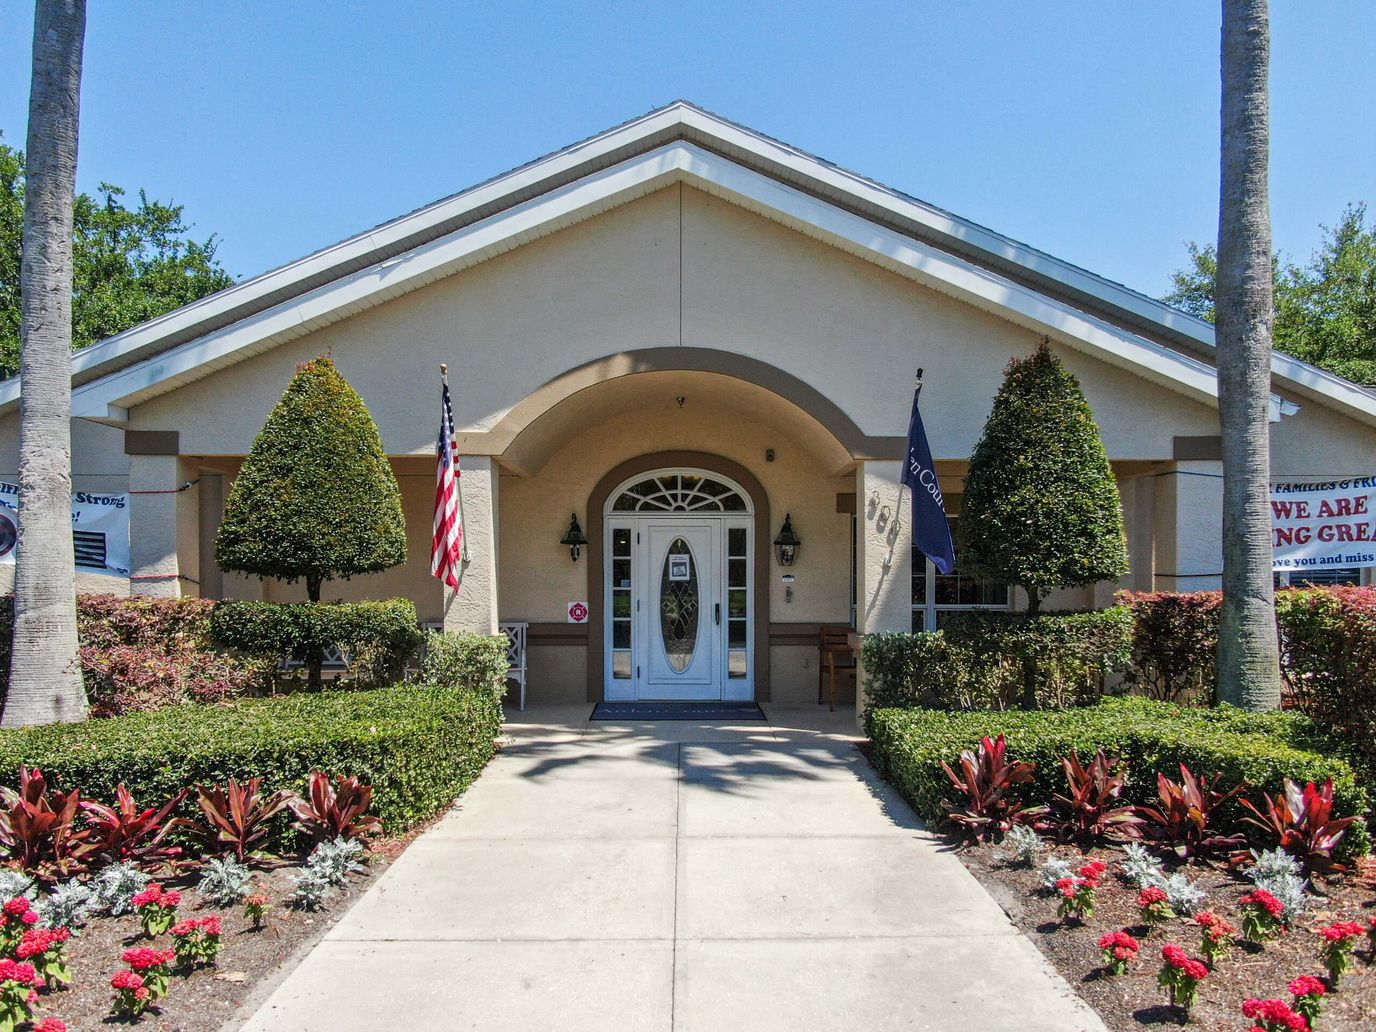
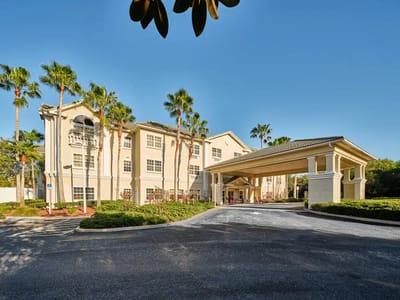
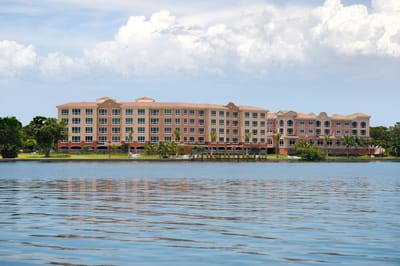
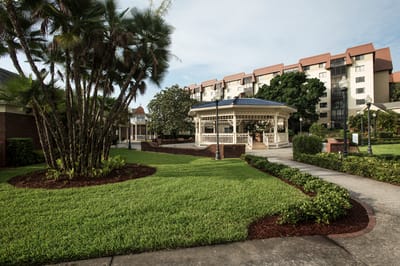
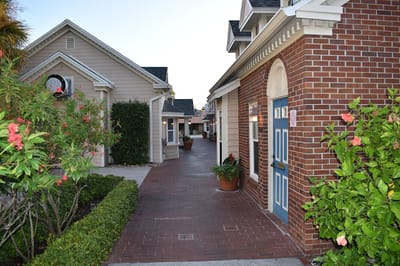
Owned by Allison Beck, The Inn at Freedom Square is a 200-bed community operated by CCRC Opco Freedom Square LLC in Seminole, Florida, on Johnson Boulevard. Under Shelly Craddock’s administration, the community welcomes Medicare, Medicaid, and private pay, providing families with flexible coverage options. With a walk score of 84, the neighborhood is highly walkable, making it easy for visiting family and residents who enjoy walking to nearby shops and services.

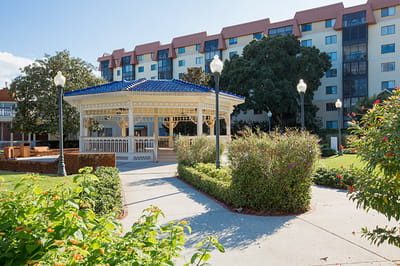
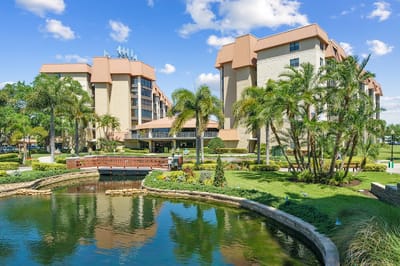
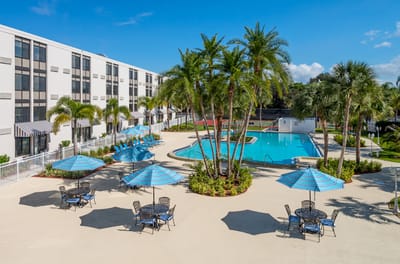
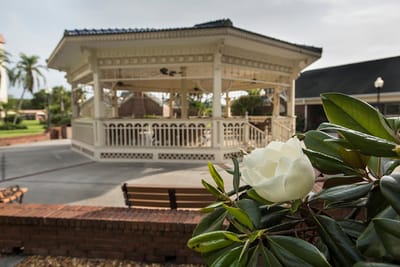
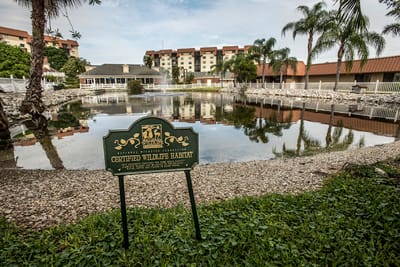
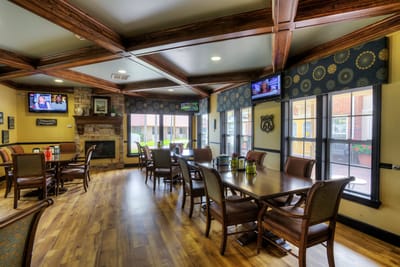
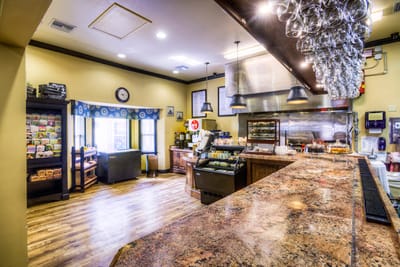
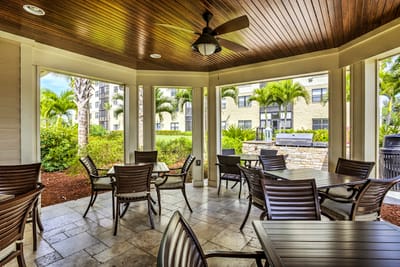
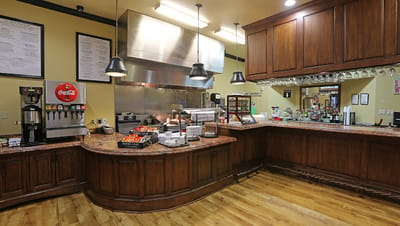
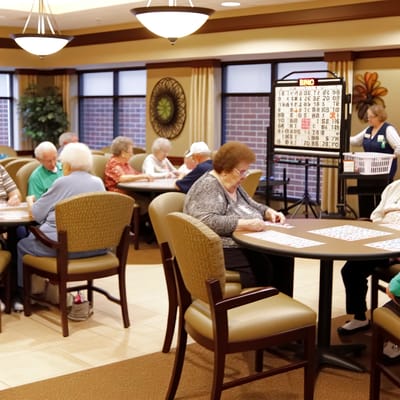
The facility serves residents with respite care, averaging a stay length of 45 days, reflecting its role in short-term recovery and transitional care. Substantial is daily nursing support, with total nursing care averaging 4 hours and 14 minutes per resident day, supported by nursing aides providing an additional 3 hours and 58 minutes per resident daily. The daily environment is boosted by wide amenities made to support rest and engagement. Residents have access to a salon and garden, quieter spaces like the library, and opportunities for creative activities in the arts and crafts room. The enclosed courtyard and outside patio provide areas for fresh air and outdoor time. A piano is there for those interested in music, and kitchenettes in residential areas permit some meal preparation and flexibility in daily routines.

Over the past 14 years, inspections conducted demonstrate sustained compliance, with no deficiencies found during complaint investigations or routine reviews in the recent inspection batch. This consistent record mirrors the community’s mission of meeting safety and care standards.

Quality ratings

Measured by Centers for Medicare & Medicaid Services (CMS)

Overall rating Info The Overall CMS Rating combines results from health inspections, staffing levels and quality measures. Health inspections carry the most weight. Staffing and quality scores can increase or decrease the final rating based on performance compared to state and national standards.
Health Inspection Info Based on the results of the facility's three most recent standard inspections and any complaint investigations. CMS reviews the number, scope, and severity of deficiencies, with more recent findings weighted more heavily.
Staffing Info Measures average nursing staff hours per resident per day, including Registered Nurses (RNs) and total nursing staff. Ratings are adjusted based on the level of care residents require and are compared to state and national benchmarks.
Quality Measures Info Based on clinical and physical health indicators reported to CMS, such as hospital readmissions, falls, pressure ulcers, and improvements in mobility. These measures reflect how well residents' health needs are being managed.

Staffing hours breakdown

Info Daily nursing hours per resident by staff type, reported to CMS. Higher is generally better — compare this facility to state and national averages to see where staffing stands.

Hours per resident per day — compared to state averages

Total nursing care / resident Info Total adjusted nursing hours per resident per day, combining RN, LPN, and aide time. CMS adjusts this for case-mix so facilities can be fairly compared.
4h 14m per day
Rank #75 / 253Nurse hours — State benchmarkedThis home is ranked 75th out of 253 homes in Florida. Shows adjusted nurse hours per resident per day benchmarked to the Florida average, with a ranking across 253 Florida facilities. More hours mean more direct care. The national average is about 3.5 hrs; below 3.0 is a red flag.Rankings are based only on facilities in Florida that report data for that category. Facilities without available data are excluded from the ranking.Click the rank badge to see the full State ranking.Click here to see the full State ranking.
vs avg
Staff type Hours / Day / Resident vs state avg
Registered Nurse (RN) Info RNs hold the highest nursing license and can assess residents, interpret test results, and direct care plans. More RN hours per day often signals stronger clinical oversight and faster response to health changes. 45m per day
LPN / LVN Info Licensed Practical Nurses (LPNs) or Licensed Vocational Nurses (LVNs) deliver routine hands-on care — medication administration, wound dressing, and monitoring vital signs. They work under RN supervision and make up a large share of daily bedside care. 58m per day
Nurse Aide Info Certified Nurse Aides (CNAs) provide the most direct day-to-day assistance: bathing, dressing, feeding, and mobility. Nurse aide hours are typically the largest staffing category and directly affect residents' quality of life. 2h 38m per day
Weekend Total Nursing Info Combined nursing hours (RN + LPN + Nurse Aide) per resident per day on weekends. Staffing often drops on weekends — this figure reveals whether the facility maintains adequate coverage outside of weekday hours. 3h 57m per day
Physical Therapist Info Hours per resident per day provided by licensed Physical Therapists (PTs) or PT Assistants. PT services help residents recover mobility after injury or illness and are especially important for post-acute (short-stay) rehabilitation. 8m per day
Weekend RN Info Registered nurse hours specifically on weekends. Facilities sometimes reduce RN presence on Saturdays and Sundays — a low weekend RN figure compared to weekday hours can indicate reduced clinical oversight when most administrative staff are absent. 33m per day

Capacity and availability

Avg. Length of Stay
45 days
Bed community size
200-bed community Rank #38 / 1074Bed count — State benchmarkedThis home is ranked 38th out of 1074 homes in Florida. Shows this facility's certified or reported bed count compared to other Florida facilities. Larger communities may offer more amenities, programs, and on-site services for residents and families.Rankings are based only on facilities in Florida that report data for that category. Facilities without available data are excluded from the ranking.Click the rank badge to see the full State ranking.Click here to see the full State ranking.
A large-scale community that may provide a wide range of amenities, services, and structured programs.
Walk Score
Walk Score: 84 / 100 Rank #74 / 1486Walk Score — State benchmarkedThis home is ranked 74th out of 1486 homes in Florida. Shows how walkable this facility's neighborhood is compared to the average Walk Score across Florida facilities. Higher scores benefit residents, families, and staff.Rankings are based only on facilities in Florida that report data for that category. Facilities without available data are excluded from the ranking.Click the rank badge to see the full State ranking.Click here to see the full State ranking.
Very walkable. Most errands can be accomplished on foot, and many essentials are within a short walk.

About this community

Occupancy

Occupancy rate
87%
Rank #159 / 258Occupancy rate — State benchmarkedThis home is ranked 159th out of 258 homes in Florida. Shows this facility's occupancy rate versus the Florida average, with its Statewide rank out of 258. Higher occupancy signals strong local demand and financial stability.Rankings are based only on facilities in Florida that report data for that category. Facilities without available data are excluded from the ranking.Click the rank badge to see the full State ranking.Click here to see the full State ranking.
Similar to the Florida average: 84.3%
Occupied beds
173 / 200
Average occupied beds in Florida homes 108 beds

License Details

Facility TypeAssisted Living Facility
StatusLicensed
IssuanceNovember 27, 2024
ExpirationNovember 26, 2026
CountyPinellas
License Number4759
CMS Certification Number106042

Ownership & Operating Entity

The Inn at Freedom Square is legally operated by Ccrc Opco Freedom Square Llc, and administered by Shelly Craddock.

Management CompanyLIFE CARE SERVICES LLC
Owner NameCcrc Opco Freedom Square LLC
Profit StatusFor-profit

Type Of Units

Private
200 units
Total beds
200 units

Staffing

Key information about the people who lead and staff this community.

Languages Spoken

English Spanish

Therapy & Rehabilitation

1 service
Respite Care

Additional Policies & Features

Continuing Care Retirement Community (CCRC)

Amenities & Lifestyle

Kitchenette
Kitchen
Outside Patio
Outside Common Area
Salon
Garden
Piano
Enclosed Courtyard
Library
Arts And Crafts Room

Contact The Inn at Freedom Square

Inspection History

In Florida, the Agency for Health Care Administration (AHCA) is the primary authority that conducts unannounced inspections and completes official health quality reports for all healthcare facilities.

Since 2012 · 14 years of data 33 citations 33 inspections
Inspection Score Info A composite 0–100 score combining this facility's inspections, citations, complaints, and enforcement actions relative to the Florida state average. The score below shows how many points this facility sits above or below the typical Florida assisted living residence score (the benchmark); higher is better.

10 points above the Florida average for assisted living residences (83/100)

Rank #203 / 876 in Florida Inspection Score — State benchmarked This home is ranked 203rd out of 876 homes in Florida. Shows this facility's inspection score compared to the Florida average among 876 comparable communities in the ranking pool. Rankings are based only on facilities in Florida that report data for that category. Facilities without available data are excluded from the ranking. Inspection score: 93 out of 100. Letter grade A. 10 points above the Florida average for assisted living residences (83/100)

Inspection Scorecard Info This scorecard compares key inspection, citation, and complaint metrics at this facility against the Florida state average. Metrics rated ≥15% worse than average are highlighted in red; those ≥15% better are highlighted in green.

Since 2012 vs. Florida state average
Overall vs. FL average 1 Worse Metrics worse than Florida average:
• Total inspections (27% above)
2 At Avg Metrics at Florida average:
• Total citations (at FL avg)
• Citations per year (at FL avg)
3 Better Metrics better than Florida average:
• Citations per inspection (23% below)
• Inspections with citations (63% below)
• Inspection citation rate (71% below)
Latest Inspection August 25, 2025 Complaint

Citations Info Citations are formal regulatory issues recorded during state inspections.

This Facility FL Average vs. FL Avg
Total citations Info Formal regulatory issues recorded by inspectors across all inspection types. 33 33 This facility has total citations in line with the Florida average (33 vs. FL avg 33).— At avg Rank #514 / 919 Total citations — State benchmarked This home is ranked 514th out of 919 homes in Florida. Shows this facility's total citations compared to the Florida average among 919 comparable communities in the ranking pool. Rankings are based only on facilities in Florida that report data for that category. Facilities without available data are excluded from the ranking.
Citations per year Info Average citations per year since 2012. 2.4 2.4 This facility has citations per year in line with the Florida average (2.4 vs. FL avg 2.4).— At avg
Citations per inspection Info Average citations per inspection. 1 1.3 This facility has 23% fewer citations per inspection than a typical Florida assisted living residence (1 vs. FL avg 1.3).↓ 23% better Rank #167 / 919 Citations per inspection — State benchmarked This home is ranked 167th out of 919 homes in Florida. Shows this facility's citations per inspection compared to the Florida average among 919 comparable communities in the ranking pool. Rankings are based only on facilities in Florida that report data for that category. Facilities without available data are excluded from the ranking.

Inspections Info State inspections evaluate whether the facility meets health and safety standards.

This Facility FL Average vs. FL Avg
Total inspections Info Combined count of all routine and focused inspections. Excludes complaint investigations. 33 26 This facility has 27% more total inspections than a typical Florida assisted living residence (33 vs. FL avg 26).↑ 27% worse
Inspections with citations Info Inspections that resulted in at least one regulatory citation. 6 16 This facility has 63% fewer inspections with citations than a typical Florida assisted living residence (6 vs. FL avg 16).↓ 63% better
Inspection citation rate Info Percentage of inspections that resulted in at least one citation. 18% 62% This facility has 44 percentage points lower inspection citation rate than a typical Florida assisted living residence (18% vs. FL avg 62%).↓ 44% better Rank #87 / 919 Inspection citation rate — State benchmarked This home is ranked 87th out of 919 homes in Florida. Shows this facility's % of inspections with citations compared to the Florida average among 919 comparable communities in the ranking pool. Rankings are based only on facilities in Florida that report data for that category. Facilities without available data are excluded from the ranking.

Inspection Reports Summary Info An editor-reviewed summary of the themes and findings across this facility's recent inspection reports.

  • Most recent inspection on August 25, 2025 found no deficiencies during a complaint investigation.
  • The facility had occasional Class 3 and Class 4 deficiencies in records and background screening from 2018 and earlier, but none have recurred recently.
  • Inspections from 2019 through 2025 consistently showed no deficiencies, indicating sustained compliance over the last six years.

Health Inspection History

Inspections since 2020
Total health inspections 3

State average N/A


Last Health inspection on Feb 2024

Total health citations
16 Rank #107 / 252Health citations — State benchmarkedThis home is ranked 107th out of 252 homes in Florida. Shows this facility's total health deficiency citations benchmarked to the Florida State average, with a ranking across all 252 FL facilities. Lower citation counts earn a better rank.Rankings are based only on facilities in Florida that report data for that category. Facilities without available data are excluded from the ranking.Click the rank badge to see the full State ranking.Click here to see the full State ranking.

State average N/A

Citations per inspection
5.33 Rank #176 / 252Citations per inspection — State benchmarkedThis home is ranked 176th out of 252 homes in Florida. Shows average deficiency citations per CMS inspection for this facility versus the Florida mean across 252 facilities with citation data. Lower is better.Rankings are based only on facilities in Florida that report data for that category. Facilities without available data are excluded from the ranking.Click the rank badge to see the full State ranking.Click here to see the full State ranking.

State average N/A


Health citations are formal notices following inspections when they fail to comply with safety and care standards.

All 16 citations resulted from standard inspections.

Breakdown of citation severity (last 6 years)
Critical health citations
0
In line with State average

State average: N/A


Serious health citations
0
In line with State average

State average: N/A

0 critical citations State average: N/A

0 serious citations State average: N/A

16 moderate citations State average: N/A

0 minor citations State average: N/A
Citations history (last 6 years)
Infection Control moderate citation Feb 08, 2024
Corrected

Quality of Care moderate citation Feb 08, 2024
Corrected

Quality of Care moderate citation Feb 08, 2024
Corrected

Care Planning moderate citation Feb 08, 2024
Corrected

Staffing Data

Reporting period: October 1 – December 31, 2025 (Q4 2025). Source: CMS Payroll-Based Journal report.

Total staff 184
Employees 156
Contractors 28
Staff to resident ratio 1.72 : 1
0% compared with State average

State average ratio: 0 : 0

Avg staff/day 67
Average shift 7.4 hours
0% compared with State average

State average: 0 hours

Total staff hours (quarter) 45,484

Nursing staff breakdown

Q4 2025 · Oct 1 – Dec 31 More info This data comes from the CMS Payroll-Based Journal report covering October 1 – December 31, 2025.
Registered Nurse

Manages medical care and health needs.

RN Staff Info All 16 RN Staff are full-time employees. No contractors work on this role. 16
Average shift length Info Average shift length. Calculated as total hours divided by days worked and average staff per day. 7.6 hours
Licensed Practical Nurse

Assists with medical care and medications.

LPN Staff Info All 27 LPN Staff are full-time employees. No contractors work on this role. 27
Average shift length Info Average shift length. Calculated as total hours divided by days worked and average staff per day. 7.7 hours
Certified Nursing Assistant

Helps with daily care and mobility.

CNA Staff Info All 79 CNA Staff are full-time employees. No contractors work on this role. 79
Average shift length Info Average shift length. Calculated as total hours divided by days worked and average staff per day. 7.3 hours

Contractor staffing

Q4 2025 · Oct 1 – Dec 31 More info This data comes from the CMS Payroll-Based Journal report covering October 1 – December 31, 2025.

Total hours from contractors

9.6%

4,381 contractor hours this quarter

Physical Therapy Assistant: 7 Respiratory Therapy Technician: 7 Speech Language Pathologist: 6 Qualified Social Worker: 3 Physical Therapy Aide: 3 Qualified Activities Professional: 2

Staff by category

Q4 2025 · Oct 1 – Dec 31 More info This data comes from the CMS Payroll-Based Journal report covering October 1 – December 31, 2025.
Certified Nursing Assistant 79 0 79 23,011 92 100% 7.3
Licensed Practical Nurse 27 0 27 6,794 92 100% 7.7
Registered Nurse 16 0 16 4,338 92 100% 7.6
Clinical Nurse Specialist 6 0 6 1,796 70 76% 7.3
RN Director of Nursing 11 0 11 1,687 68 74% 7.5
Physical Therapy Assistant 0 7 7 1,252 77 84% 7.2
Other Dietary Services Staff 6 0 6 1,184 91 99% 6.7
Respiratory Therapy Technician 0 7 7 1,113 79 86% 6.5
Speech Language Pathologist 0 6 6 1,023 71 77% 7.7
Qualified Social Worker 0 3 3 501 65 71% 7.7
Dental Services Staff 3 0 3 477 57 62% 7.8
Nurse Practitioner 2 0 2 454 61 66% 7.4
Occupational Therapy Aide 1 0 1 450 60 65% 7.5
Administrator 3 0 3 448 56 61% 8
Mental Health Service Worker 1 0 1 440 55 60% 8
Physical Therapy Aide 0 3 3 397 53 58% 7.3
Qualified Activities Professional 0 2 2 96 28 30% 3.4
Other Physician 1 0 1 24 3 3% 8
79 Certified Nursing Assistant
% of Days 100%
27 Licensed Practical Nurse
% of Days 100%
16 Registered Nurse
% of Days 100%
6 Clinical Nurse Specialist
% of Days 76%
11 RN Director of Nursing
% of Days 74%
7 Physical Therapy Assistant
% of Days 84%
6 Other Dietary Services Staff
% of Days 99%
7 Respiratory Therapy Technician
% of Days 86%
6 Speech Language Pathologist
% of Days 77%
3 Qualified Social Worker
% of Days 71%
3 Dental Services Staff
% of Days 62%
2 Nurse Practitioner
% of Days 66%
1 Occupational Therapy Aide
% of Days 65%
3 Administrator
% of Days 61%
1 Mental Health Service Worker
% of Days 60%
3 Physical Therapy Aide
% of Days 58%
2 Qualified Activities Professional
% of Days 30%
1 Other Physician
% of Days 3%

Penalties and fines

Federal penalties imposed by CMS for regulatory violations, including civil money penalties (fines) and denials of payment for new Medicare/Medicaid admissions.

Source: CMS Penalties Database

No penalties in the past 3 years

No civil money penalties or payment denials were reported in the last 3 years.

Quality of care over time

These measures show how residents usually do over time at this home, based on health outcomes and preventive care.

High-risk clinical events score Info A composite score based on pressure ulcers, falls with injury, weight loss, walking ability decline, and activities of daily living decline. 11.4
54% worse than State average

State average: 7.4

Functional decline score Info A composite score based on activities of daily living decline, walking ability decline, and incontinence. 20.3
64% worse than State average

State average: 12.4

Long-stay resident measures
Need for Help with Daily Activities Increased Info Percent of long-stay residents whose need for help with daily activities has increased 15.2%
45% worse than State average

State average: 10.5%

Walking Ability Worsened Info Percent of long-stay residents whose ability to move independently worsened 28.9%
123% worse than State average

State average: 12.9%

Low Risk Residents with Bowel/Bladder Incontinence Info Percent of low risk long-stay residents who lose control of their bowels or bladder 16.8%
24% worse than State average

State average: 13.5%

Falls with Major Injury Info Percent of long-stay residents experiencing one or more falls with major injury 2.8%
5% worse than State average

State average: 2.6%

High Risk Residents with Pressure Ulcers Info Percent of long-stay high risk residents with pressure ulcers 3.4%
37% better than State average

State average: 5.4%

Urinary Tract Infection Info Percent of long-stay residents with a urinary tract infection 3.7%
315% worse than State average

State average: 0.9%

Lost Too Much Weight Info Percent of long-stay residents who lose too much weight 7.0%
17% worse than State average

State average: 6.0%

Depressive Symptoms Info Percent of long-stay residents who have depressive symptoms 0.0%
100% better than State average

State average: 3.3%

Antipsychotic Use Info Percent of long-stay residents who received an antipsychotic medication 4.8%
40% better than State average

State average: 8.0%

Pneumococcal Vaccine Info Percent of long-stay residents assessed and appropriately given the pneumococcal vaccine 100.0%
In line with State average

State average: 97.7%

Influenza Vaccine Info Percent of long-stay residents assessed and appropriately given the seasonal influenza vaccine 100.0%
In line with State average

State average: 99.2%

Short-stay resident measures
Pneumococcal Vaccine Info Percent of short-stay residents assessed and appropriately given the pneumococcal vaccine 100.0%
6% better than State average

State average: 94.0%

Antipsychotic medication increase Info Percent of short-stay residents who newly received an antipsychotic medication 1.5%
In line with State average

State average: 1.5%

Influenza Vaccine Info Percent of short-stay residents assessed and appropriately given the seasonal influenza vaccine 99.3%
5% better than State average

State average: 94.7%

Breakdown by payment type

Medicare

33% of new residents, usually for short-term rehab.

Typical stay 28 days

Private pay

65% of new residents, often for short stays.

Typical stay 3 - 4 months

Medicaid

2% of new residents, often for long-term daily care.

Typical stay 1 - 2 years

Facility Characteristics

Source: CMS Long-Term Care Facility Characteristics (Data as of Jan 2026)

Total residents 107
Medicare
28
26.2% of residents
Medicaid
31
29% of residents
Private pay or other
48
44.9% of residents
Programs & Services
Residents Group

Residents meet regularly to discuss policies, care quality, and activities

CCRC

Part of a Continuing Care Retirement Community offering multiple care levels

Active Resident Council

Organized group of residents that meets regularly to discuss facility policies, quality of life, and activities.

Finances and operations

Based on CMS SNF Cost Report for fiscal year ending in 12/2023.

For-profit
Corporation
Net patient revenue Info Net patient revenue — what the home actually collects for resident care, after contractual allowances, bad debt and discounts are subtracted from its gross charges (CMS cost report, Worksheet G-3). It covers resident care only; money the home earns from other sources is shown separately as "Other income."
$24.0M
Net patient income Info Net patient income: net patient revenue minus the home's total operating expenses. A positive figure means it earns more from resident care than it spends to deliver it; a negative figure means the opposite. It excludes non-operating "other income."
-$15.7M
For-profit Corporation
Net patient revenue Info Net patient revenue — what the home actually collects for resident care, after contractual allowances, bad debt and discounts are subtracted from its gross charges (CMS cost report, Worksheet G-3). It covers resident care only; money the home earns from other sources is shown separately as "Other income."
$24.0M Rank #18 / 257Revenue — State benchmarkedThis home is ranked 18th out of 257 homes in Florida. Shows this facility's annual revenue compared to the Florida average. Higher revenue generally means more resources for staffing and capital — read alongside Payroll %.Rankings are based only on facilities in Florida that report data for that category. Facilities without available data are excluded from the ranking.Click the rank badge to see the full State ranking.Click here to see the full State ranking.
Net patient income Info Net patient income: net patient revenue minus the home's total operating expenses. A positive figure means it earns more from resident care than it spends to deliver it; a negative figure means the opposite. It excludes non-operating "other income."
-$15.7M
Other income Info Money the home earns outside of resident care — such as investments, grants, rentals and other non-operating sources (CMS cost report, Worksheet G-3). It is tracked separately from net patient revenue: it is not part of that figure, and it is not included in net patient income.
$17.1M
Payroll costs Info Staff salaries plus wage-related costs — benefits such as payroll taxes, health insurance and retirement — from the home's own accounting records (CMS cost report, Worksheet A). Contract or agency labor is counted separately, under other operating costs. Rank #9 / 257Payroll — State benchmarkedThis home is ranked 9th out of 257 homes in Florida. Shows total annual staff payroll benchmarked to the Florida average. Higher payroll investment relative to peers often signals better staffing and less reliance on cheaper contract labor.Rankings are based only on facilities in Florida that report data for that category. Facilities without available data are excluded from the ranking.Click the rank badge to see the full State ranking.Click here to see the full State ranking.
$20.1M 83.4% of net patient revenue Info Payroll as a share of revenue: staff salaries and wage-related benefits divided by net patient revenue. A higher figure means more of each revenue dollar goes to staff pay. Rank #143 / 257Payroll % — State benchmarkedThis home is ranked 143rd out of 257 homes in Florida. Shows payroll as a percentage of revenue versus the Florida average. Well-run Florida facilities typically land around 49–56% — the top third Statewide. Below 25% may signal understaffing or heavy agency use — read with Staffing ratings.Rankings are based only on facilities in Florida that report data for that category. Facilities without available data are excluded from the ranking.Click the rank badge to see the full State ranking.Click here to see the full State ranking.
Other operating costs Info Everything it costs to run the home apart from payroll — food, utilities, supplies, maintenance, contract labor and administration. Calculated as total operating expense minus payroll (staff salaries and wage-related benefits).
$19.6M
Total costs Info The home's total operating expense for the year — all the costs of running it, salaries included (CMS cost report, Worksheet G-3).
$39.7M

Who this home usually serves

TYPE OF STAY

Primarily short stays

Residents typically stay for brief periods, with frequent admissions and discharges throughout the year.

Most new residents arrive under private pay (65% of admissions), and a typical private pay stay runs around 3 - 4 months.

Admissions
848 total

Coverage residents most often arrive under.

Medicare 33%
Private pay 65%
Medicaid 2%
Discharges
832 total

Coverage residents most often leave under.

Medicare 30%
Private pay 64%
Medicaid 5%

Activities in this home

Places of interest near The Inn at Freedom Square

Address 0.0 miles from city center Info Estimated distance in miles from Seminole's city center to The Inn at Freedom Square's address, calculated via Google Maps.

Calculate Travel Distance to The Inn at Freedom Square

Add your location

Address

Compare Nursing Homes around the area

The information below is reported by the Florida Agency for Health Care Administration (AHCA).

The Inn at Freedom Square
NH
AL
IL
MC
RC
Seminole - 200 - 84 -
Terracina Grand
NH
AL
IL
MC
RC
Naples - 200 A+ 12 Studio / 1 Bed / 2 Bed
Brookdale DeLand
NH
AL
MC
Deland (Scarlett) - 89 A+ 14 Studio / Suite
The Oaks of Clearwater
NH
AL
IL
MC
Clearwater (Oak Bluffs) - 175 B- 64 Studio / 1 Bed / 2 Bed
The Bridge at Ocala
NH
AL
Ocala - 95 A+ 44 Studio / 1 Bed

Frequently Asked Questions about The Inn at Freedom Square

What languages are spoken at The Inn at Freedom Square?

The team at The Inn at Freedom Square speaks English and Spanish.

Who is the owner of The Inn at Freedom Square?

The Inn at Freedom Square is legally operated by Ccrc Opco Freedom Square Llc, and administered by Shelly Craddock.

Is The Inn at Freedom Square in a walkable area?

The Inn at Freedom Square has a walk score of 84. Very walkable. Most errands can be accomplished on foot, and many essentials are within a short walk.

What is the license number of The Inn at Freedom Square?

According to FL state health department records, The Inn at Freedom Square's license number is 4759.

When does The Inn at Freedom Square's license expire?

According to FL state health department records, The Inn at Freedom Square's license expires on November 26, 2026.

What is the occupancy rate at The Inn at Freedom Square?

The Inn at Freedom Square's occupancy is 87%.

What payment types does The Inn at Freedom Square accept?

The Inn at Freedom Square accepts Other.

Guides for Better Senior Living

Care Cost Calculator: See Prices in Your Area

Nursing Home Data Explorer

Don’t Wait Too Long: 7 Red Flag Signs Your Parent Needs Assisted Living Now

The True Cost of Assisted Living in 2025 – And How Families Are Paying For It

Understanding Senior Living Costs: Pricing Models, Discounts & Financial Assistance