Explore Open Rooms

1 Contact details
2 What type of senior care service are you looking for?
3 What budget do you have in mind for senior care?
4 How soon do you need to find care?
5 Additional details

Thank you for your interest!

Our team will be in touch shortly to help with next steps.

Nursing Home in Jefferson City

CMS overall rating Info The Overall CMS Rating combines results from health inspections, staffing levels and quality measures. Health inspections carry the most weight. Staffing and quality scores can increase or decrease the final rating based on performance compared to state and national standards.

The Jefferson City Nursing and Rehabilitation Center

1221 Southgate Ln, Jefferson City, MO 65109 View map
Overview of The Jefferson City Nursing and Rehabilitation Center

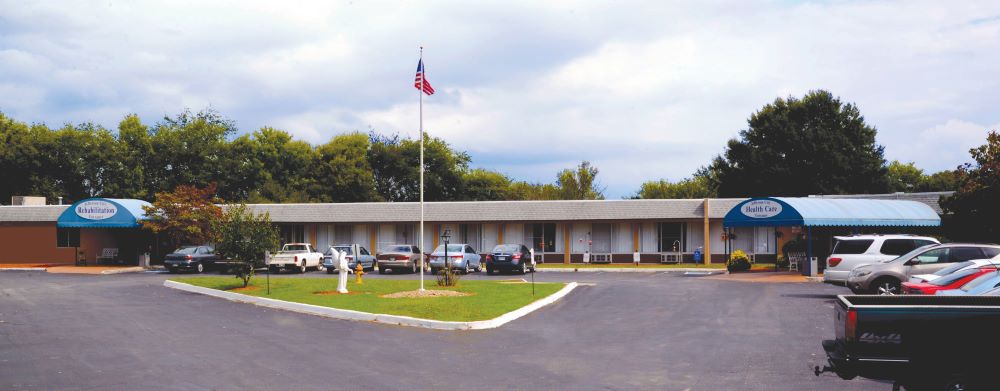
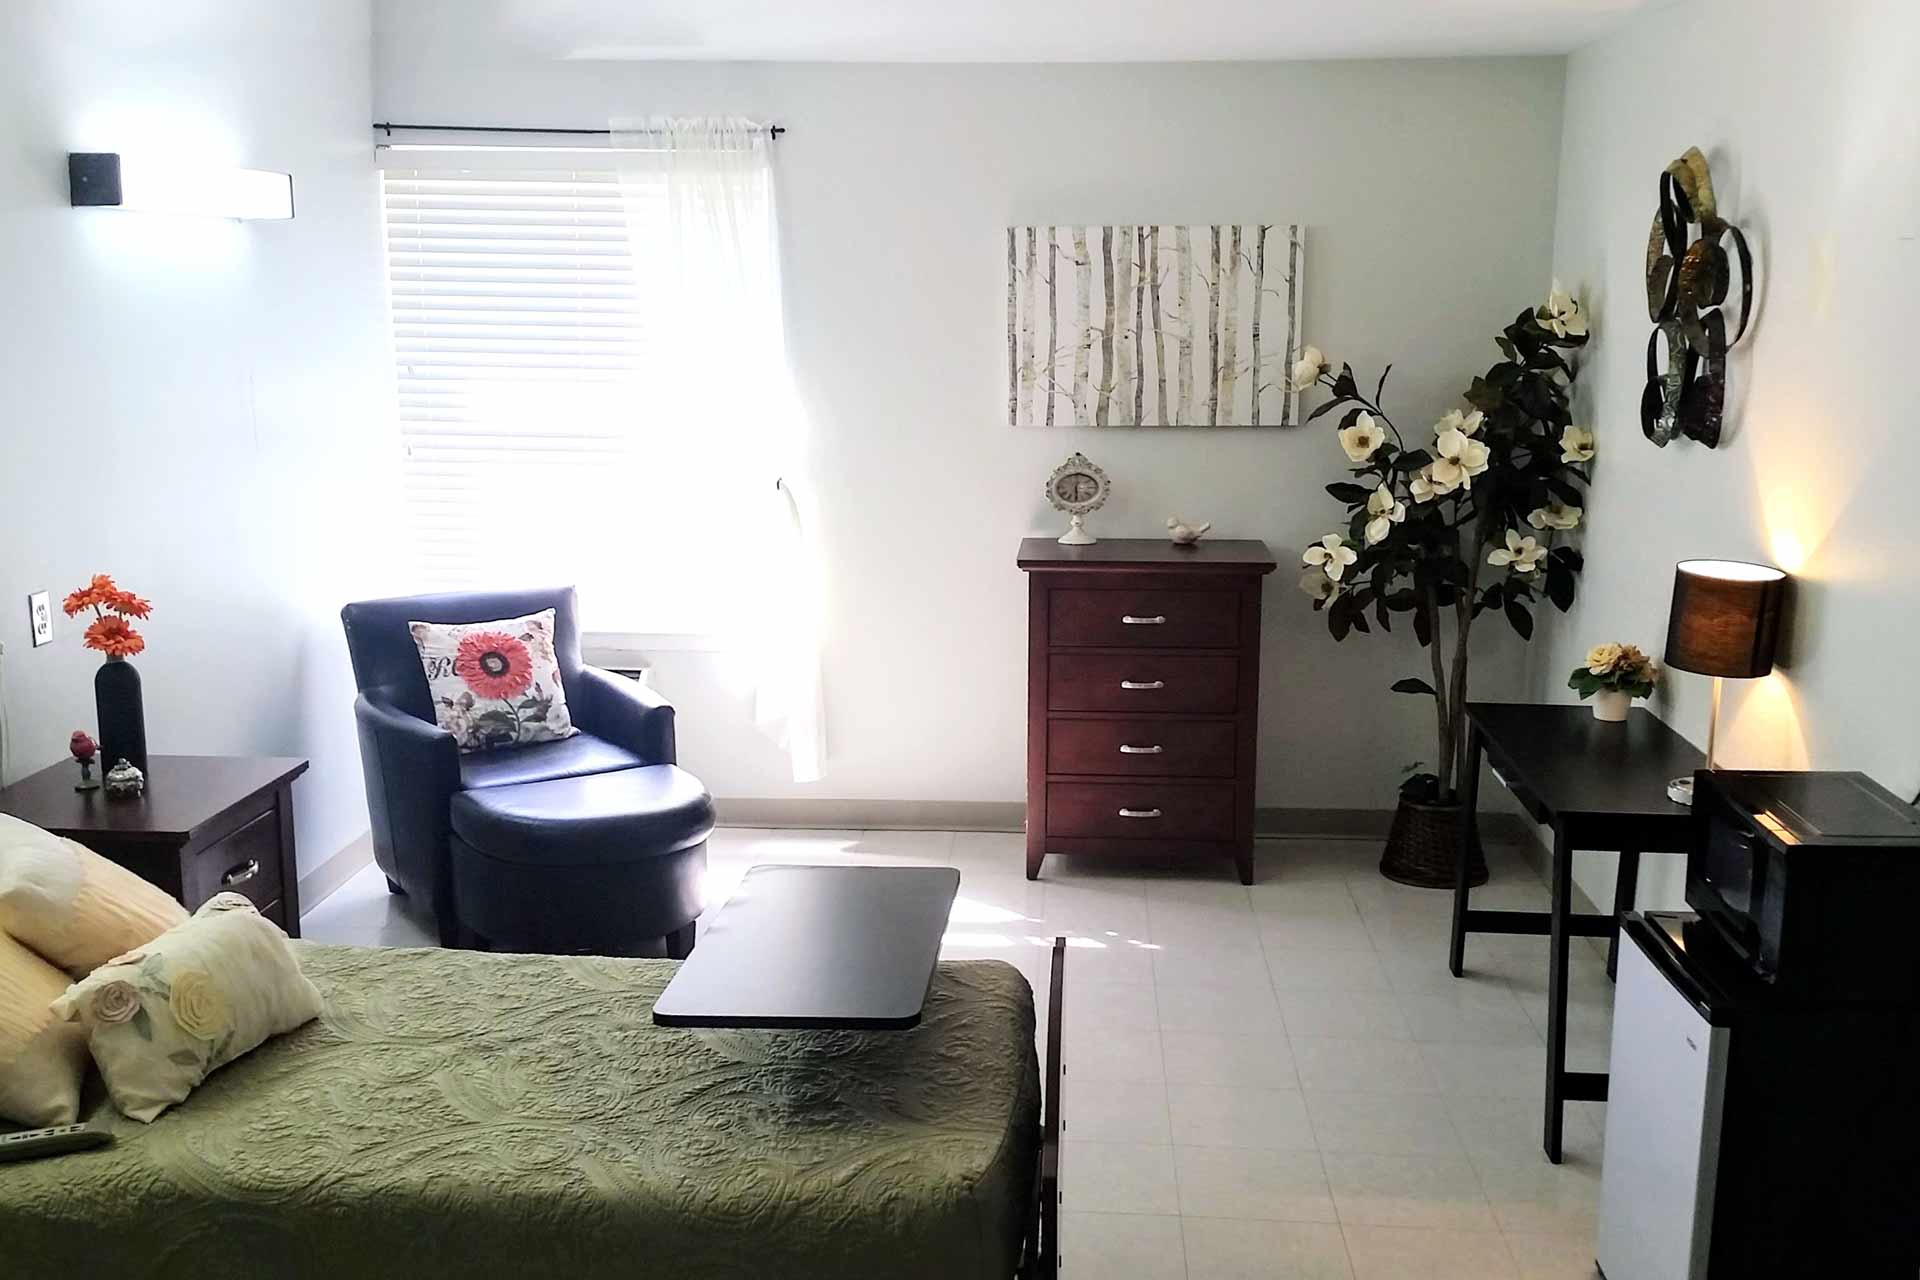
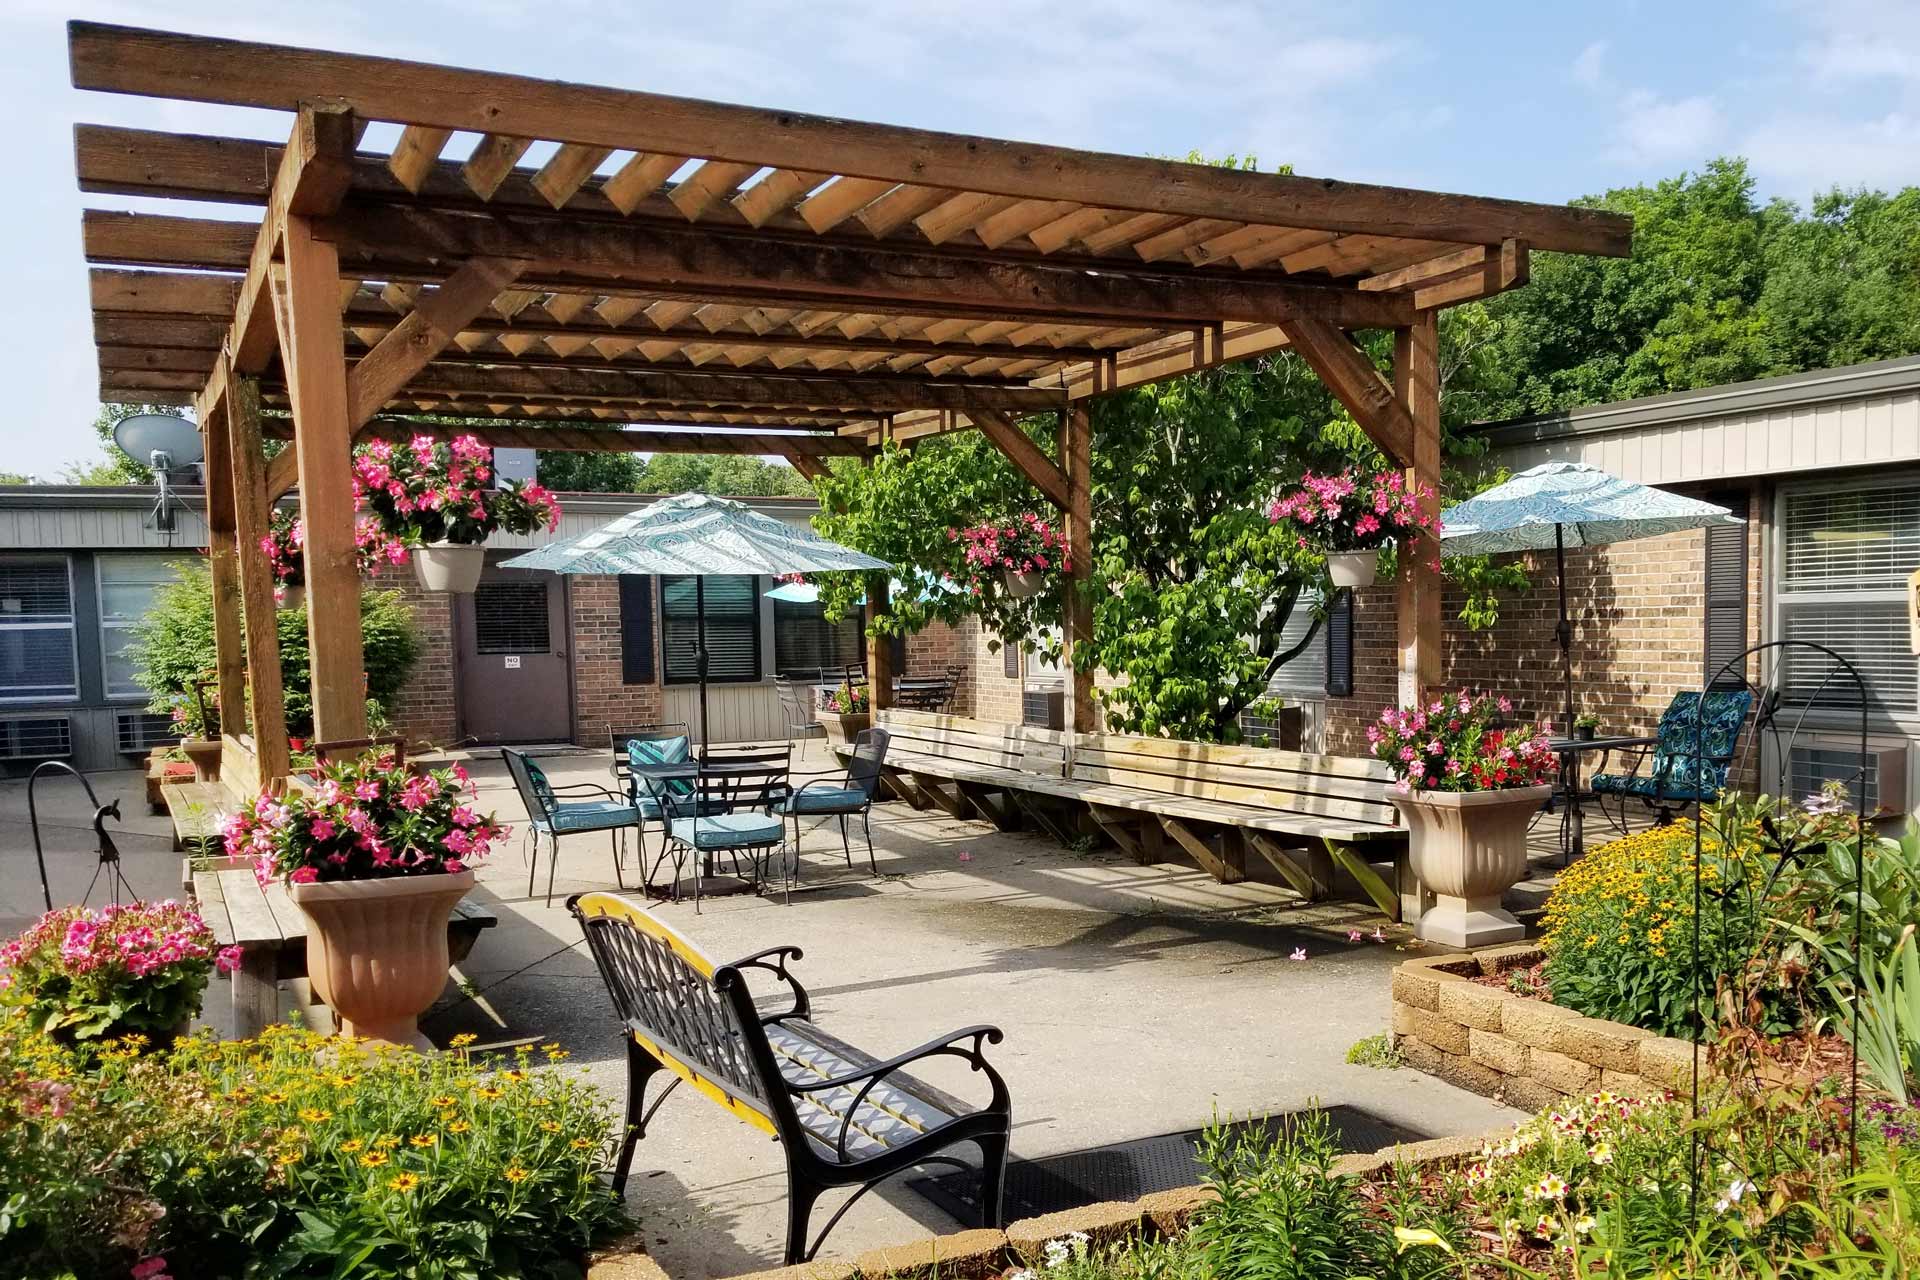
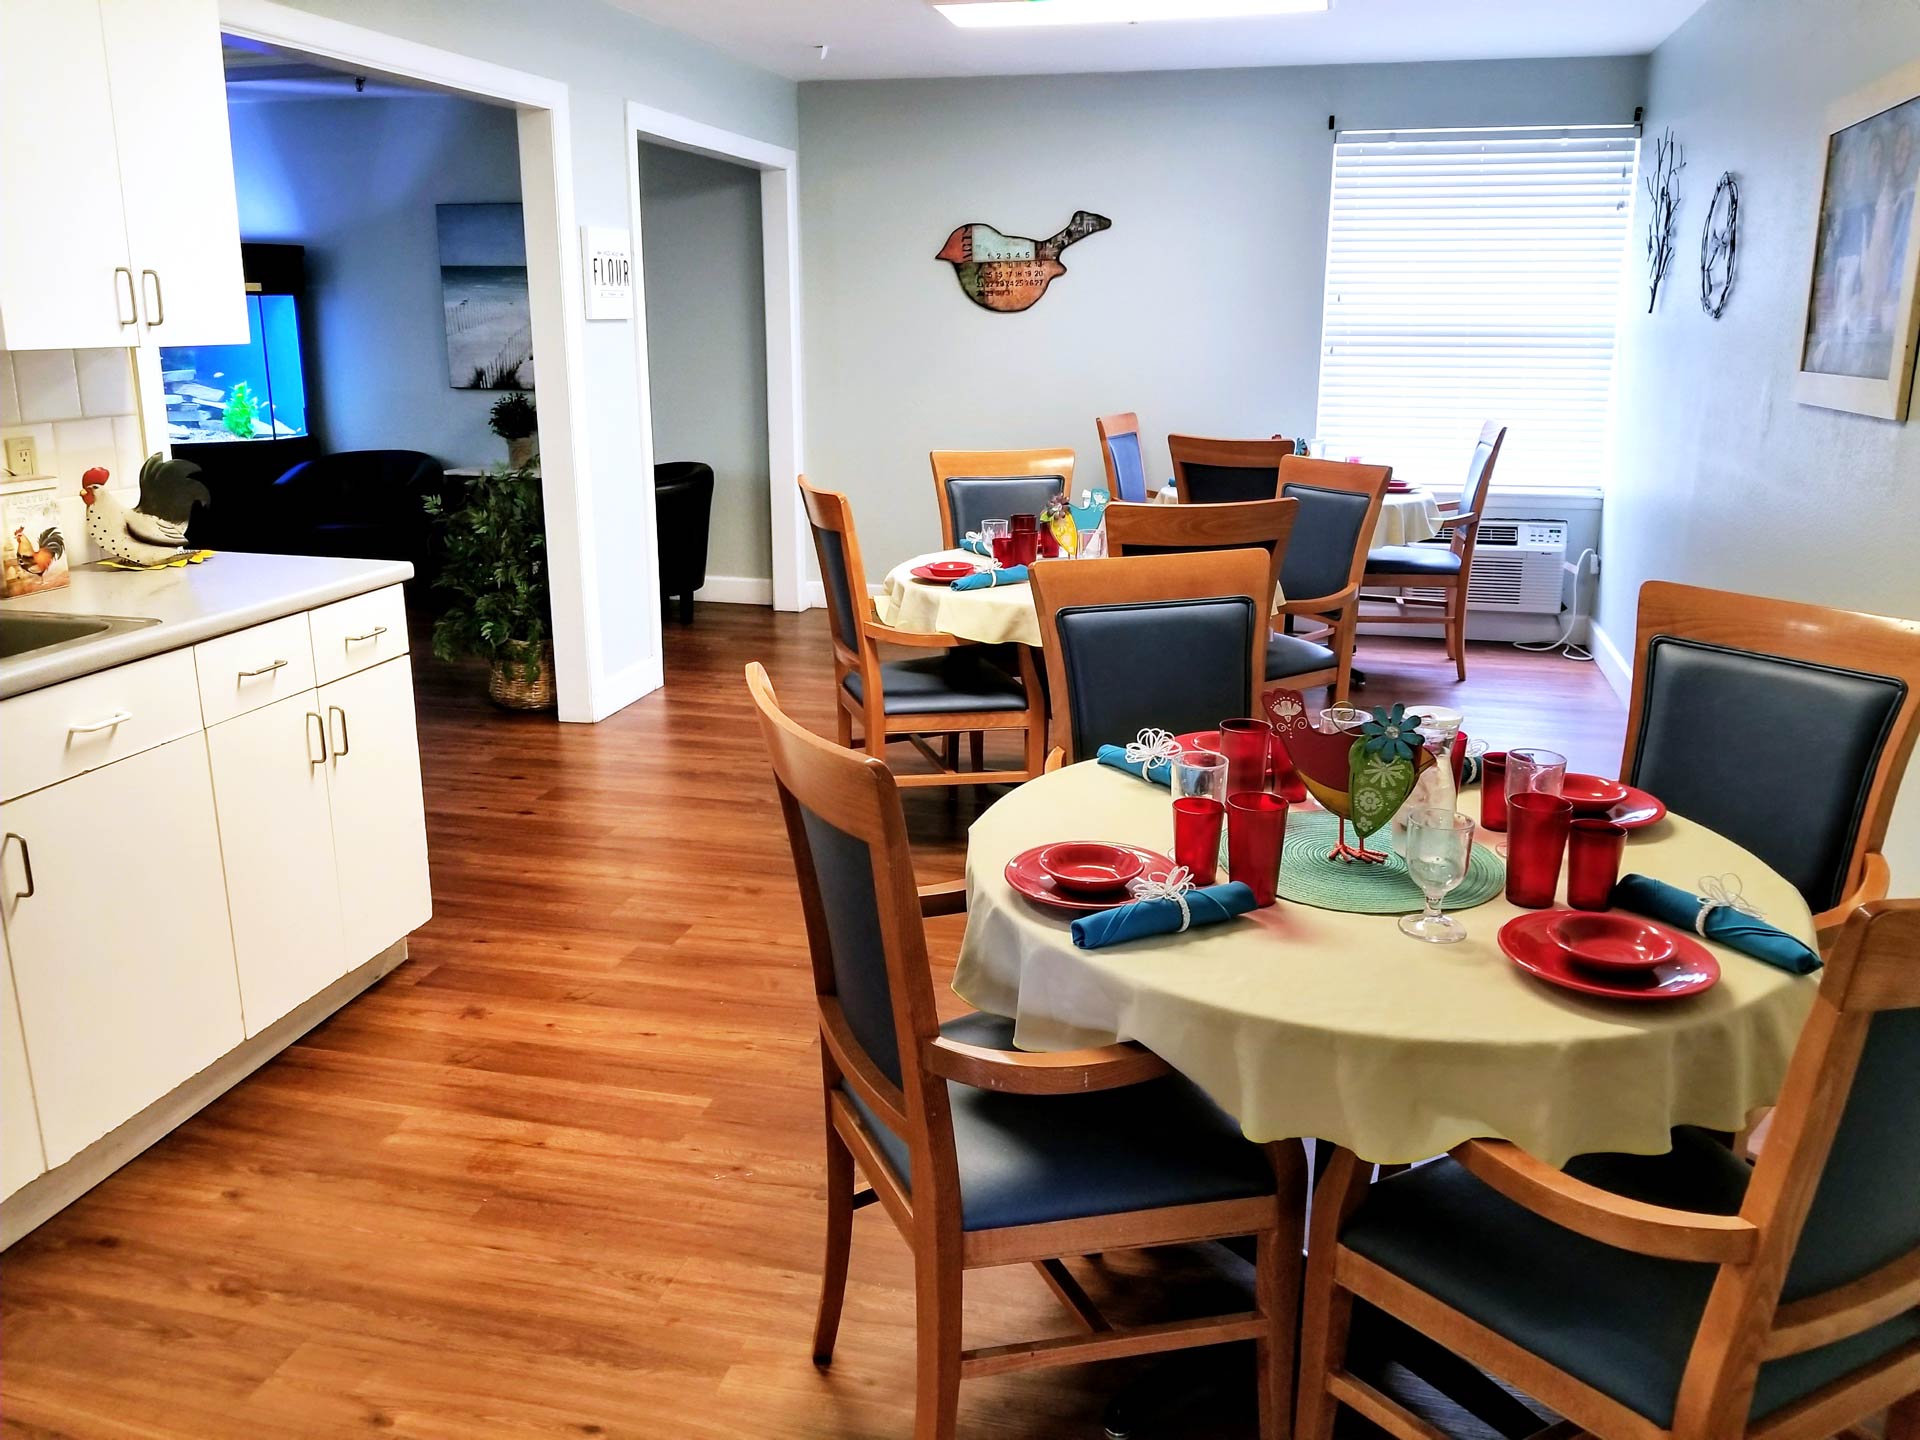
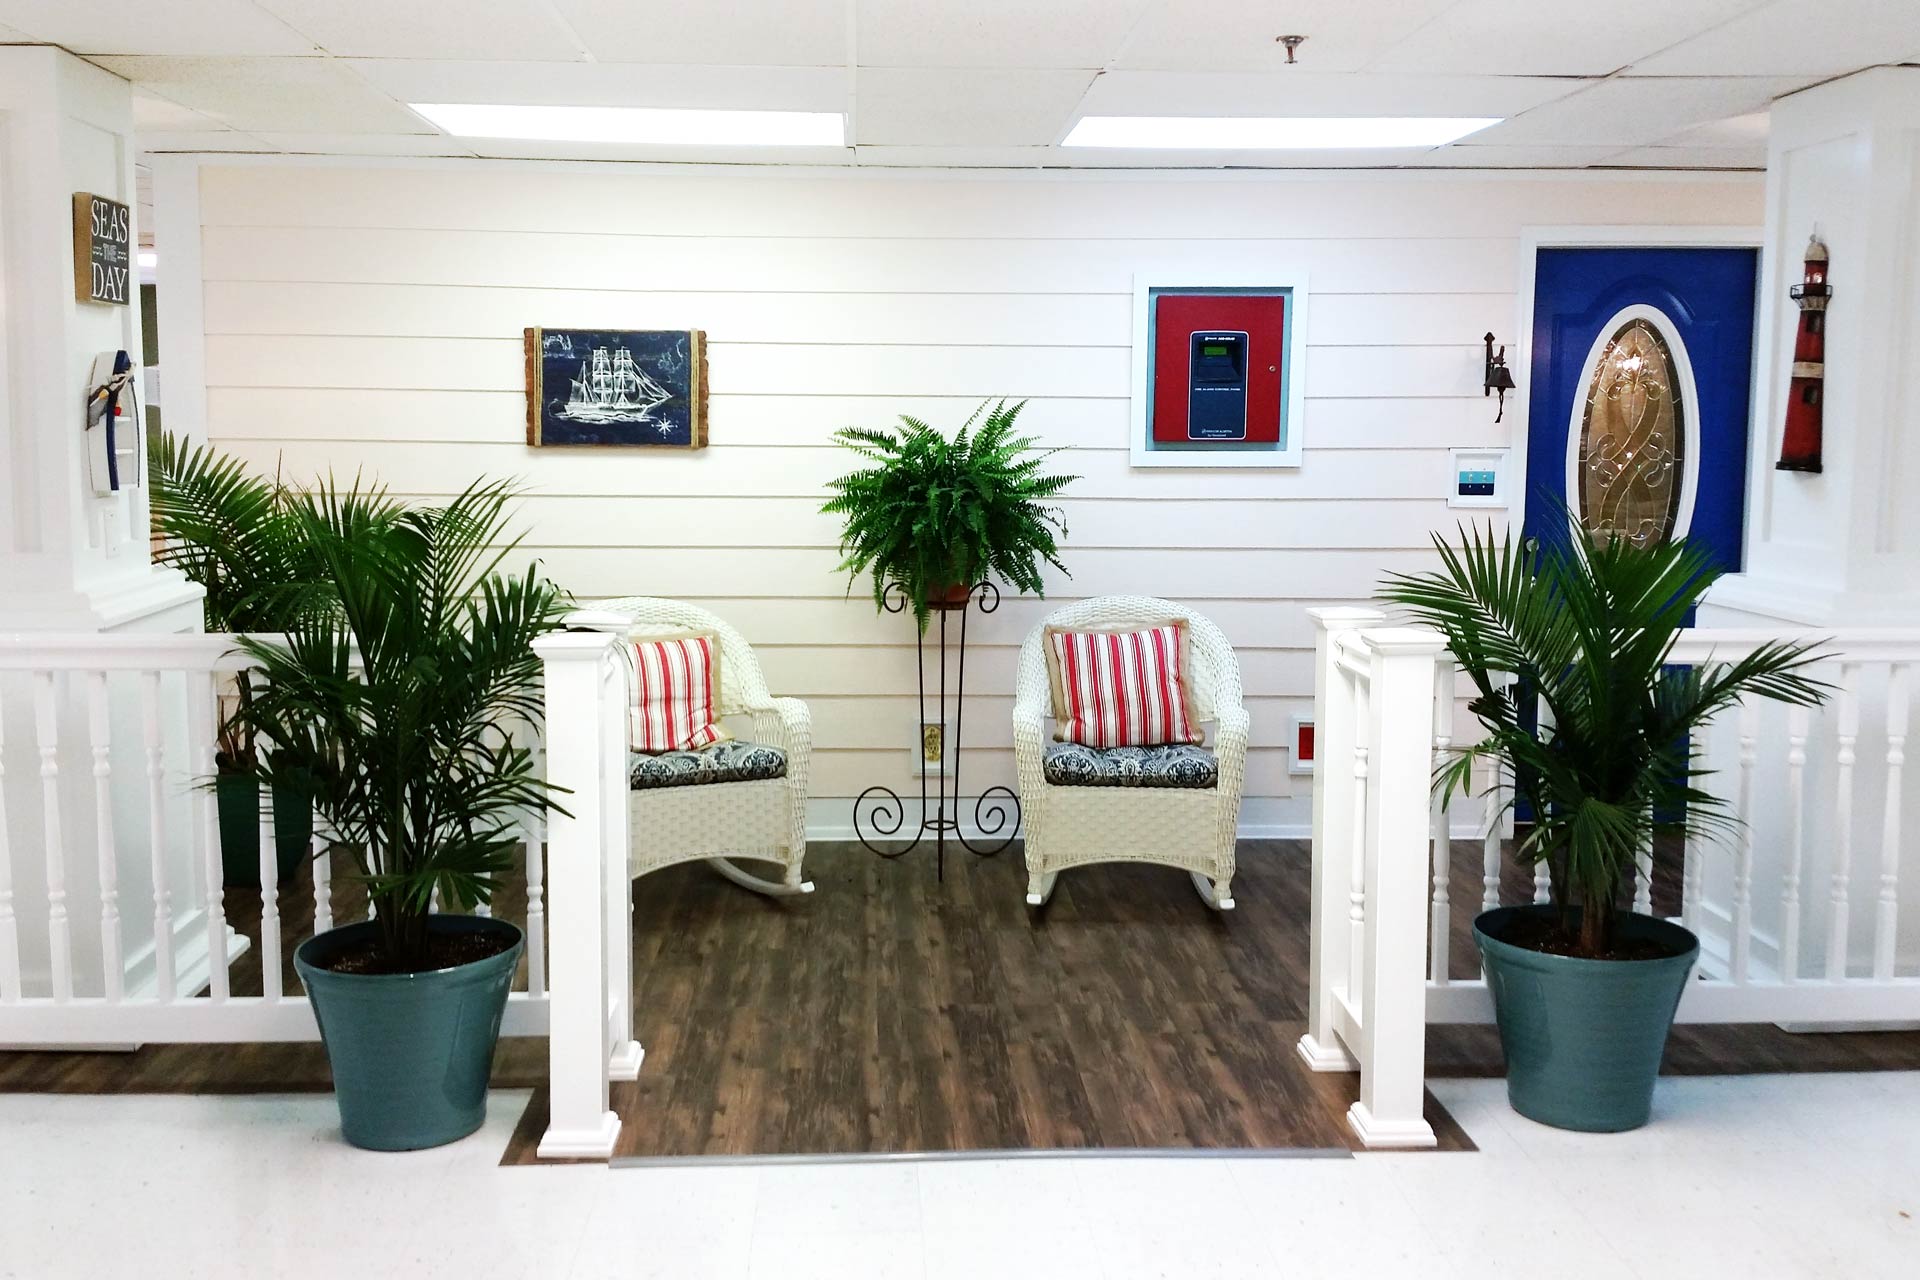
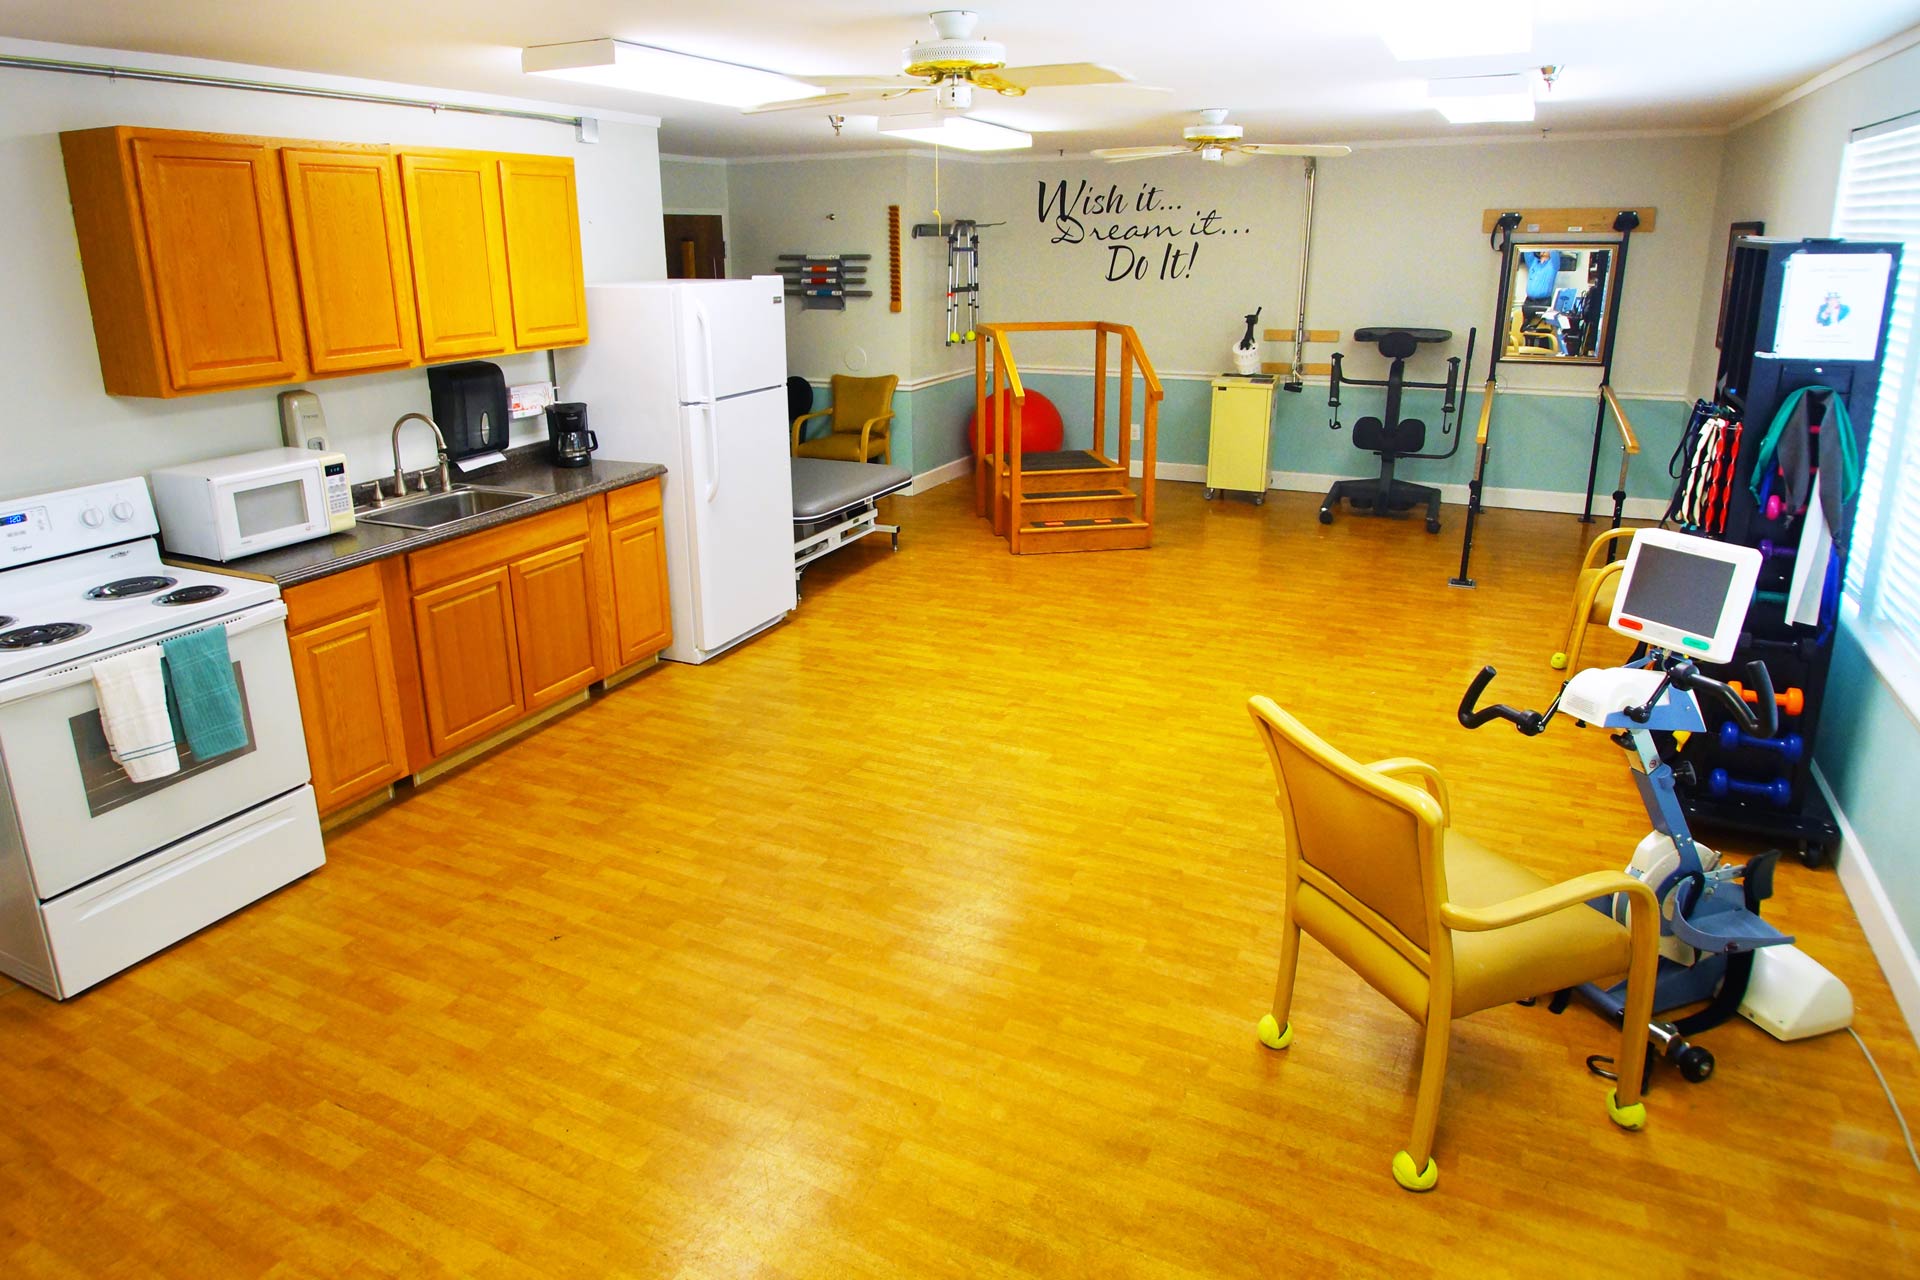
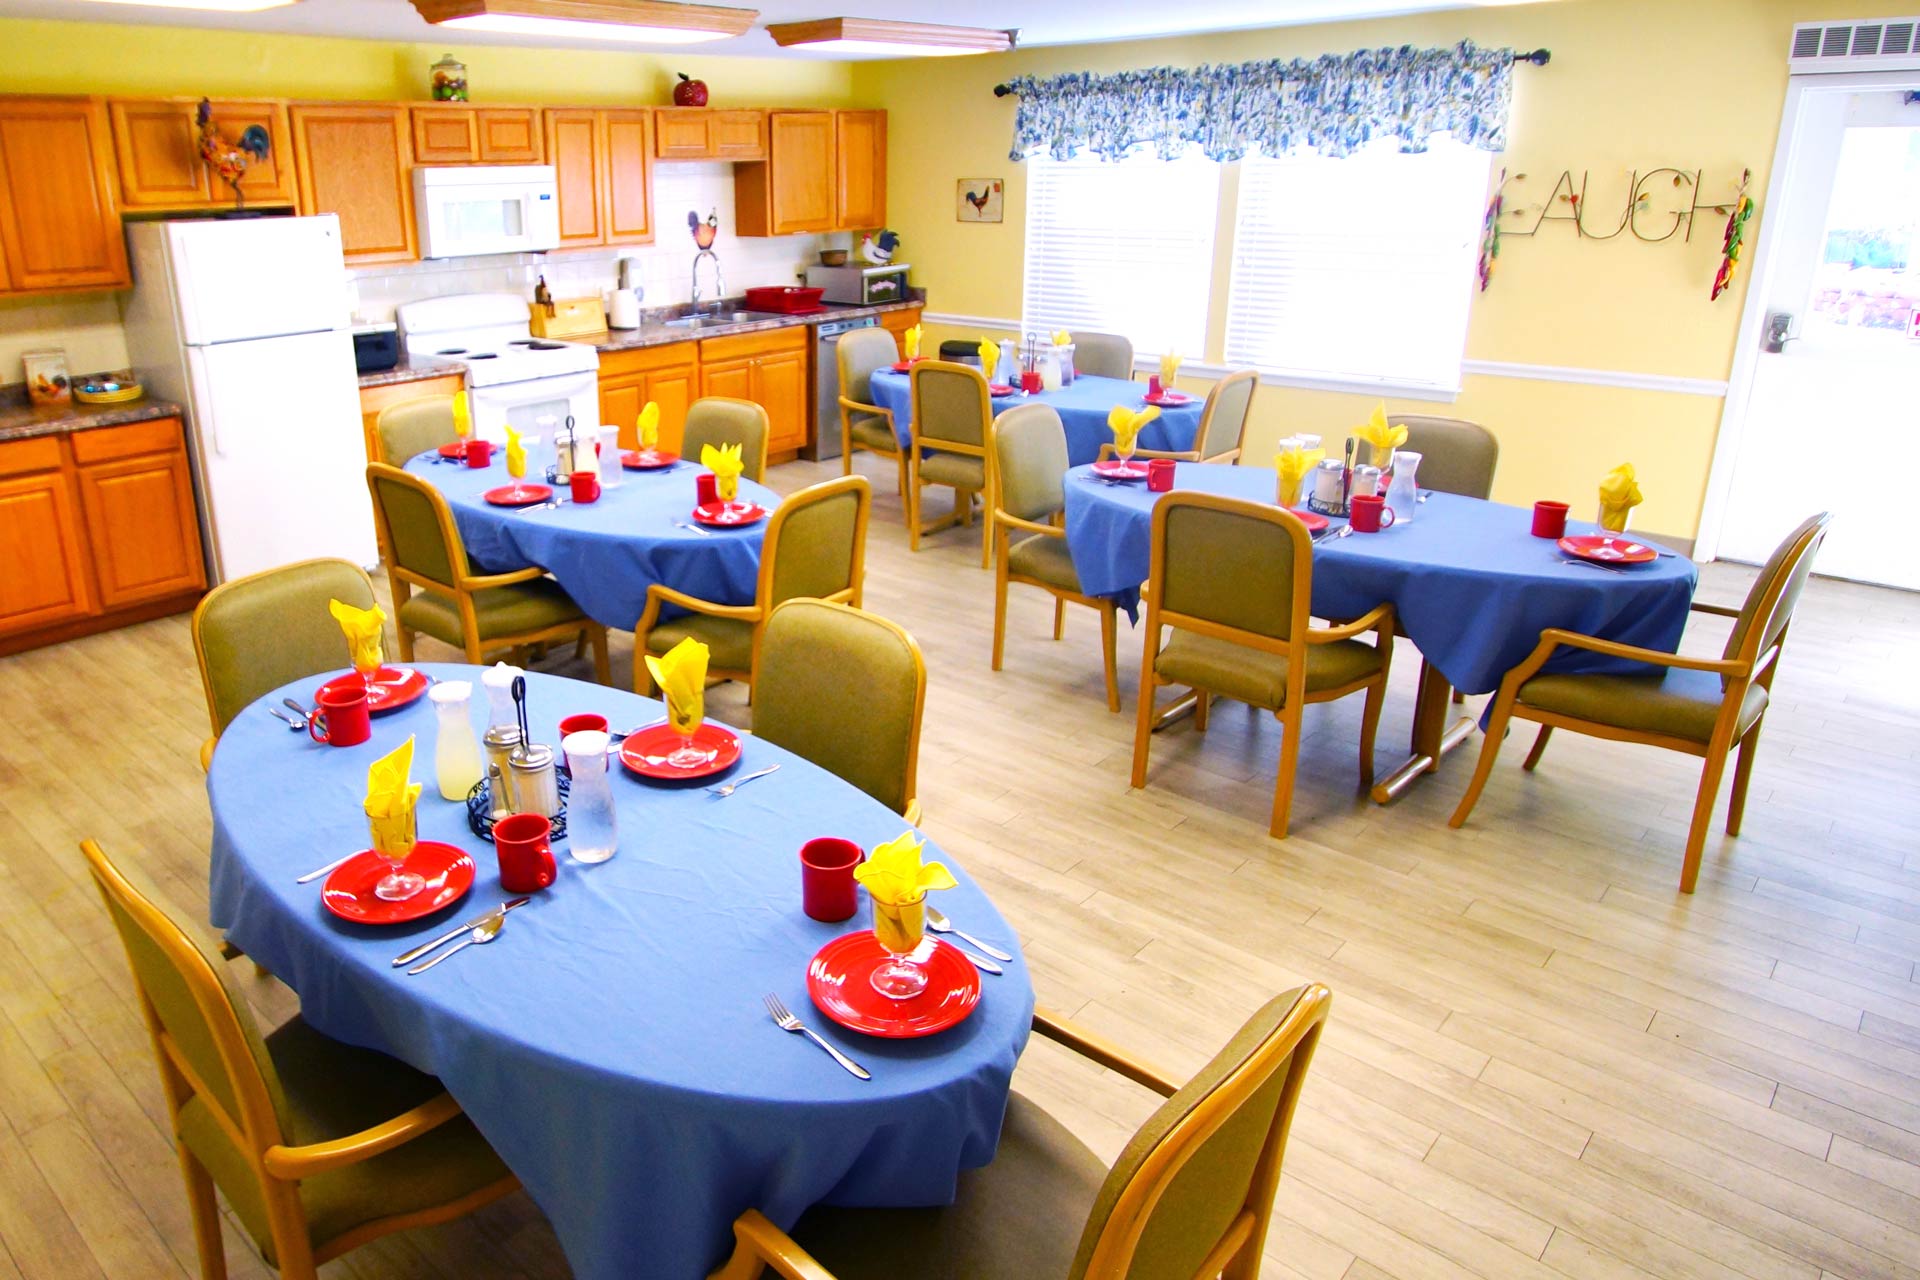
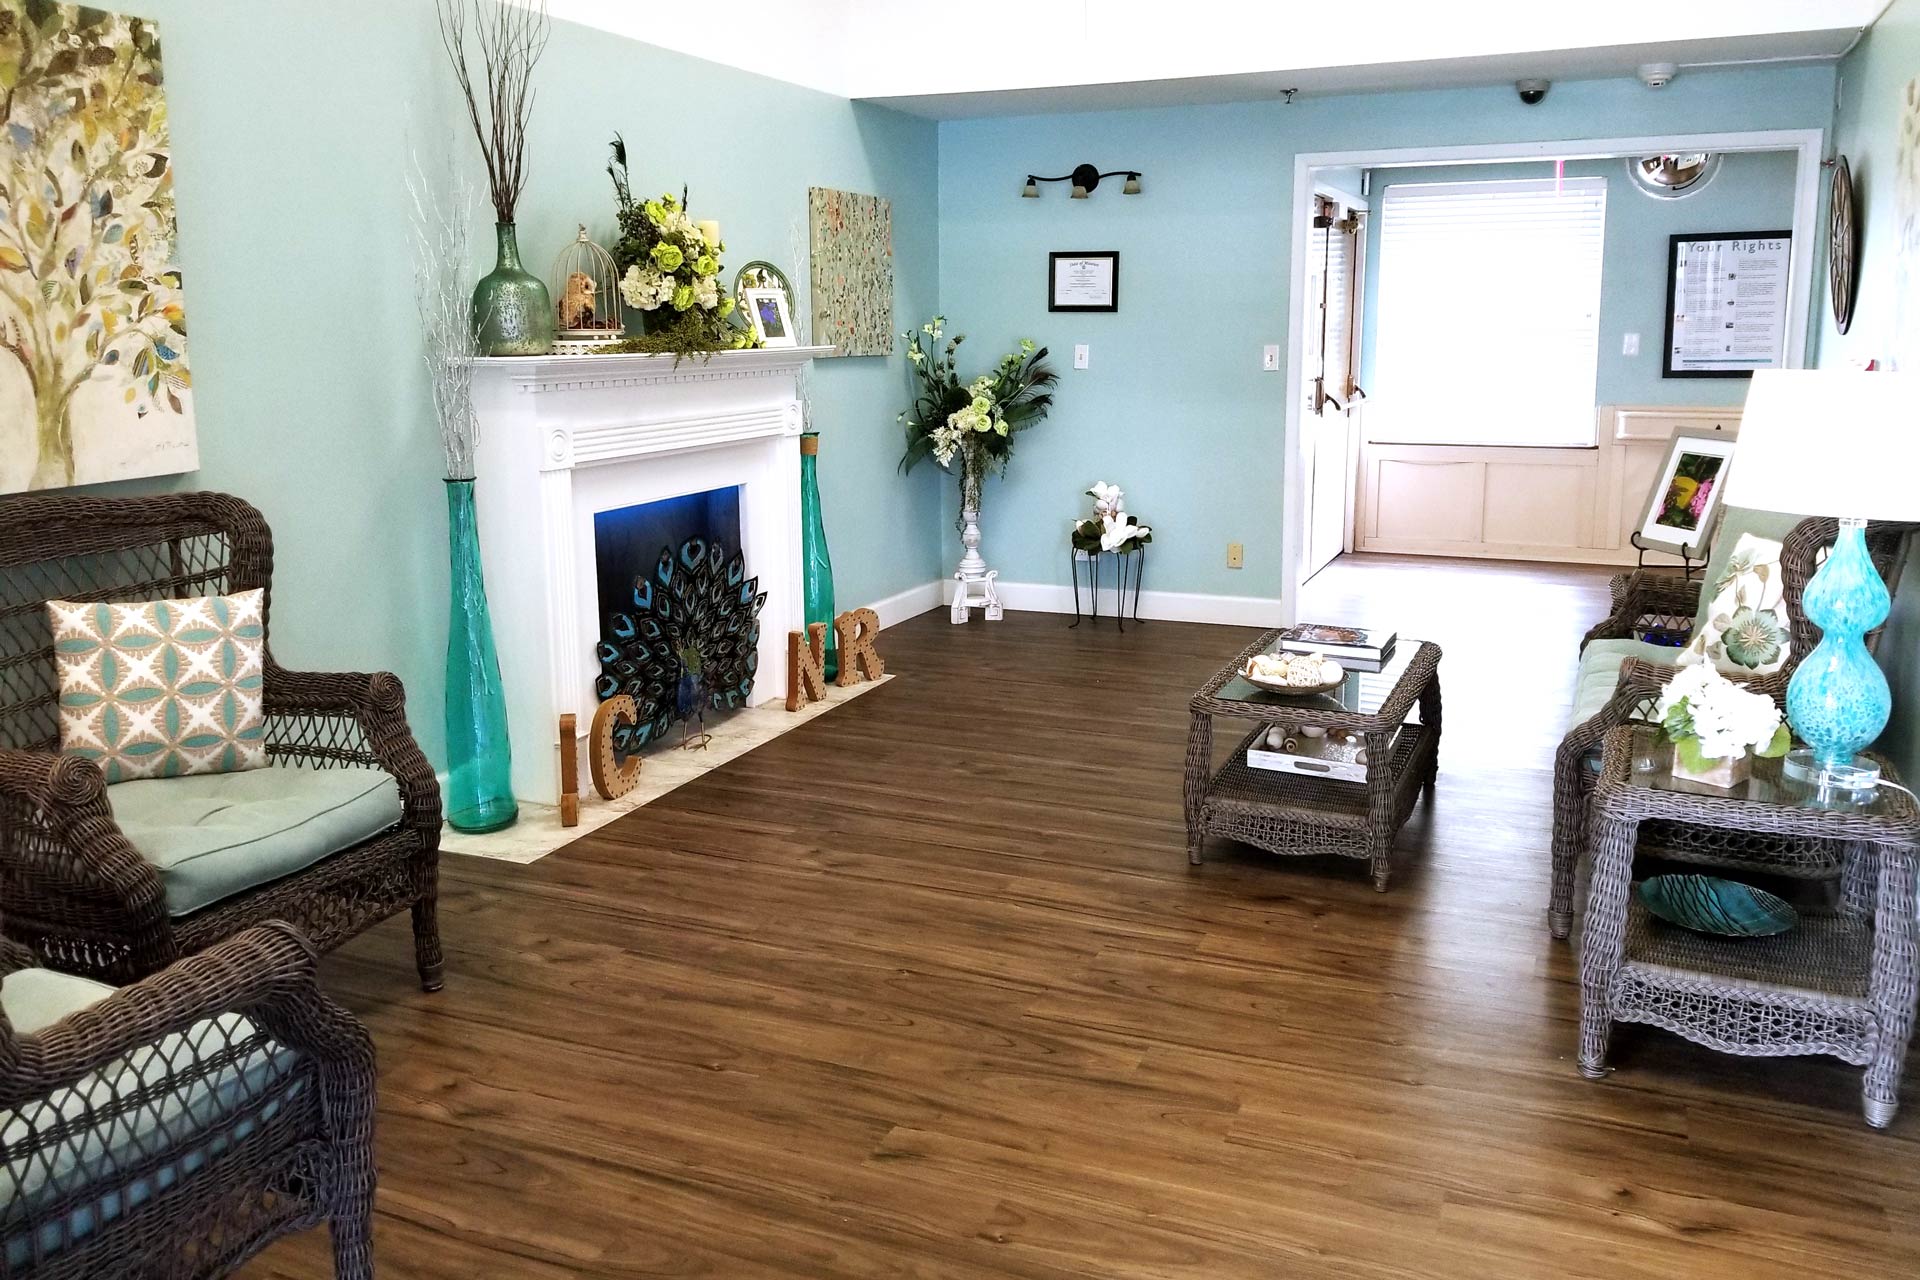
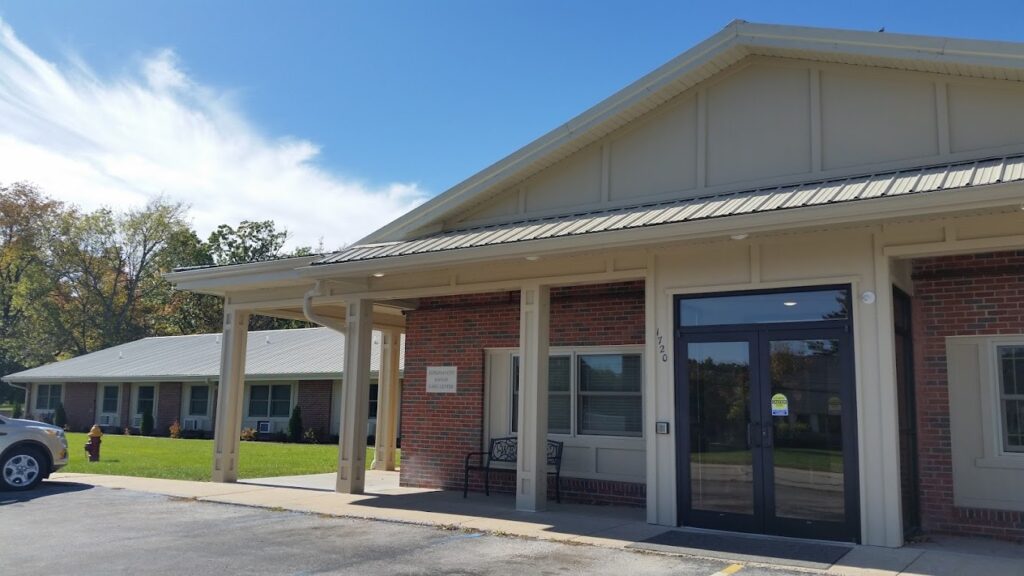
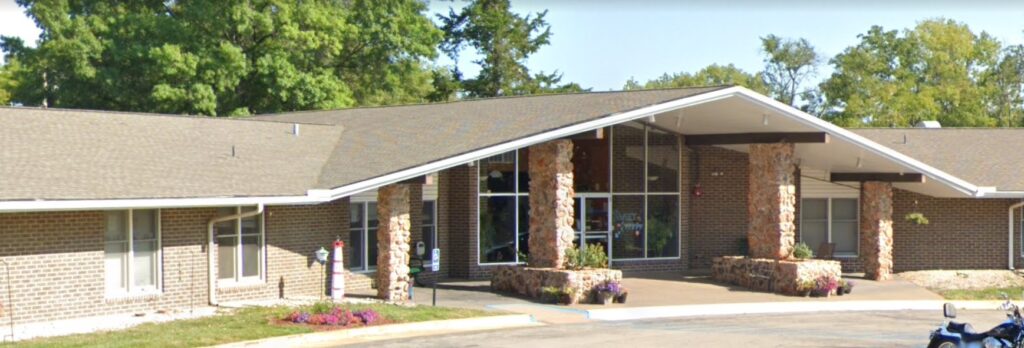
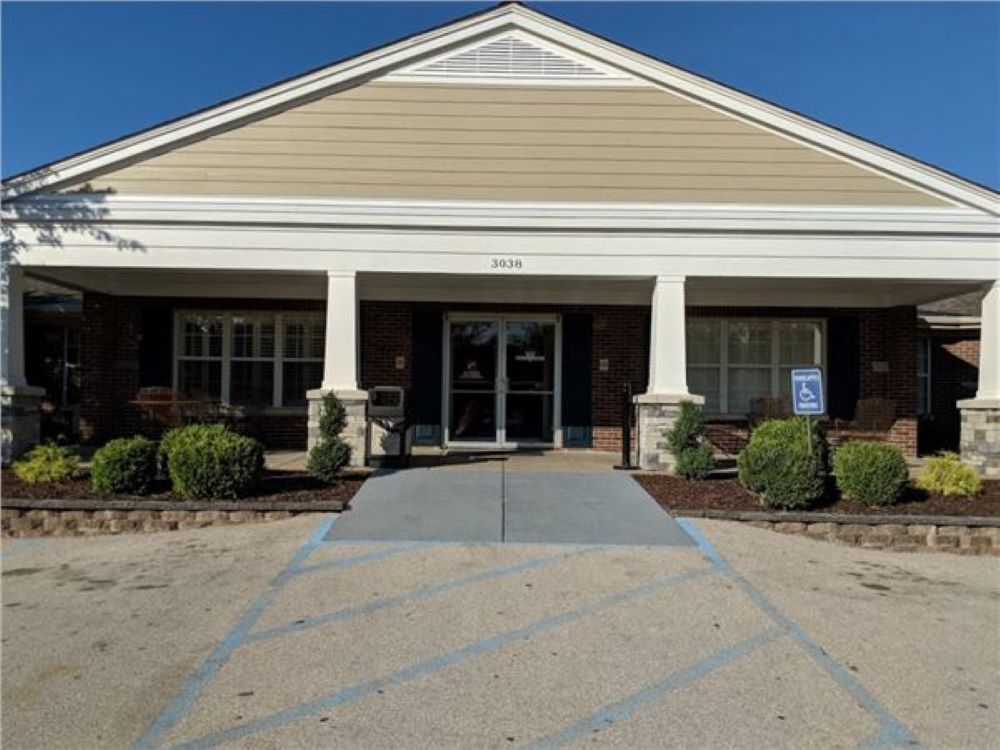
The Jefferson City Nursing and Rehabilitation Center stands as a beacon of excellence, delivering outstanding services that span from therapy to specialized memory care units. With a commitment to rapid recovery, their state-of-the-art suites offer a space for rejuvenation and healing, all within a vibrant and invigorating atmosphere. The memory care center boasts a secure environment with 28 dedicated beds, placing a strong emphasis on a family-oriented approach. This is evident not only in their family-style dining but also in the thoughtfully designed inclusive courtyard and serene outdoor spaces, providing a sense of comfort and togetherness.
A hallmark of the center is its unwavering dedication to cognitive stimulation for seniors, ensuring each day is filled with engaging activities that promote mental acuity and overall well-being. Beyond this, a comprehensive range of services is offered, including IV therapy, respiratory care, pain management, and even a beauty salon, reflecting their holistic approach to care. The vibrant community is characterized by its bold and contrasting colors, symbolizing a celebration of life in all its hues. Nestled in the heart of Jefferson City, this center stands as a testament to compassionate and quality care.

(573) 635-3131

Quality ratings

Measured by Centers for Medicare & Medicaid Services (CMS)

Overall rating Info The Overall CMS Rating combines results from health inspections, staffing levels and quality measures. Health inspections carry the most weight. Staffing and quality scores can increase or decrease the final rating based on performance compared to state and national standards.
2/5
Missouri average: 2.6/5
Health Inspection Info Based on the results of the facility's three most recent standard inspections and any complaint investigations. CMS reviews the number, scope, and severity of deficiencies, with more recent findings weighted more heavily.
2/5
Missouri average: 2.9/5
Staffing Info Measures average nursing staff hours per resident per day, including Registered Nurses (RNs) and total nursing staff. Ratings are adjusted based on the level of care residents require and are compared to state and national benchmarks.
2/5
Missouri average: 2.2/5
Quality Measures Info Based on clinical and physical health indicators reported to CMS, such as hospital readmissions, falls, pressure ulcers, and improvements in mobility. These measures reflect how well residents' health needs are being managed.
2/5
Missouri average: 2.8/5

Nursing care per resident

Info This shows how many total hours of nursing staff time are available per resident each day. Higher numbers usually mean more staff support.
4h 17m per day

This home provides 13% more nursing time per resident than the Missouri average.

Missouri average: 3h 48m per day

Capacity and availability

Medium-capacity home

Offers a balance of services and community atmosphere.

Total beds 120

This home usually has availability

Lower occupancy suggests more openings may be available.

Lower demand than the Missouri average
Occupancy rate 67.5%
Residents per day (avg) 80
Occupancy rate
67.5%
Residents per day (avg)
80

Who this home usually serves

TYPE OF STAY

Primarily short stays

Residents typically stay for brief periods, with frequent admissions and discharges throughout the year.

Might be optimal for
Post-acute recovery Temporary care Transitional stays

Breakdown by payment type

Medicare

25% of new residents, usually for short-term rehab.

Typical stay 3 - 4 months

Private pay

65% of new residents, often for short stays.

Typical stay 3 months

Medicaid

10% of new residents, often for long-term daily care.

Typical stay 4 - 5 years

Finances and operations

Privately-owned community
Home revenue
$8.3M
Operating loss
-$1.1M
Privately-owned community
Home revenue
$8,292,465.00
Operating loss
$-1,146,653.00
Payroll costs Info The portion of the home's budget spent on staff, including nurses, caregivers, and other employees who support care and operations.
$4.6M
55% of revenue
Other operating costs Info All remaining costs needed to run the home, such as food, utilities, building maintenance, supplies and administrative expenses.
$4.9M
Total costs $9.4M
Years in operation
21 years in operation
A longer operating history, which may indicate experience navigating regulations and delivering ongoing care.
Walk Score
Walk Score: 33 / 100
Somewhat walkable. A few nearby services may be reachable on foot, but most trips require transportation.
BBB Rating
BBB Rating: A+ (Not Accredited)
An independent rating from the Better Business Bureau based on factors such as complaint history, transparency, and business practices.
How BBB ratings work

Additional Licensing Details

CMS Certification Number265530

Staffing

Key information about the people who lead and staff this community.

Leadership

ContactRick Doerhoff, Executive Director

Types of Care at The Jefferson City Nursing and Rehabilitation Center

Memory Care Nursing Home
Contact The Jefferson City Nursing and Rehabilitation Center

Inspection History

In Missouri, the Department of Health and Senior Services, Division of Regulation and Licensure performs the inspections and unannounced surveys required for all long-term care providers.

9 visits/inspections

4 visits/inspections triggered by complaints

3 routine inspections

Results

9 with issues

0 without issues

Latest inspection

Date April 28, 2025
Complaint Investigation

34 deficiencies

Deficiencies indicate regulatory issues. A higher number implies the facility had several areas requiring improvement.

Missouri average: 35 deficiencies

Health Inspection History

Inspections
Total health inspections 9

Missouri average 6.6


Last Health inspection on Apr 2025

Total health citations 31

Missouri average 36.5

Citations per inspection
3.44

Missouri average 5.67


Health citations are formal notices following inspections when they fail to comply with safety and care standards.

21 of 31 citations resulted from standard inspections; and 10 of 31 resulted from complaint investigations.

Breakdown of citation severity (last 3 years)
Critical Health citations More info 2
186% worse than Missouri average

Missouri average: 0.7


Serious Health citations More info 1
In line with Missouri average

Missouri average: 1

2 critical citations More info Missouri average: 0.7

1 serious citation More info Missouri average: 1

28 moderate citations More info Missouri average: 33.6

0 minor citations More info Missouri average: 1.2
Citations history (last 3 years)
Resident Rights moderate citation Info Issues related to resident's rights, including dignity, privacy, and the ability to make decisions about their care. Apr 28, 2025
Corrected

Nursing Services moderate citation Info Issues related to the availability and quality of nursing staff and the care they provide. Mar 04, 2025
Corrected

Care Planning moderate citation Info Issues related to creating and updating personalized care plans for residents based on their needs and conditions. Mar 04, 2025
Corrected

Nutrition moderate citation Info Issues related to food quality, meal service, and resident's nutritional needs. Dec 19, 2024
Corrected

Compare Nursing Homes around Jefferson City The information below is reported by the Missouri Department of Health and Senior Services, Division of Regulation and Licensure.

5 facilities compared · CMS & MO Dept. of Health data · Updated Apr 2026

Filter by care type
Jefferson City Manor
NH

Nursing Home Licensed facility providing 24/7 skilled nursing care for residents with complex, ongoing medical needs. Staffed by RNs, LPNs, and CNAs. Inspected and star-rated annually by CMS. Accepts Medicare (short-term rehab) and Medicaid (long-term care).

AL

Assisted Living A licensed, long-term care setting for seniors or individuals with disabilities who need help with daily activities — like bathing, dressing, and medication management — but not 24-hour skilled nursing. Offers housing, meals, and around-the-clock support while aiming to maximize resident independence.

Jefferson City
102
70.2%
+5%
3.53
-26%
-5%
1
34
3.4
2
61
-
4
Juckette, Cynthia
$13.0M
$2.4M
18.3%
265285
1 Bed
Stonebridge Adams Street
NH

Nursing Home Licensed facility providing 24/7 skilled nursing care for residents with complex, ongoing medical needs. Staffed by RNs, LPNs, and CNAs. Inspected and star-rated annually by CMS. Accepts Medicare (short-term rehab) and Medicaid (long-term care).

AL

Assisted Living A licensed, long-term care setting for seniors or individuals with disabilities who need help with daily activities — like bathing, dressing, and medication management — but not 24-hour skilled nursing. Offers housing, meals, and around-the-clock support while aiming to maximize resident independence.

Jefferson City
120
44.9%
-33%
3.67
-14%
-2%
1
37
4.6
1
49
-
54
Volkart, Ruth
$5.1M
$2.3M
44.4%
265810
1 Bed
The Jefferson City Nursing and Rehabilitation Center
NH

Nursing Home Licensed facility providing 24/7 skilled nursing care for residents with complex, ongoing medical needs. Staffed by RNs, LPNs, and CNAs. Inspected and star-rated annually by CMS. Accepts Medicare (short-term rehab) and Medicaid (long-term care).

AL

Assisted Living A licensed, long-term care setting for seniors or individuals with disabilities who need help with daily activities — like bathing, dressing, and medication management — but not 24-hour skilled nursing. Offers housing, meals, and around-the-clock support while aiming to maximize resident independence.

Jefferson City
120
72.4%
+9%
4.28
-51%
+14%
2
31
3.4
3
80
A+
33
Gilbert, Victoria
$8.4M
$4.6M
54.6%
265530
1 Bed
River City Living Community
NH

Nursing Home Licensed facility providing 24/7 skilled nursing care for residents with complex, ongoing medical needs. Staffed by RNs, LPNs, and CNAs. Inspected and star-rated annually by CMS. Accepts Medicare (short-term rehab) and Medicaid (long-term care).

AL

Assisted Living A licensed, long-term care setting for seniors or individuals with disabilities who need help with daily activities — like bathing, dressing, and medication management — but not 24-hour skilled nursing. Offers housing, meals, and around-the-clock support while aiming to maximize resident independence.

Jefferson City
87
52.6%
-21%
5.38
+6%
+44%
2
44
4.4
2
38
-
17
-
$4.0M
$1.7M
41.5%
265482
1 Bed
Capitol River Wellness & Rehabilitation
-
NH

Nursing Home Licensed facility providing 24/7 skilled nursing care for residents with complex, ongoing medical needs. Staffed by RNs, LPNs, and CNAs. Inspected and star-rated annually by CMS. Accepts Medicare (short-term rehab) and Medicaid (long-term care).

AL

Assisted Living A licensed, long-term care setting for seniors or individuals with disabilities who need help with daily activities — like bathing, dressing, and medication management — but not 24-hour skilled nursing. Offers housing, meals, and around-the-clock support while aiming to maximize resident independence.

JEFFERSON CITY
120
-
-
-
-
-
-
-
-
0
0
0.0
0
-
-
-
-
-
-
-
-
-

Places of interest near The Jefferson City Nursing and Rehabilitation Center

Address 1.6 miles from city center — 0.47 miles to nearest hospital (OB/GYN Clinic-Jefferson City)

Address 1221 Southgate Ln, Jefferson City, MO 65109

Calculate Travel Distance to The Jefferson City Nursing and Rehabilitation Center

Add your location

Address

Staffing Data (Q2 2025)

This data corresponds to Q2 2025 and is based on CMS Payroll-Based Journal.

Total staff 131
Employees 122
Contractors 9
Staff to resident ratio 1.54:1
10% worse than Missouri average

Missouri average ratio: 1.71:1

Avg staff/day 49
Average shift 7.8 hours
0% compared with Missouri average

Missouri average: 8.1 hours

Total staff hours (quarter) 34,690
Nursing staff breakdown
Registered Nurse

Manages medical care and health needs.

Total count 5
Average shift length Info Average shift length. Calculated as total hours divided by days worked and average staff per day. 7.9 hours

No contractors work on this role.

Licensed Practical Nurse

Assists with medical care and medications.

Total count 31
Average shift length Info Average shift length. Calculated as total hours divided by days worked and average staff per day. 8 hours

This role is partially covered by contractors.

Certified Nursing Assistant

Helps with daily care and mobility.

Total count 44
Average shift length Info Average shift length. Calculated as total hours divided by days worked and average staff per day. 7.9 hours

No contractors work on this role.

Contractor staffing

Total hours from contractors

0.6%

196 contractor hours this quarter

Licensed Practical Nurse: 7 Medical Director: 1 Occupational Therapy Assistant: 1
Staff by category
Certified Nursing Assistant4404413,70591100%7.9
Licensed Practical Nurse247316,64391100%8
Physical Therapist170174,13291100%8
Medication Aide/Technician110112,53391100%8.1
Registered Nurse5051,7028897%7.9
Speech Language Pathologist5051,3157178%7.1
Physical Therapy Aide4048286976%6.3
RN Director of Nursing2027226167%9.5
Dietitian1015626875%8.3
Respiratory Therapy Technician2025286369%6.9
Mental Health Service Worker1015126369%8.1
Administrator1014645864%8
Nurse Practitioner1014405560%8
Qualified Social Worker2024025156%7.7
Physical Therapy Assistant2021643943%4.2
Medical Director011221516%1.5
Occupational Therapy Assistant01118910%2
44 Certified Nursing Assistant
% of Days 100%
31 Licensed Practical Nurse
% of Days 100%
17 Physical Therapist
% of Days 100%
11 Medication Aide/Technician
% of Days 100%
5 Registered Nurse
% of Days 97%
5 Speech Language Pathologist
% of Days 78%
4 Physical Therapy Aide
% of Days 76%
2 RN Director of Nursing
% of Days 67%
1 Dietitian
% of Days 75%
2 Respiratory Therapy Technician
% of Days 69%
1 Mental Health Service Worker
% of Days 69%
1 Administrator
% of Days 64%
1 Nurse Practitioner
% of Days 60%
2 Qualified Social Worker
% of Days 56%
2 Physical Therapy Assistant
% of Days 43%
1 Medical Director
% of Days 16%
1 Occupational Therapy Assistant
% of Days 10%

Facility Characteristics

Source: CMS Long-Term Care Facility Characteristics (Data as of Jan 2026)

Total census
85 residents
Residents by payment source
Medicare
9 residents (10.6%)
Medicaid
65 residents (76.5%)
Private pay or other
11 residents (12.9%)
Programs & Services
Residents' Group

Residents meet regularly to discuss policies, care quality, and activities

Active Resident Council

Organized group of residents that meets regularly to discuss facility policies, quality of life, and activities.

Quality of care over time

These measures show how residents usually do over time at this home, based on health outcomes and preventive care.

High-risk clinical events score Info A composite score based on pressure ulcers, falls with injury, weight loss, walking ability decline, and activities of daily living decline. 13.4
22% worse than Missouri average

Missouri average: 10.9

Functional decline score Info A composite score based on activities of daily living decline, walking ability decline, and incontinence. 21.4
10% worse than Missouri average

Missouri average: 19.5

Long-stay resident measures
Need for Help with Daily Activities Increased Info Percent of long-stay residents whose need for help with daily activities has increased 18.8%
5% better than Missouri average

Missouri average: 19.8%

Walking Ability Worsened Info Percent of long-stay residents whose ability to move independently worsened 27.6%
34% worse than Missouri average

Missouri average: 20.6%

Low Risk Residents with Bowel/Bladder Incontinence Info Percent of low risk long-stay residents who lose control of their bowels or bladder 17.8%
In line with Missouri average

Missouri average: 18.1%

Falls with Major Injury Info Percent of long-stay residents experiencing one or more falls with major injury 5.2%
29% worse than Missouri average

Missouri average: 4.0%

High Risk Residents with Pressure Ulcers Info Percent of long-stay high risk residents with pressure ulcers 11.6%
130% worse than Missouri average

Missouri average: 5.0%

Urinary Tract Infection Info Percent of long-stay residents with a urinary tract infection 2.7%
In line with Missouri average

Missouri average: 2.7%

Lost Too Much Weight Info Percent of long-stay residents who lose too much weight 3.7%
34% better than Missouri average

Missouri average: 5.6%

Depressive Symptoms Info Percent of long-stay residents who have depressive symptoms 0.4%
97% better than Missouri average

Missouri average: 12.8%

Antipsychotic Use Info Percent of long-stay residents who received an antipsychotic medication 17.0%
23% better than Missouri average

Missouri average: 22.0%

Pneumococcal Vaccine Info Percent of long-stay residents assessed and appropriately given the pneumococcal vaccine 83.1%
In line with Missouri average

Missouri average: 85.2%

Influenza Vaccine Info Percent of long-stay residents assessed and appropriately given the seasonal influenza vaccine 96.5%
6% better than Missouri average

Missouri average: 90.9%

Short-stay resident measures
Pneumococcal Vaccine Info Percent of short-stay residents assessed and appropriately given the pneumococcal vaccine 26.6%
60% worse than Missouri average

Missouri average: 66.6%

Antipsychotic medication increase Info Percent of short-stay residents who newly received an antipsychotic medication 6.7%
201% worse than Missouri average

Missouri average: 2.2%

Influenza Vaccine Info Percent of short-stay residents assessed and appropriately given the seasonal influenza vaccine 40.4%
36% worse than Missouri average

Missouri average: 63.5%

Penalties and fines

Federal penalties imposed by CMS for regulatory violations, including civil money penalties (fines) and denials of payment for new Medicare/Medicaid admissions.

Source: CMS Penalties Database (Data as of Jan 2026)

Total fines amount $27K
63% lower than Missouri average

Missouri average: $73K

Number of fines 2
18% fewer fines than Missouri average

Missouri average: 2.4

Payment Denials Info Serious action where Medicare and/or Medicaid temporarily stops payments for new residents until issues are fixed. 0
100% fewer payment denials than Missouri average

Missouri average: 0.7

Fines amount comparison
This facility $27K
Missouri average $73K
Penalty History

Penalties are imposed by CMS for violations of federal nursing home regulations.

Civil Money Penalty Info Fines imposed for noncompliance, which can be assessed per day or per instance of violation. Sep 29, 2023
$14K
Civil Money Penalty Info Fines imposed for noncompliance, which can be assessed per day or per instance of violation. Mar 3, 2023
$13K

Last updated: Jan 2026

Guides for Better Senior Living

Care Cost Calculator: See Prices in Your Area

Nursing Home Data Explorer

Don’t Wait Too Long: 7 Red Flag Signs Your Parent Needs Assisted Living Now

The True Cost of Assisted Living in 2025 – And How Families Are Paying For It

Understanding Senior Living Costs: Pricing Models, Discounts & Financial Assistance

Financial Aid for Missouri Seniors

Get financial aid guidance

Aged and Disabled Waiver

Missouri Medicaid A&D Waiver

Age 65+ or disabled, Missouri resident, Medicaid- eligible, nursing home-level care need.

~$2,829/month (300% FBR, individual).

$2,000 (individual), $3,000 (couple).

Rural access prioritized.

Missouri Supplemental Nursing Care (SNC)

MO SNC

Age 65+, Missouri resident, in approved facility.

~$1,215/month (individual).

$2,000 (individual).

Supplements SSI; facility-based only.

Structured Family Caregiving Waiver (SFCW)

Missouri Structured Family Caregiving Waiver

Age 65+, Missouri resident, MO HealthNet-eligible, NFLOC, dementia diagnosis, live with caregiver.

~$2,901/month (300% FBR, individual); QIT required.

$5,909.25 (individual), $11,818.45 (couple).

Caregiver must be family; small program size.

MO HealthNet Aged, Blind, and Disabled (ABD)

Missouri MO HealthNet ABD

Age 65+ or disabled, Missouri resident, MO HealthNet-eligible, needs help with 1+ ADL.

~$1,690/month (individual, projected); spenddown allowed.

$5,909.25 (individual), $11,818.45 (couple).

Less intensive than waivers; statewide access.

Medicare Savings Program (MSP)

Missouri Medicare Savings Program

Age 65+ or disabled, Missouri resident, Medicare Part A/B.

~$2,510/month (QMB), ~$3,380/month (SLMB), ~$3,598/month (QI)—individual.

$9,430 (individual), $14,130 (couple).

Three tiers; no waitlist; includes Extra Help for Part D.

Missouri Caregiver Program (Customized Caregiver Training & Relief)

Missouri Caregiver Program

Caregivers of 60+ with dementia, Missouri resident, functional needs (2+ ADLs).

No strict cap; prioritizes low-income (~$24,980/year individual).

Not assessed; need-based.

Administered via AAAs and Alzheimer’s Association; rural focus.

Senior Community Service Employment Program (SCSEP)

Missouri SCSEP

Age 55+, unemployed, low-income, Missouri resident.

~$1,983/month (125% FPL).

Not specified; income-focused.

Priority for veterans, rural residents; AARP partnership.

VA Aid and Attendance (A&A) and Housebound Benefits

Missouri VA Aid and Attendance/Housebound

Age 65+ or disabled veteran/spouse, Missouri resident, wartime service, need for ADL help (A&A) or homebound.

Net income < ~$1,984/month (veteran with dependent, A&A); pension offsets income.

~$155,356 (net worth limit).

High veteran demand in rural/urban areas.